Lodi, NJ (New Jersey) Houses and Residents
Estimated median house or condo value in 2022: $436,810 (it was $185,500 in 2000 )
Lodi:
$436,810New Jersey:
$428,900
Lower value quartile - upper value quartile: $329,266 - $546,116Mean price in 2022: Detached houses: $514,311 Here:
$514,311State:
$537,591
Townhouses or other attached units: $614,475 Here:
$614,475State:
$381,113
In 2-unit structures: $594,629 Here:
$594,629State:
$444,476
In 3-to-4-unit structures: $627,427 Here:
$627,427State:
$457,463
In 5-or-more-unit structures: $370,419 Here:
$370,419State:
$368,745
Mobile homes: $30,625 Here:
$30,625State:
$119,788
Total population: 24,654 (Urban population: 23,971, Rural population: 0)
Houses: 9,888 (9,337 occupied: 4,159 owner occupied, 5,227 renter occupied )
% of renters here:
56%State:
35%
Housing density: 4,369 houses/condos per square mile
Median price asked for vacant for-sale houses and condos in 2022: $2,465,926.
Median contract rent in 2022: $1,407 (lower quartile is $1,159, upper quartile is $1,751)
Median rent asked for vacant for-rent units in 2022: $1,409
Median gross rent in Lodi, NJ in 2022: $1,570
Housing units in Lodi with a mortgage: 2,584 (267 second mortgage, 0 home equity loan, 206 both second mortgage and home equity loan )Houses without a mortgage: 89
Median household income for houses/condos with a mortgage: $148,219
Median household income for apartments without a mortgage: $69,253
Median monthly housing costs: $1,601
Data:
Median house or condo value ($)
Median house or condo value ($ change since 2000)
Median house or condo value ($) - White
Median house or condo value ($) - Black or African American
Median house or condo value ($) - Asian
Median house or condo value ($) - Hispanic or Latino
Median house or condo value ($) - American Indian and Alaska Native
Median house or condo value ($) - Multirace
Median house or condo value ($) - Other Race
Median price asked for mobile homes ($)
Household density (households per square mile)
Mean house or condo value by units in structure - 1, detached ($)
Mean house or condo value by units in structure - 1, attached ($)
Mean house or condo value by units in structure - 2 ($)
Mean house or condo value by units in structure by units in structure - 3 or 4 ($)
Mean house or condo value by units in structure - 5 or more ($)
Mean house or condo value by units in structure - Boat, RV, van, etc. ($)
Mean house or condo value by units in structure - Mobile home ($)
Median contract rent ($)
Median contract rent - Lower quartile ($)
Median contract rent - Upper quartile ($)
Median gross rent ($)
Urban houses (%)
Rural houses (%)
Houses occupied (%)
Houses occupied (% change since 2000)
Houses owner occupied (%)
Houses owner occupied (% change since 2000)
Houses renter occupied (%)
Houses renter occupied (% change since 2000)
Vacant housing units - For rent (%)
Vacant housing units - For rent (% change since 2000)
Vacant housing units - For sale only (%)
Vacant housing units - For sale only (% change since 2000)
Vacant housing units - Rented or sold, not occupied (%)
Vacant housing units - Rented or sold, not occupied (% change since 2000)
Vacant housing units - For seasonal, recreational, or occasional use (%)
Vacant housing units - For seasonal, recreational, or occasional use (% change since 2000)
Vacant housing units - For migrant workers (%)
Vacant housing units - For migrant workers (% change since 2000)
Vacant housing units - Other vacant (%)
Vacant housing units - Other vacant (% change since 2000)
Median monthly housing costs ($)
Median household income for houses/condos with a mortgage ($)
Median household income for houses/condos without a mortgage ($)
Median household income ($)
Median household income ($) - White
Median household income ($) - Black or African American
Median household income ($) - Asian
Median household income ($) - Hispanic or Latino
Median household income ($) - American Indian and Alaska Native
Median household income ($) - Multirace
Median household income ($) - Other Race
Mortgage status - with mortgage (%)
Mortgage status - with second mortgage (%)
Mortgage status - with home equity loan (%)
Mortgage status - with both second mortgage and home equity loan (%)
Mortgage status - without a mortgage (%)
Median year house/condo built
Median year apartment built
Household type by relationship - Male householder living alone (%)
Household type by relationship - Male householder not living alone (%)
Household type by relationship - Female householder living alone (%)
Household type by relationship - Female householder not living alone (%)
Household type by relationship - Opposite-Sex spouse (%)
Household type by relationship - Same-Sex spouse (%)
Household type by relationship - Opposite-Sex unmarried partner (%)
Household type by relationship - Same-Sex unmarried partner (%)
Household type by relationship - In group quarters (%)
Size of family households - 2-person household (%)
Size of family households - 3-person household (%)
Size of family households - 4-person household (%)
Size of family households - 5-person household (%)
Size of family households - 6-person household (%)
Size of family households - 7-or-more-person household (%)
Size of nonfamily households - 1-person household (%)
Size of nonfamily households - 2-person household (%)
Size of nonfamily households - 3-person household (%)
Size of nonfamily households - 4-person household (%)
Size of nonfamily households - 5-person household (%)
Size of nonfamily households - 6-person household (%)
Size of nonfamily households - 7-or-moreperson household (%)
Year house built - Built 2010 or later (%)
Year house built - Built 2000 to 2009 (%)
Year house built - Built 1990 to 1999 (%)
Year house built - Built 1980 to 1989 (%)
Year house built - Built 1970 to 1979 (%)
Year house built - Built 1960 to 1969 (%)
Year house built - Built 1950 to 1959 (%)
Year house built - Built 1940 to 1949 (%)
Year house built - Built 1939 or earlier (%)
Median number of rooms in houses and condos
Median number of rooms in apartments
Median number of bedrooms in owner occupied houses
Mean number of bedrooms in owner occupied houses
Median number of bedrooms in renter occupied houses
Mean number of bedrooms in renter occupied houses
Median number of vehichles in owner occupied houses
Mean number of vehichles in owner occupied houses
Median number of vehichles in renter occupied houses
Mean number of vehichles in renter occupied houses
Rooms in owner-occupied houses - 1 room (%)
Rooms in owner-occupied houses - 2 rooms (%)
Rooms in owner-occupied houses - 3 rooms (%)
Rooms in owner-occupied houses - 4 rooms (%)
Rooms in owner-occupied houses - 5 rooms (%)
Rooms in owner-occupied houses - 6 rooms (%)
Rooms in owner-occupied houses - 7 rooms (%)
Rooms in owner-occupied houses - 8 rooms (%)
Rooms in owner-occupied houses - 9+ rooms (%)
Rooms in renter-occupied houses - 1 room (%)
Rooms in renter-occupied houses - 2 rooms (%)
Rooms in renter-occupied houses - 3 rooms (%)
Rooms in renter-occupied houses - 4 rooms (%)
Rooms in renter-occupied houses - 5 rooms (%)
Rooms in renter-occupied houses - 6 rooms (%)
Rooms in renter-occupied houses - 7 rooms (%)
Rooms in renter-occupied houses - 8 rooms (%)
Rooms in renter-occupied houses - 9+ rooms (%)
Bedrooms in owner-occupied houses - no bedrooms (%)
Bedrooms in owner-occupied houses - 1 bedroom (%)
Bedrooms in owner-occupied houses - 2 bedrooms (%)
Bedrooms in owner-occupied houses - 3 bedrooms (%)
Bedrooms in owner-occupied houses - 4 bedrooms (%)
Bedrooms in owner-occupied houses - 5+ bedrooms (%)
Bedrooms in renter-occupied houses - no bedrooms (%)
Bedrooms in renter-occupied houses - 1 bedroom (%)
Bedrooms in renter-occupied houses - 2 bedrooms (%)
Bedrooms in renter-occupied houses - 3 bedrooms (%)
Bedrooms in renter-occupied houses - 4 bedrooms (%)
Bedrooms in renter-occupied houses - 5+ bedrooms (%)
Vehicles available in owner-occupied houses - no vehicle available (%)
Vehicles available in owner-occupied houses - 1 vehicle available(%)
Vehicles available in owner-occupied houses - 2 Vehicles available (%)
Vehicles available in owner-occupied houses - 3 Vehicles available (%)
Vehicles available in owner-occupied houses - 4 Vehicles available (%)
Vehicles available in owner-occupied houses - 5+ Vehicles available (%)
Vehicles available in renter-occupied houses - no vehicle available (%)
Vehicles available in renter-occupied houses - 1 vehicle available (%)
Vehicles available in renter-occupied houses - 2 Vehicles available (%)
Vehicles available in renter-occupied houses - 3 Vehicles available (%)
Vehicles available in renter-occupied houses - 4 Vehicles available (%)
Vehicles available in renter-occupied houses - 5+ Vehicles available (%)
Housing units in structures - 1, detached (%)
Housing units in structures - 1, attached (%)
Housing units in structures - 2 (%)
Housing units in structures - 3 or 4 (%)
Housing units in structures - 5 to 9 (%)
Housing units in structures - 10 to 19 (%)
Housing units in structures - 20 to 49 (%)
Housing units in structures - 50 or more (%)
Housing units in structures - Mobile home (%)
Housing units in structures - Boat, RV, van, etc. (%)
Housing units in structures - Owners - 1, detached (%)
Housing units in structures - Owners - 1, attached (%)
Housing units in structures - Owners - 2 (%)
Housing units in structures - Owners - 3 or 4 (%)
Housing units in structures - Owners - 5 to 9 (%)
Housing units in structures - Owners - 10 to 19 (%)
Housing units in structures - Owners - 20 to 49 (%)
Housing units in structures - Owners - 50 or more (%)
Housing units in structures - Owners - Mobile home (%)
Housing units in structures - Owners - Boat, RV, van, etc. (%)
Housing units in structures - Renters - 1, detached (%)
Housing units in structures - Renters - 1, attached (%)
Housing units in structures - Renters - 2 (%)
Housing units in structures - Renters - 3 or 4 (%)
Housing units in structures - Renters - 5 to 9 (%)
Housing units in structures - Renters - 10 to 19 (%)
Housing units in structures - Renters - 20 to 49 (%)
Housing units in structures - Renters - 50 or more (%)
Housing units in structures - Renters - Mobile home (%)
Housing units in structures - Renters - Boat, RV, van, etc. (%)
House/condo owner moved in on average (years ago)
Renter moved in on average (years ago)
Year householder moved into unit - Moved in 1999 to March 2000 (%)
Year householder moved into unit - Moved in 1999 to March 2000 (%) - White
Year householder moved into unit - Moved in 1999 to March 2000 (%) - Black or African American
Year householder moved into unit - Moved in 1999 to March 2000 (%) - Asian
Year householder moved into unit - Moved in 1999 to March 2000 (%) - Hispanic or Latino
Year householder moved into unit - Moved in 1999 to March 2000 (%) - American Indian and Alaska Native
Year householder moved into unit - Moved in 1999 to March 2000 (%) - Multirace
Year householder moved into unit - Moved in 1999 to March 2000 (%) - Other Race
Year householder moved into unit - Moved in 1995 to 1998 (%)
Year householder moved into unit - Moved in 1995 to 1998 (%) - White
Year householder moved into unit - Moved in 1995 to 1998 (%) - Black or African American
Year householder moved into unit - Moved in 1995 to 1998 (%) - Asian
Year householder moved into unit - Moved in 1995 to 1998 (%) - Hispanic or Latino
Year householder moved into unit - Moved in 1995 to 1998 (%) - American Indian and Alaska Native
Year householder moved into unit - Moved in 1995 to 1998 (%) - Multirace
Year householder moved into unit - Moved in 1995 to 1998 (%) - Other Race
Year householder moved into unit - Moved in 1990 to 1994 (%)
Year householder moved into unit - Moved in 1990 to 1994 (%) - White
Year householder moved into unit - Moved in 1990 to 1994 (%) - Black or African American
Year householder moved into unit - Moved in 1990 to 1994 (%) - Asian
Year householder moved into unit - Moved in 1990 to 1994 (%) - Hispanic or Latino
Year householder moved into unit - Moved in 1990 to 1994 (%) - American Indian and Alaska Native
Year householder moved into unit - Moved in 1990 to 1994 (%) - Multirace
Year householder moved into unit - Moved in 1990 to 1994 (%) - Other Race
Year householder moved into unit - Moved in 1980 to 1989 (%)
Year householder moved into unit - Moved in 1980 to 1989 (%) - White
Year householder moved into unit - Moved in 1980 to 1989 (%) - Black or African American
Year householder moved into unit - Moved in 1980 to 1989 (%) - Asian
Year householder moved into unit - Moved in 1980 to 1989 (%) - Hispanic or Latino
Year householder moved into unit - Moved in 1980 to 1989 (%) - American Indian and Alaska Native
Year householder moved into unit - Moved in 1980 to 1989 (%) - Multirace
Year householder moved into unit - Moved in 1980 to 1989 (%) - Other Race
Year householder moved into unit - Moved in 1970 to 1979 (%)
Year householder moved into unit - Moved in 1970 to 1979 (%) - White
Year householder moved into unit - Moved in 1970 to 1979 (%) - Black or African American
Year householder moved into unit - Moved in 1970 to 1979 (%) - Asian
Year householder moved into unit - Moved in 1970 to 1979 (%) - Hispanic or Latino
Year householder moved into unit - Moved in 1970 to 1979 (%) - American Indian and Alaska Native
Year householder moved into unit - Moved in 1970 to 1979 (%) - Multirace
Year householder moved into unit - Moved in 1970 to 1979 (%) - Other Race
Year householder moved into unit - Moved in 1969 or earlier (%)
Year householder moved into unit - Moved in 1969 or earlier (%) - White
Year householder moved into unit - Moved in 1969 or earlier (%) - Black or African American
Year householder moved into unit - Moved in 1969 or earlier (%) - Asian
Year householder moved into unit - Moved in 1969 or earlier (%) - Hispanic or Latino
Year householder moved into unit - Moved in 1969 or earlier (%) - American Indian and Alaska Native
Year householder moved into unit - Moved in 1969 or earlier (%) - Multirace
Year householder moved into unit - Moved in 1969 or earlier (%) - Other Race
Housing units lacking complete plumbing facilities (%)
Housing units lacking complete kitchen facilities (%)
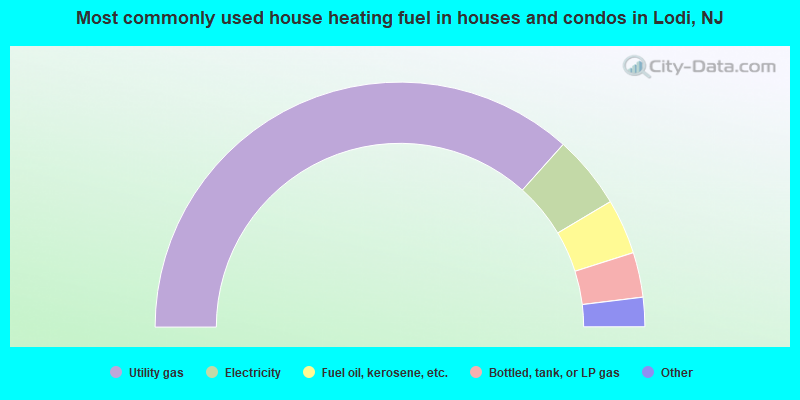
House heating fuel used in houses and condos - Utility gas (%)
House heating fuel used in houses and condos - Bottled, tank, or LP gas (%)
House heating fuel used in houses and condos - Electricity (%)
House heating fuel used in houses and condos - Fuel oil, kerosene, etc. (%)
House heating fuel used in houses and condos - Coal or coke (%)
House heating fuel used in houses and condos - Wood (%)
House heating fuel used in houses and condos - Solar energy (%)
House heating fuel used in houses and condos - Other fuel (%)
House heating fuel used in houses and condos - No fuel used (%)
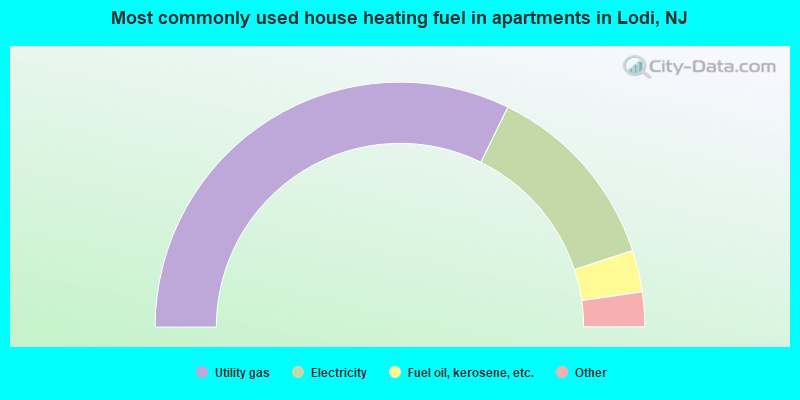
House heating fuel used in apartments - Utility gas (%)
House heating fuel used in apartments - Bottled, tank, or LP gas (%)
House heating fuel used in apartments - Electricity (%)
House heating fuel used in apartments - Fuel oil, kerosene, etc. (%)
House heating fuel used in apartments - Coal or coke (%)
House heating fuel used in apartments - Wood (%)
House heating fuel used in apartments - Solar energy (%)
House heating fuel used in apartments - Other fuel (%)
House heating fuel used in apartments - No fuel used (%)
Latest news about housing in Lodi, NJ collected exclusively by city-data.com from local newspapers, TV, and radio stations
Median year house/condo built: 1955Median year apartment built: 1965Household type by relationship:
Households: 25,962
Male householders: 4,456 (1,157 living alone ), Female householders: 4,819 (1,113 living alone )4,002 spouses (3,986 opposite-sex spouses ), 968 unmarried partners , (913 opposite-sex unmarried partners ), 7,975 children (7,657 natural , 175 adopted , 142 stepchildren ), 217 grandchildren , 390 brothers or sisters , 1,398 parents , 0 foster children , 828 other relatives , 748 non-relatives In group quarters: 152
Size of family households: 2,082 2-persons , 1,578 3-persons , 1,246 4-persons , 876 5-persons , 427 6-persons , 147 7-or-more-persons .
Size of nonfamily households: 2,347 1-person , 586 2-persons , 155 3-persons .
3,189 married couples with children. single-parent households (102 men , 1,809 women ).
45.7% of residents of Lodi speak English at home. of residents speak Spanish at home (57% speak English very well , 20% speak English well , 14% speak English not well , 8% don't speak English at all ).of residents speak other Indo-European language at home (55% speak English very well , 29% speak English well , 11% speak English not well , 5% don't speak English at all ).of residents speak Asian or Pacific Island language at home (61% speak English very well , 24% speak English well , 14% speak English not well , 1% don't speak English at all ).of residents speak other language at home (65% speak English very well , 16% speak English well , 14% speak English not well , 5% don't speak English at all ).
Foreign born population: 10,935 (42.1%)of them are naturalized citizens )
Median number of rooms in houses and condos:
Median number of rooms in apartments
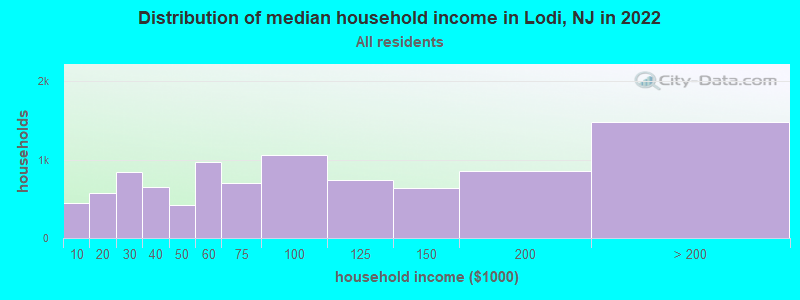
Lodi, NJ household income distribution 451 Less than $10,000571 $10,000 to $19,999842 $20,000 to $29,999647 $30,000 to $39,999421 $40,000 to $49,999976 $50,000 to $59,999707 $60,000 to $74,9991,057 $75,000 to $99,999745 $100,000 to $124,999635 $125,000 to $149,999858 $150,000 to $199,9991,480 $200,000 or more
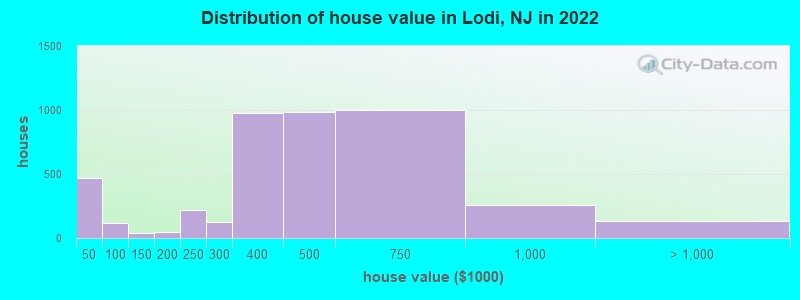
Home value of owner - occupied houses in 2022 in Lodi, NJ 85 Less than $10,00022 $10,000 to $14,999234 $25,000 to $29,99989 $30,000 to $34,99916 $35,000 to $39,99916 $40,000 to $49,9997 $50,000 to $59,99994 $80,000 to $89,99919 $100,000 to $124,99917 $125,000 to $149,99925 $150,000 to $174,99922 $175,000 to $199,999220 $200,000 to $249,999124 $250,000 to $299,999974 $300,000 to $399,999984 $400,000 to $499,999999 $500,000 to $749,999254 $750,000 to $999,999129 $2,000,000 or moreRent paid by renters in 2022 in Lodi, NJ 12 Less than $10015 $100 to $14911 $150 to $1993 $250 to $29988 $350 to $399137 $500 to $54964 $550 to $59952 $600 to $64996 $650 to $69965 $700 to $7498 $750 to $79994 $800 to $89994 $900 to $999870 $1,000 to $1,2491,461 $1,250 to $1,4991,448 $1,500 to $1,999484 $2,000 to $2,499106 $2,500 to $2,999118 No cash rent
Percentage of workers working in this county: 69.1%Number of people working at home: 1,064 (7.9% of all workers )
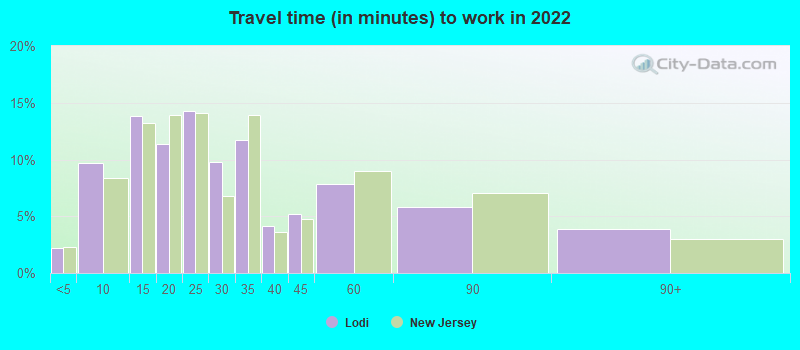
Travel time to work (commute)
Less than 5 minutes: 1745 to 9 minutes: 1,07010 to 14 minutes: 2,29615 to 19 minutes: 1,55120 to 24 minutes: 1,52125 to 29 minutes: 96430 to 34 minutes: 1,45935 to 39 minutes: 51840 to 44 minutes: 54645 to 59 minutes: 83860 to 89 minutes: 84690 or more minutes: 393
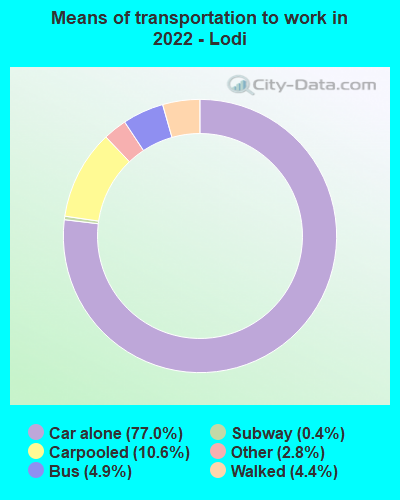
Means of transportation to work:
Drove a car alone: 3,685 (61.8%)Carpooled: 608 (10.2%)Bus : 214 (3.6%)Long-distance train or commuter rail : 10 (0.2%)Taxi: 152 (2.5%)Walked: 226 (3.8%)Worked at home: 1,064 (17.8%)
Unemployment by race in 2022
Unemployment rate for White non-Hispanic residents 6.9% Males4.9% FemalesUnemployment rate for Black residents 3.7% MalesUnemployment rate for Asian residents 11.5% Males6.6% FemalesUnemployment rate for other race residents 1.9% MalesUnemployment rate for two or more race residents 6.8% Males7.6% FemalesUnemployment rate for Hispanic or Latino residents 3.8% Males4.9% Females
Year of entry for the foreign-born population in Lodi, New Jersey
3,094 2010 or later 2,294 2000 to 2009 2,793 1990 to 1999 2,144 1980 to 1989 896 1970 to 1979 1,333 Before 1970
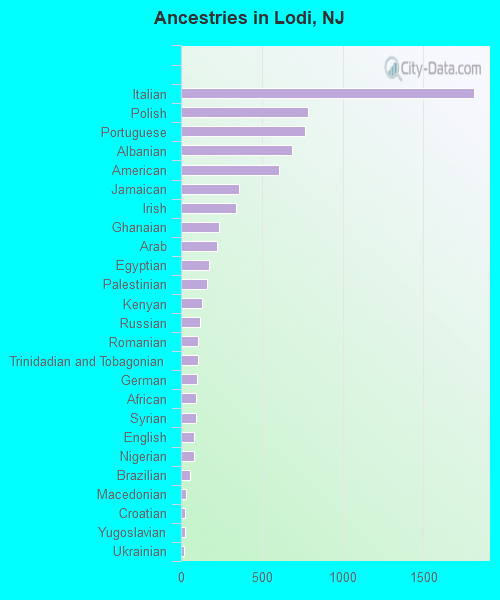
First ancestries reported:
Italian: 1,815 (11.1%)
Polish: 787 (4.8%)
Portuguese: 770 (4.7%)
Albanian: 686 (4.2%)
American: 606 (3.7%)
Jamaican: 359 (2.2%)
Irish: 343 (2.1%)
Ghanaian: 233 (1.4%)
Arab: 225 (1.4%)
Egyptian: 172 (1.1%)
Palestinian: 161 (1.0%)
Kenyan: 128 (0.8%)
Russian: 120 (0.7%)
Romanian: 108 (0.7%)
Trinidadian and Tobagonian: 104 (0.6%)
German: 98 (0.6%)
African: 94 (0.6%)
Syrian: 90 (0.6%)
English: 83 (0.5%)
Nigerian: 81 (0.5%)
Brazilian: 54 (0.3%)
Macedonian: 30 (0.2%)
Croatian: 25 (0.2%)
Yugoslavian: 23 (0.1%)
Ukrainian: 17 (0.1%)
Dutch: 15 (0.09%)
Bulgarian: 10 (0.06%)
Scottish: 10 (0.06%)
Hungarian: 9 (0.06%)
Turkish: 8 (0.05%)
European: 7 (0.04%)
Greek: 7 (0.04%)
Slavic: 7 (0.04%)
French Canadian: 5 (0.03%) Most common places of birth for foreign-born residents (%): Colombia Lodi:
15.5% (1,697)New Jersey:
4.2% (90,817)
Ecuador Lodi:
11.1% (1,215)New Jersey:
4.4% (95,275)
Dominican Republic Lodi:
8.6% (943)New Jersey:
9.7% (209,055)
Peru Lodi:
6.9% (759)New Jersey:
2.7% (58,563)
Philippines Lodi:
5.4% (593)New Jersey:
4.0% (85,934)
Honduras Lodi:
5.4% (590)New Jersey:
1.7% (37,335)
Albania Lodi:
4.8% (522)New Jersey:
0.3% (6,130)
Portugal Lodi:
4.3% (466)New Jersey:
1.3% (28,871)
India Lodi:
3.4% (367)New Jersey:
12.8% (274,609)
Poland Lodi:
3.1% (337)New Jersey:
2.3% (48,811)
Jamaica Lodi:
2.9% (312)New Jersey:
2.2% (47,365)
Mexico Lodi:
2.7% (293)New Jersey:
4.8% (102,527)
Italy Lodi:
2.4% (264)New Jersey:
1.5% (33,198)
Nigeria Lodi:
1.9% (208)New Jersey:
1.2% (25,213)
Pakistan Lodi:
1.8% (194)New Jersey:
1.3% (27,580)
Brazil Lodi:
1.5% (169)New Jersey:
2.1% (46,020)
Place of birth for U.S.-born residents:
This state: 11,565Other state: 3,335Northeast: 2,770Midwest: 173South: 278West: 84 88.1% of Lodi residents lived in the same house 1 years ago.
Out of people who lived in different houses, 39.4% lived in this county.
Out of people who lived in different counties, 67.6% lived in New Jersey.
Lodi:
88.1%State average:
90.4%
Education attainment for males 25 years and older:
No schooling: 481Nursery to 4th grade: 1745th and 6th grade: 1227th and 8th grade: 2379th grade: 5510th grade: 11411th grade: 1212th grade, no diploma: 192High school graduate (or equivalency): 2,837Less than 1 year of college: 734Some college more than 1 year, no degree: 916Associate degree: 835Bachelor's degree: 1,298Master's degree: 700Professional school degree: 37Doctorate degree: 65
Education attainment for females 25 years and older:
No schooling: 377Nursery to 4th grade: 875th and 6th grade: 2957th and 8th grade: 1249th grade: 7110th grade: 7611th grade: 18412th grade, no diploma: 248High school graduate (or equivalency): 2,541Less than 1 year of college: 673Some college more than 1 year, no degree: 548Associate degree: 1,188Bachelor's degree: 1,847Master's degree: 939Professional school degree: 192Doctorate degree: 12
Housing units in structures:
One, detached: 2,453One, attached: 426Two: 4,1763 or 4: 1,0455 to 9: 45010 to 19: 26820 to 49: 50050 or more: 244Mobile homes: 255Boats, RVs, vans, etc.: 66Housing units lacking complete plumbing facilities in 2022: 1.7%Housing units lacking complete kitchen facilities in 2022: 2.4%House/condo owner moved in on average 17 years ago
Renter moved in on average 3 years ago
Private vs. public school enrollment:
Students in private schools in grades 1 to 8 (elementary and middle school): 134 Here:
6.0%New Jersey:
12.3%
Students in private schools in grades 9 to 12 (high school): 183 Here:
12.2%New Jersey:
13.1%
Students in private undergraduate colleges: 207 Here:
20.0%New Jersey:
33.2%