Livingston, NJ (New Jersey) Houses and Residents
| Livingston: | $759,246 |
| New Jersey: | $428,900 |
Total population: 26,590 (All urban)
Houses: 9,457 (9,300 occupied: 8,719 owner occupied, 581 renter occupied)
| % of renters here: | 6% |
| State: | 35% |
Housing density: 681 houses/condos per square mile
Median price asked for vacant for-sale houses and condos in 2022 in this county: $231,294.
Median contract rent in 2022: over $2,000 (lower quartile is over $2,000, upper quartile is over $2,000)
Median rent asked for vacant for-rent units in 2022: $2,621
Median gross rent in Livingston, NJ in 2022: over $2,000
Housing units in Livingston with a mortgage: 5,733 (459 second mortgage, 871 home equity loan, 26 both second mortgage and home equity loan)
Houses without a mortgage: 2,700
Compare current foreclosures in Livingston, NJ:
| Photo | Address | Area | Beds / Baths | Price | Details |
|---|---|---|---|---|---|

|
#1
Glannon Rd
Livingston, NJ 07039
|
- sq. feet
|
1 baths 3 beds |
$535,600
|
show details |

|
#2
Cedar Gate 43
Livingston, NJ 07039
|
- sq. feet
|
- baths - beds |
show details | |

|
#3
Irving Ave
Livingston, NJ 07039
|
1,148 sq. feet
|
- baths - beds |
show details | |

|
#4
North Dr
Livingston, NJ 07039
|
- sq. feet
|
- baths - beds |
show details | |

|
#5
Grand Ter
Livingston, NJ 07039
|
- sq. feet
|
- baths - beds |
show details | |

|
#6
Camelot Dr
Livingston, NJ 07039
|
- sq. feet
|
- baths - beds |
show details | |

|
#7
Cedar Gate Ct # 43
Livingston, NJ 07039
|
- sq. feet
|
- baths - beds |
show details | |

|
#8
Mount Pleasant Pkwy
Livingston, NJ 07039
|
- sq. feet
|
- baths - beds |
show details | |

|
#9
E Harrison Pl
Livingston, NJ 07039
|
- sq. feet
|
- baths - beds |
show details | |

|
#10
Hearthstone Ter
Livingston, NJ 07039
|
- sq. feet
|
- baths - beds |
show details |
| Photo | Address | Area | Beds / Baths | Price | Details |
|---|---|---|---|---|---|

|
#11
Chestnut St
Livingston, NJ 07039
|
6,530 sq. feet
|
- baths - beds |
show details | |

|
#12
Mounthaven Dr
Livingston, NJ 07039
|
1,195 sq. feet
|
- baths - beds |
show details | |

|
#13
E Northfield Rd Ste Ll5
Livingston, NJ 07039
|
- sq. feet
|
- baths - beds |
show details | |

|
#14
Glannon Rd
Livingston, NJ 07039
|
1,708 sq. feet
|
- baths - beds |
show details | |

|
#15
Brookside Pl
Livingston, NJ 07039
|
1,200 sq. feet
|
- baths - beds |
show details | |

|
#16
Wellington Rd
Livingston, NJ 07039
|
2,134 sq. feet
|
- baths - beds |
show details | |

|
#17
Brighton Ct
Livingston, NJ 07039
|
- sq. feet
|
- baths - beds |
show details | |

|
#18
Mohawk Dr
Livingston, NJ 07039
|
- sq. feet
|
- baths - beds |
show details | |

|
#19
Crestview Hill Rd
Livingston, NJ 07039
|
- sq. feet
|
- baths - beds |
show details | |

|
#20
Regal Blvd
Livingston, NJ 07039
|
- sq. feet
|
- baths - beds |
show details |
| Photo | Address | Area | Beds / Baths | Price | Details |
|---|---|---|---|---|---|

|
#21
Burnet Hill Rd
Livingston, NJ 07039
|
- sq. feet
|
- baths - beds |
show details | |

|
#22
N Livingston Ave
Livingston, NJ 07039
|
- sq. feet
|
- baths - beds |
show details | |

|
#23
E Northfield Rd
Livingston, NJ 07039
|
- sq. feet
|
- baths - beds |
show details | |

|
#24
Boynton Dr
Livingston, NJ 07039
|
- sq. feet
|
- baths - beds |
show details | |

|
#25
Redwood Rd
Livingston, NJ 07039
|
- sq. feet
|
- baths - beds |
show details | |

|
#26
E Mcclellan Ave
Livingston, NJ 07039
|
- sq. feet
|
- baths - beds |
show details | |

|
#27
Hazelwood Ave
Livingston, NJ 07039
|
- sq. feet
|
- baths - beds |
show details | |

|
#28
E Hobart Gap Rd
Livingston, NJ 07039
|
- sq. feet
|
- baths - beds |
show details | |

|
#29
Wynnewood Rd
Livingston, NJ 07039
|
- sq. feet
|
- baths - beds |
show details | |

|
#30
W Northfield Rd
Livingston, NJ 07039
|
- sq. feet
|
- baths - beds |
show details |
| Photo | Address | Area | Beds / Baths | Price | Details |
|---|---|---|---|---|---|

|
#31
Brentwood Dr
Livingston, NJ 07039
|
- sq. feet
|
- baths - beds |
show details | |

|
#32
Collinwood Ave
Livingston, NJ 07039
|
- sq. feet
|
- baths - beds |
show details | |

|
#33
Drummond Ter
Livingston, NJ 07039
|
- sq. feet
|
- baths - beds |
show details | |

|
#34
S Livingston Ave
Livingston, NJ 07039
|
- sq. feet
|
- baths - beds |
show details | |

|
#35
Morningside Dr
Livingston, NJ 07039
|
- sq. feet
|
- baths - beds |
show details | |

|
#36
Mount Pleasant Pkwy
Livingston, NJ 07039
|
- sq. feet
|
- baths - beds |
show details | |

|
#37
N Ridge Rd
Livingston, NJ 07039
|
- sq. feet
|
- baths - beds |
show details | |

|
#38
W Mount Pleasant Ave
Livingston, NJ 07039
|
- sq. feet
|
- baths - beds |
show details | |

|
#39
Schindler Way
Livingston, NJ 07039
|
- sq. feet
|
- baths - beds |
show details | |

|
#40
Burlington Rd
Livingston, NJ 07039
|
- sq. feet
|
- baths - beds |
show details |
| Photo | Address | Area | Beds / Baths | Price | Details |
|---|---|---|---|---|---|

|
#41
Hazelwood Ave
Livingston, NJ 07039
|
- sq. feet
|
- baths - beds |
show details | |

|
#42
Laurel Ave
Livingston, NJ 07039
|
- sq. feet
|
- baths - beds |
show details | |

|
#43
Mount Pleasant Pkwy
Livingston, NJ 07039
|
- sq. feet
|
- baths - beds |
show details | |

|
#44
Mounthaven Dr
Livingston, NJ 07039
|
- sq. feet
|
- baths - beds |
show details | |

|
#45
Badger Dr
Livingston, NJ 07039
|
- sq. feet
|
- baths - beds |
show details | |

|
#46
Dawson Ter
Livingston, NJ 07039
|
- sq. feet
|
- baths - beds |
show details | |

|
#47
Palmer Dr
Livingston, NJ 07039
|
- sq. feet
|
- baths - beds |
show details | |

|
Check over 1 million property listings on Foreclosure.com!
|
browse all offers | |||
Latest news about housing in Livingston, NJ collected exclusively by city-data.com from local newspapers, TV, and radio stations


Household type by relationship:
Households: 760,197- In family households: 645,040 (104,343 male householders, 84,996 female householders)
113,673 spouses, 245,726 children (232,723 natural, 5,793 adopted, 7,210 stepchildren), 20,627 grandchildren, 15,422 brothers or sisters, 11,923 parents, foster children, 19,910 other relatives, 22,762 non-relatives
- In nonfamily households: 115,157 (42,135 male householders (33,262 living alone)), 52,238 female householders (45,266 living alone)), 20,784 nonrelatives
- In group quarters: 23,772 (12,126 institutionalized population)
108,634 married couples with children.
65,899 single-parent households (10,059 men, 55,840 women).
75.4% of residents of Livingston speak English at home.
2.8% of residents speak Spanish at home (63% speak English very well, 22% speak English well, 12% speak English not well, 3% don't speak English at all).
9.1% of residents speak other Indo-European language at home (70% speak English very well, 21% speak English well, 8% speak English not well, 1% don't speak English at all).
11.0% of residents speak Asian or Pacific Island language at home (56% speak English very well, 27% speak English well, 14% speak English not well, 3% don't speak English at all).
1.7% of residents speak other language at home (86% speak English very well, 13% speak English well, 2% speak English not well).
Foreign born population: 7,632 (26.0%)
(79.5% of them are naturalized citizens)
| Here: | 7.8 |
| State: | 6.8 |
| Here: | 5.5 |
| State: | 3.9 |

- Bedrooms in owner-occupied houses and condos in Livingston, New Jersey
- 0no bedroom
- 431 bedroom
- 4642 bedrooms
- 4,0753 bedrooms
- 3,0824 bedrooms
- 1,0555+ bedrooms

- Bedrooms in renter-occupied apartments in Livingston, New Jersey
- 0no bedroom
- 2271 bedroom
- 1202 bedrooms
- 1393 bedrooms
- 754 bedrooms
- 205+ bedrooms

- Cars and other vehicles available in Livingston in owner-occupied houses/condos
- 110no vehicle
- 1,7171 vehicle
- 4,8522 vehicles
- 1,5483 vehicles
- 3754 vehicles
- 1175+ vehicles

- Cars and other vehicles available in Livingston in renter-occupied apartments
- 107no vehicle
- 2431 vehicle
- 1892 vehicles
- 183 vehicles
- 134 vehicles
- 115+ vehicles

- Rooms in owner-occupied houses in Livingston, New Jersey
- 01 room
- 92 rooms
- 283 rooms
- 734 rooms
- 4005 rooms
- 1,5346 rooms
- 2,1147 rooms
- 2,3268 rooms
- 2,2359+ rooms

- Rooms in renter-occupied apartments in Livingston, New Jersey
- 01 room
- 472 rooms
- 1353 rooms
- 1184 rooms
- 1105 rooms
- 556 rooms
- 527 rooms
- 118 rooms
- 539+ rooms


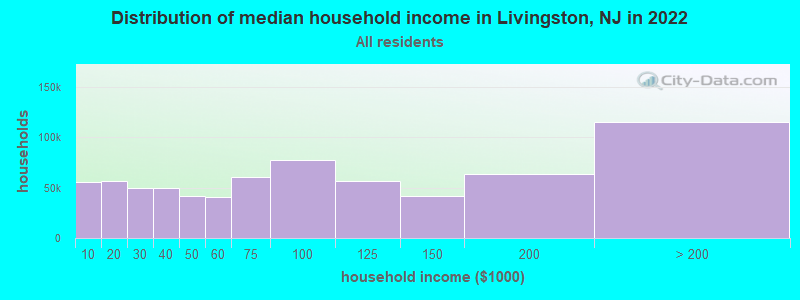
Livingston, NJ household income distribution

- 55,691Less than $10,000
- 56,564$10,000 to $19,999
- 49,895$20,000 to $29,999
- 49,423$30,000 to $39,999
- 41,502$40,000 to $49,999
- 40,470$50,000 to $59,999
- 59,961$60,000 to $74,999
- 77,676$75,000 to $99,999
- 56,107$100,000 to $124,999
- 41,693$125,000 to $149,999
- 63,027$150,000 to $199,999
- 114,952$200,000 or more
Percentage of workers working in this county: 49.8%
Number of people working at home: 2,513 (15.4% of all workers)
Travel time to work (commute)
- Less than 5 minutes: 217
- 5 to 9 minutes: 1,379
- 10 to 14 minutes: 1,792
- 15 to 19 minutes: 1,718
- 20 to 24 minutes: 1,587
- 25 to 29 minutes: 646
- 30 to 34 minutes: 1,171
- 35 to 39 minutes: 350
- 40 to 44 minutes: 456
- 45 to 59 minutes: 957
- 60 to 89 minutes: 1,615
- 90 or more minutes: 541
Means of transportation to work:
- Drove a car alone: 10,382 (78.6%)
- Carpooled: 860 (6.5%)
- Bus or trolley bus: 539 (4.1%)
- Subway or elevated: 222 (1.7%)
- Railroad: 315 (2.4%)
- Walked: 69 (0.5%)
- Other means: 42 (0.3%)
- Worked at home: 781 (5.9%)


- Year of entry for the foreign-born population in Livingston, New Jersey
- 4811995 to March 2000
- 8771990 to 1994
- 7981985 to 1989
- 7291980 to 1984
- 5401975 to 1979
- 5311970 to 1974
- 3641965 to 1969
- 834Before 1965

First ancestries reported:
- Other: 9,308 (31.7%)
- Italian: 4,846 (16.5%)
- Irish: 2,833 (9.7%)
- Russian: 2,693 (9.2%)
- German: 2,022 (6.9%)
- United States: 1,927 (6.6%)
- Polish: 1,799 (6.1%)
- English: 1,132 (3.9%)
- Ukrainian: 363 (1.2%)
- Hungarian: 286 (1.0%)
- Arab: 274 (0.9%)
- Greek: 243 (0.8%)
- Scottish: 220 (0.7%)
- Scotch-Irish: 185 (0.6%)
- French: 150 (0.5%)
- Czech: 142 (0.5%)
- Lithuanian: 116 (0.4%)
- Swedish: 113 (0.4%)
- Danish: 111 (0.4%)
- Norwegian: 101 (0.3%)
- Portuguese: 83 (0.3%)
- Welsh: 81 (0.3%)
- Slovak: 80 (0.3%)
- French Canadian: 79 (0.3%)
- Dutch: 70 (0.2%)
- West Indian: 40 (0.1%)
- Subsaharan African: 29 (0.10%)
- Swiss: 24 (0.08%)
Most common places of birth for foreign-born residents (%):
| Livingston: | 13.3% (685) |
| New Jersey: | 2.7% (40,092) |
| Livingston: | 11.3% (580) |
| New Jersey: | 3.5% (51,970) |
| Livingston: | 8.7% (447) |
| New Jersey: | 4.7% (69,773) |
| Livingston: | 7.4% (381) |
| New Jersey: | 8.1% (119,497) |
| Livingston: | 5.7% (293) |
| New Jersey: | 4.0% (58,395) |
| Livingston: | 5.1% (263) |
| New Jersey: | 1.2% (18,066) |
| Livingston: | 4.5% (232) |
| New Jersey: | 1.0% (14,768) |
| Livingston: | 4.3% (222) |
| New Jersey: | 1.4% (20,243) |
| Livingston: | 3.5% (178) |
| New Jersey: | 0.6% (8,266) |
| Livingston: | 3.4% (174) |
| New Jersey: | 3.8% (55,466) |
| Livingston: | 2.5% (130) |
| New Jersey: | 0.4% (5,220) |
| Livingston: | 2.4% (124) |
| New Jersey: | 0.5% (7,675) |
| Livingston: | 2.2% (111) |
| New Jersey: | 1.2% (17,647) |
| Livingston: | 2.0% (101) |
| New Jersey: | 2.1% (30,355) |
| Livingston: | 1.9% (99) |
| New Jersey: | 0.8% (12,383) |
| Livingston: | 1.7% (89) |
| New Jersey: | 1.4% (20,079) |
Place of birth for U.S.-born residents:
- This state: 14,559
- Other state: 7,537
- Northeast: 6,299
- Midwest: 346
- South: 583
- West: 309
71% of Livingston residents lived in the same house 5 years ago.
Out of people who lived in different houses, 48% lived in this county.
Out of people who lived in different counties, 58% lived in New Jersey.
Education attainment for males 25 years and older:
- No schooling: 34
- Nursery to 4th grade: 0
- 5th and 6th grade: 90
- 7th and 8th grade: 28
- 9th grade: 71
- 10th grade: 52
- 11th grade: 60
- 12th grade, no diploma: 168
- High school graduate (or equivalency): 1,107
- Less than 1 year of college: 397
- Some college more than 1 year, no degree: 985
- Associate degree: 248
- Bachelor's degree: 2,711
- Master's degree: 1,466
- Professional school degree: 1,040
- Doctorate degree: 353

Education attainment for females 25 years and older:
- No schooling: 53
- Nursery to 4th grade: 0
- 5th and 6th grade: 104
- 7th and 8th grade: 98
- 9th grade: 65
- 10th grade: 88
- 11th grade: 65
- 12th grade, no diploma: 154
- High school graduate (or equivalency): 2,121
- Less than 1 year of college: 523
- Some college more than 1 year, no degree: 1,000
- Associate degree: 433
- Bachelor's degree: 3,104
- Master's degree: 1,591
- Professional school degree: 414
- Doctorate degree: 146


Housing units in structures:
- One, detached: 8,924
- One, attached: 95
- Two: 76
- 3 or 4: 54
- 5 to 9: 33
- 10 to 19: 57
- 20 to 49: 51
- 50 or more: 143
- Mobile homes: 24
Housing units lacking complete kitchen facilities: 0.1%

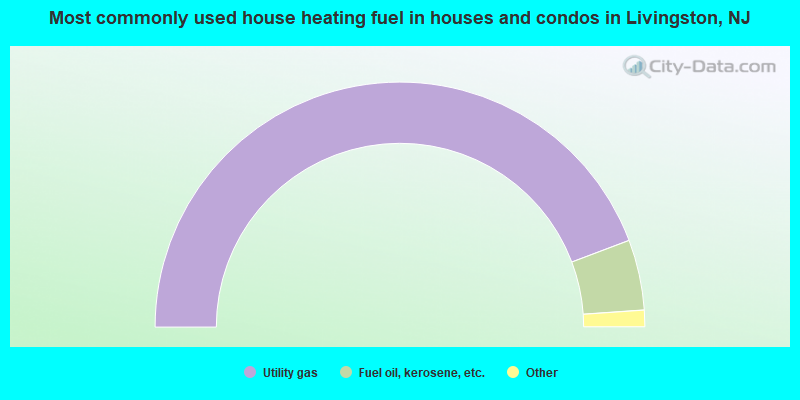
- 88.5%Utility gas
- 9.3%Fuel oil, kerosene, etc.
- 1.2%Electricity
- 0.6%Bottled, tank, or LP gas
- 0.2%Other fuel
- 0.1%Wood
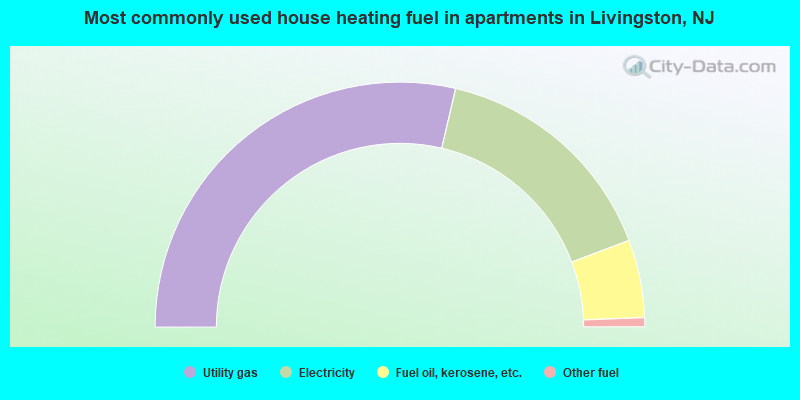
- 57.3%Utility gas
- 31.2%Electricity
- 10.3%Fuel oil, kerosene, etc.
- 1.2%Other fuel
Private vs. public school enrollment:
| Here: | 13.5% |
| New Jersey: | 13.2% |
| Here: | 15.8% |
| New Jersey: | 13.0% |
| Here: | 34.4% |
| New Jersey: | 30.1% |


