Jump to a detailed profile or search site with Google Custom Search

Littleton, CO (Colorado) Houses and Residents

Estimated median house or condo value in 2022: $631,037 (it was $183,800 in 2000)
Littleton:

$631,037
Colorado:

$531,100
Lower value quartile - upper value quartile: $465,738 - $778,084

Mean price in 2022:

Detached houses: $812,766
Here:

$812,766
State:

$676,667

Townhouses or other attached units: $531,176
Here:

$531,176
State:

$526,340

In 2-unit structures: $141,965
Here:

$141,965
State:

$431,509

In 3-to-4-unit structures: $611,797
Here:

$611,797
State:

$385,502

In 5-or-more-unit structures: $374,259
Here:

$374,259
State:

$417,586

Mobile homes: $81,500
Here:

$81,500
State:

$115,510

Total population: 44,669 (Urban population: 40,234, Rural population: 182 (all nonfarm))

Houses: 22,149 (20,987 occupied: 12,706 owner occupied, 8,406 renter occupied)

% of renters here:

40%
State:

34%

Housing density: 1,639 houses/condos per square mile

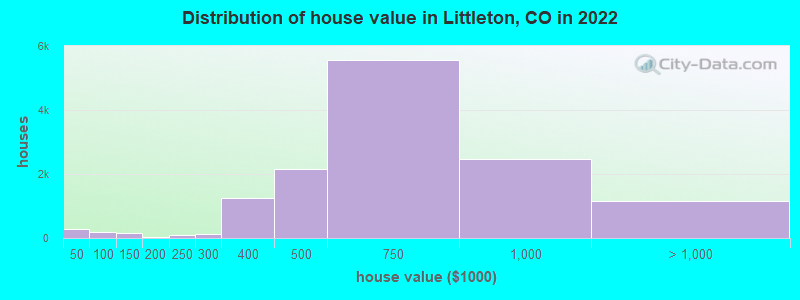
Median price asked for vacant for-sale houses and condos in 2022: $202,364.

Median contract rent in 2022: $1,505 (lower quartile is $1,195, upper quartile is $1,882)


Median rent asked for vacant for-rent units in 2022: $1,949


Median gross rent in Littleton, CO in 2022: $1,603

Housing units in Littleton with a mortgage: 8,597 (1,081 second mortgage, 7 home equity loan, 1,080 both second mortgage and home equity loan)
Houses without a mortgage: 208

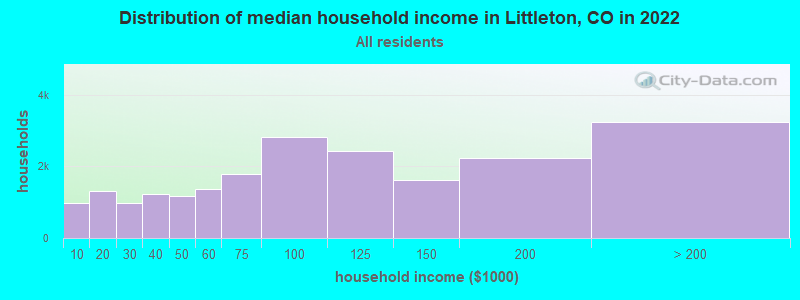
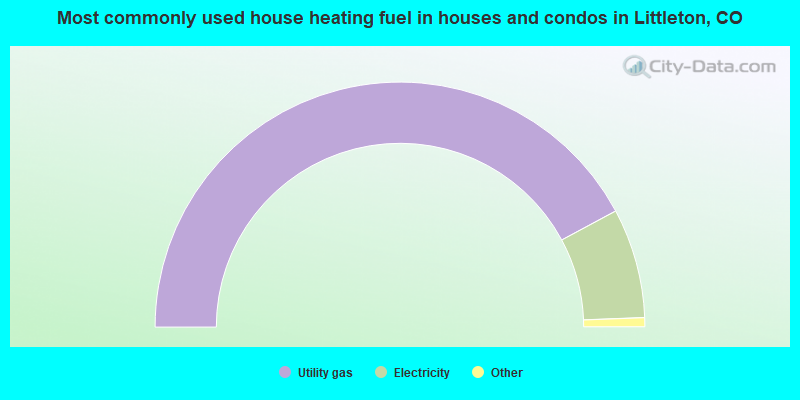
Median household income for houses/condos with a mortgage: $133,588

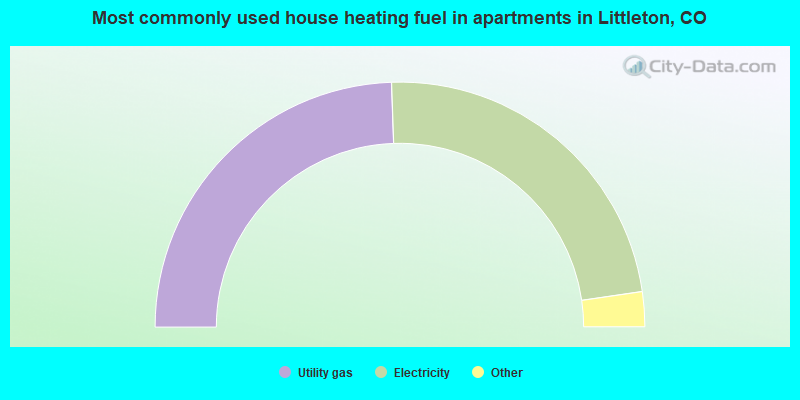
Median household income for apartments without a mortgage: $76,064

Median monthly housing costs: $1,650

Compare current foreclosures in Littleton, CO:

Check out more offers in Littleton, CO.
Powered by Foreclosure.com

Settings
X
Data:
Loading data...
Based on 2000-2022 data
Loading data...

123
Hide US histogram

Latest news about housing in Littleton, CO collected exclusively by city-data.com from local newspapers, TV, and radio stations

Littleton, Colorado Age and Sex of Residents
Median year house/condo built: 1979

Median year apartment built: 1983

Household type by relationship:

Households: 45,625
  • Male householders: 10,607 (3,379 living alone), Female householders: 9,918 (3,868 living alone)
  • 9,117 spouses (8,834 opposite-sex spouses), 1,675 unmarried partners, (1,568 opposite-sex unmarried partners), 10,289 children (9,777 natural, 249 adopted, 262 stepchildren), 582 grandchildren, 564 brothers or sisters, 486 parents, 0 foster children, 461 other relatives, 1,344 non-relatives
  • In group quarters: 577

Size of family households: 6,099 2-persons, 2,120 3-persons, 2,058 4-persons, 504 5-persons, 396 6-persons, 173 7-or-more-persons.

Size of nonfamily households: 7,840 1-person, 1,956 2-persons, 163 3-persons, 16 4-persons.

5,741 married couples with children.
1,473 single-parent households (665 men, 808 women).

90.5% of residents of Littleton speak English at home.
6.6% of residents speak Spanish at home (68% speak English very well, 20% speak English well, 5% speak English not well, 8% don't speak English at all).
2.0% of residents speak other Indo-European language at home (62% speak English very well, 25% speak English well, 13% speak English not well).
0.9% of residents speak Asian or Pacific Island language at home (78% speak English very well, 13% speak English well, 9% speak English not well).
0.3% of residents speak other language at home (38% speak English very well, 24% speak English well, 38% speak English not well).

Foreign born population: 3,119 (6.8%)
(48.3% of them are naturalized citizens)

Median number of rooms in houses and condos:
Here:

7.7
State:

6.8

Median number of rooms in apartments
Here:

3.4
State:

4.0

Owner-occupied Renter-occupied
Bedrooms in owner-occupied houses and condos in Littleton, Colorado
  • Bedrooms in owner-occupied houses and condos in Littleton, Colorado
  • 19no bedroom
  • 3641 bedroom
  • 2,2852 bedrooms
  • 3,9513 bedrooms
  • 3,7274 bedrooms
  • 2,3615+ bedrooms
Bedrooms in renter-occupied apartments in Littleton, Colorado
  • Bedrooms in renter-occupied apartments in Littleton, Colorado
  • 519no bedroom
  • 3,6241 bedroom
  • 3,0742 bedrooms
  • 8103 bedrooms
  • 2934 bedrooms
  • 875+ bedrooms
Owner-occupied Renter-occupied
Cars and other vehicles available in Littleton in owner-occupied houses/condos
  • Cars and other vehicles available in Littleton in owner-occupied houses/condos
  • 315no vehicle
  • 3,1851 vehicle
  • 6,0792 vehicles
  • 1,8983 vehicles
  • 9014 vehicles
  • 3295+ vehicles
Cars and other vehicles available in Littleton in renter-occupied apartments
  • Cars and other vehicles available in Littleton in renter-occupied apartments
  • 976no vehicle
  • 4,6191 vehicle
  • 2,2582 vehicles
  • 4713 vehicles
  • 434 vehicles
  • 395+ vehicles
Owner-occupied Renter-occupied
Rooms in owner-occupied houses in Littleton, Colorado
  • Rooms in owner-occupied houses in Littleton, Colorado
  • 191 room
  • 962 rooms
  • 3373 rooms
  • 1,2224 rooms
  • 1,1515 rooms
  • 1,5846 rooms
  • 1,5377 rooms
  • 2,2288 rooms
  • 4,5329+ rooms
Rooms in renter-occupied apartments in Littleton, Colorado
  • Rooms in renter-occupied apartments in Littleton, Colorado
  • 4631 room
  • 1,2462 rooms
  • 2,4683 rooms
  • 1,9544 rooms
  • 8945 rooms
  • 7336 rooms
  • 2657 rooms
  • 1638 rooms
  • 2229+ rooms
Year house built
Median 2022 house/condo value by year built
Median house/condo value by year householder moved into unit
Breakdown of mean house values by ages of householders
Owners and renters by unit type in Littleton, CO
  • Littleton, CO household income distribution

  • Distribution of median household income in Littleton, CO in 2022
  • 975Less than $10,000
  • 1,321$10,000 to $19,999
  • 964$20,000 to $29,999
  • 1,214$30,000 to $39,999
  • 1,180$40,000 to $49,999
  • 1,364$50,000 to $59,999
  • 1,798$60,000 to $74,999
  • 2,812$75,000 to $99,999
  • 2,428$100,000 to $124,999
  • 1,609$125,000 to $149,999
  • 2,235$150,000 to $199,999
  • 3,235$200,000 or more
  • Home value of owner - occupied houses in 2022 in Littleton, CO

  • Distribution of house value in Littleton, CO in 2022
  • 93Less than $10,000
  • 23$10,000 to $14,999
  • 72$30,000 to $34,999
  • 45$35,000 to $39,999
  • 36$40,000 to $49,999
  • 18$50,000 to $59,999
  • 77$60,000 to $69,999
  • 15$70,000 to $79,999
  • 36$80,000 to $89,999
  • 90$100,000 to $124,999
  • 55$125,000 to $149,999
  • 19$150,000 to $174,999
  • 13$175,000 to $199,999
  • 95$200,000 to $249,999
  • 114$250,000 to $299,999
  • 1,262$300,000 to $399,999
  • 2,141$400,000 to $499,999
  • 5,572$500,000 to $749,999
  • 2,471$750,000 to $999,999
  • 787$1,000,000 to $1,499,999
  • 108$1,500,000 to $1,999,999
  • 246$2,000,000 or more
  • Rent paid by renters in 2022 in Littleton, CO

  • Distribution of rent paid by renters in Littleton, CO in 2022
  • 18Less than $100
  • 27$100 to $149
  • 4$150 to $199
  • 22$200 to $249
  • 97$250 to $299
  • 11$300 to $349
  • 35$350 to $399
  • 96$400 to $449
  • 19$450 to $499
  • 44$500 to $549
  • 28$550 to $599
  • 78$600 to $649
  • 113$650 to $699
  • 65$700 to $749
  • 85$750 to $799
  • 97$800 to $899
  • 266$900 to $999
  • 1,032$1,000 to $1,249
  • 1,838$1,250 to $1,499
  • 2,614$1,500 to $1,999
  • 940$2,000 to $2,499
  • 260$2,500 to $2,999
  • 236$3,000 to $3,499
  • 99$3,500 or more
  • 191No cash rent
Time Leaving Home To Go To Work in 2022

Percentage of workers working in this county: 59.8%
Number of people working at home: 5,844 (22.4% of all workers)

Travel time (in minutes) to work in 2022

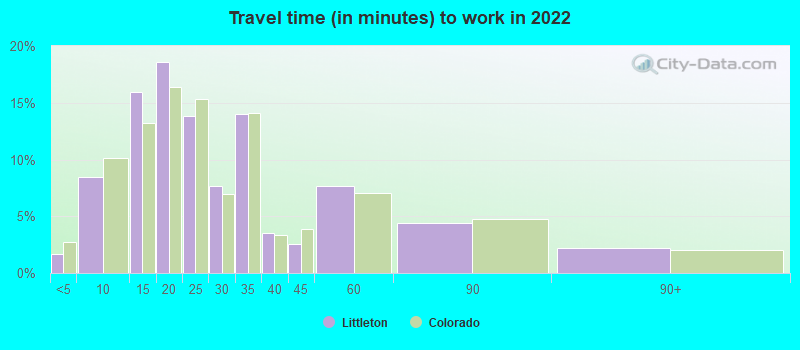
Travel time to work (commute)

  • Less than 5 minutes: 321
  • 5 to 9 minutes: 1,813
  • 10 to 14 minutes: 2,463
  • 15 to 19 minutes: 2,779
  • 20 to 24 minutes: 3,046
  • 25 to 29 minutes: 2,208
  • 30 to 34 minutes: 3,052
  • 35 to 39 minutes: 948
  • 40 to 44 minutes: 1,253
  • 45 to 59 minutes: 1,312
  • 60 to 89 minutes: 798
  • 90 or more minutes: 411
Means of transportation to work in 2022 - Littleton

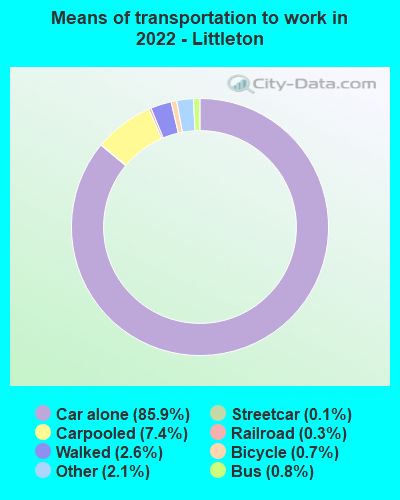
Means of transportation to work:

  • Drove a car alone: 22,782 (69.7%)
  • Carpooled: 1,940 (5.9%)
  • Bus: 181 (0.6%)
  • Subway or elevated rail: 17 (0.1%)
  • Light rail, streetcar or trolley: 63 (0.2%)
  • Ferryboat: 27 (0.1%)
  • Taxi: 748 (2.3%)
  • Bicycle: 205 (0.6%)
  • Walked: 717 (2.2%)
  • Worked at home: 5,844 (17.9%)
Class of Workers in 2022
  • Unemployment by race in 2022
  • Unemployment rate for White non-Hispanic residents
  • 2.9%Males
  • 3.0%Females
  • Unemployment rate for Black residents
  • 1.9%Males
  • 2.1%Females
  • Unemployment rate for American Indian and Alaska Native residents
  • 8.6%Females
  • Unemployment rate for Asian residents
  • 8.2%Males
  • 4.5%Females
  • Unemployment rate for other race residents
  • 13.6%Males
  • Unemployment rate for two or more race residents
  • 0.8%Males
  • 5.8%Females
  • Unemployment rate for Hispanic or Latino residents
  • 4.9%Males
  • 3.3%Females
Year of entry for the foreign-born population in Littleton, Colorado
  • Year of entry for the foreign-born population in Littleton, Colorado
  • 1,0292010 or later
  • 7242000 to 2009
  • 6611990 to 1999
  • 5331980 to 1989
  • 3911970 to 1979
  • 403Before 1970
Ancestries in Littleton, CO

First ancestries reported:

  • German: 2,942 (14.0%)
  • European: 2,084 (9.9%)
  • Irish: 1,903 (9.1%)
  • English: 1,773 (8.4%)
  • American: 1,466 (7.0%)
  • Italian: 1,008 (4.8%)
  • Polish: 431 (2.1%)
  • Scottish: 342 (1.6%)
  • Norwegian: 305 (1.5%)
  • Czech: 277 (1.3%)
  • Scotch-Irish: 265 (1.3%)
  • Swedish: 240 (1.1%)
  • Scandinavian: 201 (1.0%)
  • French: 191 (0.9%)
  • Dutch: 178 (0.8%)
  • Lithuanian: 153 (0.7%)
  • British: 117 (0.6%)
  • Russian: 116 (0.6%)
  • Eastern European: 109 (0.5%)
  • Welsh: 78 (0.4%)
  • French Canadian: 64 (0.3%)
  • Hungarian: 62 (0.3%)
  • Albanian: 56 (0.3%)
  • Austrian: 55 (0.3%)
  • Ghanaian: 40 (0.2%)
  • Danish: 39 (0.2%)
  • Northern European: 38 (0.2%)
  • Arab: 37 (0.2%)
  • Finnish: 35 (0.2%)
  • Greek: 33 (0.2%)
  • Slovak: 33 (0.2%)
  • Ukrainian: 22 (0.1%)
  • Croatian: 21 (0.1%)
  • Ethiopian: 21 (0.1%)
  • Jamaican: 20 (0.10%)
  • Lebanese: 19 (0.09%)
  • Belgian: 19 (0.09%)
  • Slovene: 19 (0.09%)
  • Canadian: 16 (0.08%)
  • Cajun: 15 (0.07%)
  • Australian: 13 (0.06%)
  • Armenian: 13 (0.06%)
  • Slavic: 13 (0.06%)
  • Yugoslavian: 13 (0.06%)
  • Palestinian: 13 (0.06%)
  • Czechoslovakian: 12 (0.06%)
  • Romanian: 12 (0.06%)
  • German Russian: 8 (0.04%)
  • Moroccan: 8 (0.04%)
  • Liberian: 8 (0.04%)
  • Egyptian: 7 (0.03%)
  • Iranian: 7 (0.03%)
  • Pennsylvania German: 6 (0.03%)
  • Assyrian: 6 (0.03%)
  • Turkish: 6 (0.03%)
  • Portuguese: 5 (0.02%)
  • Syrian: 4 (0.02%)
  • Somali: 3 (0.01%)

Most common places of birth for foreign-born residents (%):

Mexico
Littleton:

26.4% (808)
Colorado:

38.3% (209,491)

India
Littleton:

6.4% (197)
Colorado:

4.0% (21,689)

Philippines
Littleton:

5.2% (160)
Colorado:

2.3% (12,342)

Bangladesh
Littleton:

4.8% (148)
Colorado:

0.2% (1,091)

Venezuela
Littleton:

4.6% (142)
Colorado:

0.9% (4,829)

France
Littleton:

3.6% (111)
Colorado:

0.5% (2,620)

China, excluding Hong Kong and Taiwan
Littleton:

3.3% (102)
Colorado:

3.3% (17,998)

Canada
Littleton:

3.3% (101)
Colorado:

2.7% (15,026)

Peru
Littleton:

2.9% (89)
Colorado:

0.9% (4,810)

Nicaragua
Littleton:

2.7% (82)
Colorado:

0.2% (1,193)

Korea
Littleton:

2.7% (82)
Colorado:

2.9% (15,981)

South Africa
Littleton:

2.3% (69)
Colorado:

0.5% (2,472)

Vietnam
Littleton:

2.3% (69)
Colorado:

3.0% (16,616)

Germany
Littleton:

2.2% (68)
Colorado:

2.5% (13,706)

United Kingdom, excluding England and Scotland
Littleton:

2.1% (64)
Colorado:

1.1% (5,799)

El Salvador
Littleton:

2.0% (61)
Colorado:

2.2% (12,150)

Ukraine
Littleton:

1.8% (56)
Colorado:

0.8% (4,267)

Russia
Littleton:

1.8% (56)
Colorado:

1.4% (7,860)

Guatemala
Littleton:

1.7% (53)
Colorado:

1.4% (7,898)

Poland
Littleton:

1.6% (50)
Colorado:

0.9% (4,772)

Place of birth for U.S.-born residents:

  • This state: 18,268
  • Other state: 23,601
  • Northeast: 3,682
  • Midwest: 8,411
  • South: 5,565
  • West: 5,902

83.4% of Littleton residents lived in the same house 1 years ago.
   Out of people who lived in different houses, 22.4% lived in this county.
   Out of people who lived in different counties, 59.3% lived in Colorado.


Littleton:

83.4%
State average:

83.6%

Education attainment for males 25 years and older:

  • No schooling: 171
  • Nursery to 4th grade: 0
  • 5th and 6th grade: 35
  • 7th and 8th grade: 35
  • 9th grade: 55
  • 10th grade: 6
  • 11th grade: 72
  • 12th grade, no diploma: 198
  • High school graduate (or equivalency): 2,720
  • Less than 1 year of college: 794
  • Some college more than 1 year, no degree: 2,067
  • Associate degree: 1,043
  • Bachelor's degree: 6,325
  • Master's degree: 2,726
  • Professional school degree: 549
  • Doctorate degree: 482
Educational Attainment for Males

Education attainment for females 25 years and older:

  • No schooling: 14
  • Nursery to 4th grade: 2
  • 5th and 6th grade: 30
  • 7th and 8th grade: 178
  • 9th grade: 31
  • 10th grade: 36
  • 11th grade: 108
  • 12th grade, no diploma: 159
  • High school graduate (or equivalency): 2,747
  • Less than 1 year of college: 909
  • Some college more than 1 year, no degree: 2,375
  • Associate degree: 1,027
  • Bachelor's degree: 6,314
  • Master's degree: 2,912
  • Professional school degree: 451
  • Doctorate degree: 366
Educational Attainment for Females
Littleton marital status for males
Littleton marital status for females

Housing units in structures:

  • One, detached: 10,808
  • One, attached: 2,051
  • Two: 282
  • 3 or 4: 481
  • 5 to 9: 1,293
  • 10 to 19: 2,313
  • 20 to 49: 2,130
  • 50 or more: 2,430
  • Mobile homes: 330
  • Boats, RVs, vans, etc.: 27

Median worth of mobile homes: $176,213

Housing units lacking complete plumbing facilities in 2022: 0.7%

Housing units lacking complete kitchen facilities in 2022: 1.3%

House/condo owner moved in on average 13 years ago

Renter moved in on average 3 years ago

Year householders moved into residence in Littleton
Houses and condos Apartments
Most commonly used house heating fuel in houses and condos in Littleton, CO
  • 84.3%Utility gas
  • 14.5%Electricity
  • 0.4%Solar energy
  • 0.3%No fuel used
  • 0.2%Bottled, tank, or LP gas
  • 0.2%Wood
  • 0.2%Other fuel
Most commonly used house heating fuel in apartments in Littleton, CO
  • 48.9%Utility gas
  • 46.5%Electricity
  • 1.9%Other fuel
  • 1.3%No fuel used
  • 0.9%Bottled, tank, or LP gas
  • 0.4%Coal or coke

Private vs. public school enrollment:

Students in private schools in grades 1 to 8 (elementary and middle school): 756
Here:

22.1%
Colorado:

11.4%

Students in private schools in grades 9 to 12 (high school): 213
Here:

13.4%
Colorado:

8.5%

Students in private undergraduate colleges: 237
Here:

19.5%
Colorado:

14.0%
School Enrollment by Level of School for Male Students
School Enrollment by Level of School for Female Students
Age and Sex of Sensory-Disabled Noninstitutionalized Residents
Age and Sex of Physically-Disabled Noninstitutionalized Residents
Age and Sex of Mentally-Disabled Noninstitutionalized Residents
Age and Sex of Self-Care Disabled Noninstitutionalized Residents
Age and Sex of Go-Outside-Home Disabled Noninstitutionalized Residents
Age and Sex of Noninstitutionalized Residents with Employment Disability