Lincolnwood, IL (Illinois) Houses and Residents
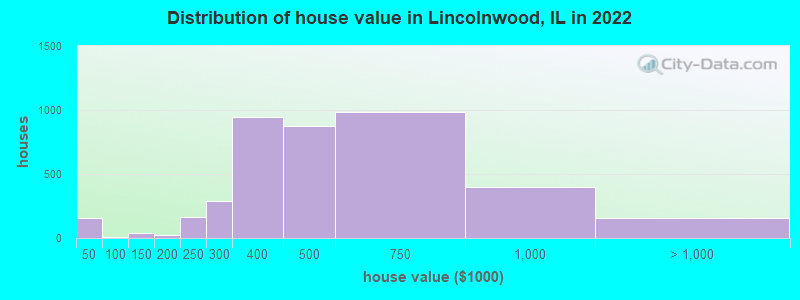
Estimated median house or condo value in 2022: $462,516 (it was $288,200 in 2000 )
Lincolnwood:
$462,516Illinois:
$251,600
Lower value quartile - upper value quartile: $353,210 - $641,480Mean price in 2022: Detached houses: $647,347 Here:
$647,347State:
$310,164
Townhouses or other attached units: $429,860 Here:
$429,860State:
$286,230
In 2-unit structures: $326,824 Here:
$326,824State:
$299,638
In 5-or-more-unit structures: $324,051 Here:
$324,051State:
$318,887
Total population: 12,687 (Urban population: 12,359, Rural population: 0)
Houses: 5,113 (4,688 occupied: 3,915 owner occupied, 853 renter occupied )
% of renters here:
18%State:
33%
Housing density: 1,903 houses/condos per square mile
Median price asked for vacant for-sale houses and condos in 2022: $359,329.
Median contract rent in 2022: over $2,000
Median rent asked for vacant for-rent units in 2022: $4,010
Median gross rent in Lincolnwood, IL in 2022: over $2,000
Housing units in Lincolnwood with a mortgage: 1,891 (185 second mortgage, 0 home equity loan, 145 both second mortgage and home equity loan )Houses without a mortgage: 85
Median household income for houses/condos with a mortgage: $107,618
Median household income for apartments without a mortgage: $99,960
Median monthly housing costs: $2,072
Data:
Median house or condo value ($)
Median house or condo value ($ change since 2000)
Median house or condo value ($) - White
Median house or condo value ($) - Black or African American
Median house or condo value ($) - Asian
Median house or condo value ($) - Hispanic or Latino
Median house or condo value ($) - American Indian and Alaska Native
Median house or condo value ($) - Multirace
Median house or condo value ($) - Other Race
Median price asked for mobile homes ($)
Household density (households per square mile)
Mean house or condo value by units in structure - 1, detached ($)
Mean house or condo value by units in structure - 1, attached ($)
Mean house or condo value by units in structure - 2 ($)
Mean house or condo value by units in structure by units in structure - 3 or 4 ($)
Mean house or condo value by units in structure - 5 or more ($)
Mean house or condo value by units in structure - Boat, RV, van, etc. ($)
Mean house or condo value by units in structure - Mobile home ($)
Median contract rent ($)
Median contract rent - Lower quartile ($)
Median contract rent - Upper quartile ($)
Median gross rent ($)
Urban houses (%)
Rural houses (%)
Houses occupied (%)
Houses occupied (% change since 2000)
Houses owner occupied (%)
Houses owner occupied (% change since 2000)
Houses renter occupied (%)
Houses renter occupied (% change since 2000)
Vacant housing units - For rent (%)
Vacant housing units - For rent (% change since 2000)
Vacant housing units - For sale only (%)
Vacant housing units - For sale only (% change since 2000)
Vacant housing units - Rented or sold, not occupied (%)
Vacant housing units - Rented or sold, not occupied (% change since 2000)
Vacant housing units - For seasonal, recreational, or occasional use (%)
Vacant housing units - For seasonal, recreational, or occasional use (% change since 2000)
Vacant housing units - For migrant workers (%)
Vacant housing units - For migrant workers (% change since 2000)
Vacant housing units - Other vacant (%)
Vacant housing units - Other vacant (% change since 2000)
Median monthly housing costs ($)
Median household income for houses/condos with a mortgage ($)
Median household income for houses/condos without a mortgage ($)
Median household income ($)
Median household income ($) - White
Median household income ($) - Black or African American
Median household income ($) - Asian
Median household income ($) - Hispanic or Latino
Median household income ($) - American Indian and Alaska Native
Median household income ($) - Multirace
Median household income ($) - Other Race
Mortgage status - with mortgage (%)
Mortgage status - with second mortgage (%)
Mortgage status - with home equity loan (%)
Mortgage status - with both second mortgage and home equity loan (%)
Mortgage status - without a mortgage (%)
Median year house/condo built
Median year apartment built
Household type by relationship - Male householder living alone (%)
Household type by relationship - Male householder not living alone (%)
Household type by relationship - Female householder living alone (%)
Household type by relationship - Female householder not living alone (%)
Household type by relationship - Opposite-Sex spouse (%)
Household type by relationship - Same-Sex spouse (%)
Household type by relationship - Opposite-Sex unmarried partner (%)
Household type by relationship - Same-Sex unmarried partner (%)
Household type by relationship - In group quarters (%)
Size of family households - 2-person household (%)
Size of family households - 3-person household (%)
Size of family households - 4-person household (%)
Size of family households - 5-person household (%)
Size of family households - 6-person household (%)
Size of family households - 7-or-more-person household (%)
Size of nonfamily households - 1-person household (%)
Size of nonfamily households - 2-person household (%)
Size of nonfamily households - 3-person household (%)
Size of nonfamily households - 4-person household (%)
Size of nonfamily households - 5-person household (%)
Size of nonfamily households - 6-person household (%)
Size of nonfamily households - 7-or-moreperson household (%)
Year house built - Built 2010 or later (%)
Year house built - Built 2000 to 2009 (%)
Year house built - Built 1990 to 1999 (%)
Year house built - Built 1980 to 1989 (%)
Year house built - Built 1970 to 1979 (%)
Year house built - Built 1960 to 1969 (%)
Year house built - Built 1950 to 1959 (%)
Year house built - Built 1940 to 1949 (%)
Year house built - Built 1939 or earlier (%)
Median number of rooms in houses and condos
Median number of rooms in apartments
Median number of bedrooms in owner occupied houses
Mean number of bedrooms in owner occupied houses
Median number of bedrooms in renter occupied houses
Mean number of bedrooms in renter occupied houses
Median number of vehichles in owner occupied houses
Mean number of vehichles in owner occupied houses
Median number of vehichles in renter occupied houses
Mean number of vehichles in renter occupied houses
Rooms in owner-occupied houses - 1 room (%)
Rooms in owner-occupied houses - 2 rooms (%)
Rooms in owner-occupied houses - 3 rooms (%)
Rooms in owner-occupied houses - 4 rooms (%)
Rooms in owner-occupied houses - 5 rooms (%)
Rooms in owner-occupied houses - 6 rooms (%)
Rooms in owner-occupied houses - 7 rooms (%)
Rooms in owner-occupied houses - 8 rooms (%)
Rooms in owner-occupied houses - 9+ rooms (%)
Rooms in renter-occupied houses - 1 room (%)
Rooms in renter-occupied houses - 2 rooms (%)
Rooms in renter-occupied houses - 3 rooms (%)
Rooms in renter-occupied houses - 4 rooms (%)
Rooms in renter-occupied houses - 5 rooms (%)
Rooms in renter-occupied houses - 6 rooms (%)
Rooms in renter-occupied houses - 7 rooms (%)
Rooms in renter-occupied houses - 8 rooms (%)
Rooms in renter-occupied houses - 9+ rooms (%)
Bedrooms in owner-occupied houses - no bedrooms (%)
Bedrooms in owner-occupied houses - 1 bedroom (%)
Bedrooms in owner-occupied houses - 2 bedrooms (%)
Bedrooms in owner-occupied houses - 3 bedrooms (%)
Bedrooms in owner-occupied houses - 4 bedrooms (%)
Bedrooms in owner-occupied houses - 5+ bedrooms (%)
Bedrooms in renter-occupied houses - no bedrooms (%)
Bedrooms in renter-occupied houses - 1 bedroom (%)
Bedrooms in renter-occupied houses - 2 bedrooms (%)
Bedrooms in renter-occupied houses - 3 bedrooms (%)
Bedrooms in renter-occupied houses - 4 bedrooms (%)
Bedrooms in renter-occupied houses - 5+ bedrooms (%)
Vehicles available in owner-occupied houses - no vehicle available (%)
Vehicles available in owner-occupied houses - 1 vehicle available(%)
Vehicles available in owner-occupied houses - 2 Vehicles available (%)
Vehicles available in owner-occupied houses - 3 Vehicles available (%)
Vehicles available in owner-occupied houses - 4 Vehicles available (%)
Vehicles available in owner-occupied houses - 5+ Vehicles available (%)
Vehicles available in renter-occupied houses - no vehicle available (%)
Vehicles available in renter-occupied houses - 1 vehicle available (%)
Vehicles available in renter-occupied houses - 2 Vehicles available (%)
Vehicles available in renter-occupied houses - 3 Vehicles available (%)
Vehicles available in renter-occupied houses - 4 Vehicles available (%)
Vehicles available in renter-occupied houses - 5+ Vehicles available (%)
Housing units in structures - 1, detached (%)
Housing units in structures - 1, attached (%)
Housing units in structures - 2 (%)
Housing units in structures - 3 or 4 (%)
Housing units in structures - 5 to 9 (%)
Housing units in structures - 10 to 19 (%)
Housing units in structures - 20 to 49 (%)
Housing units in structures - 50 or more (%)
Housing units in structures - Mobile home (%)
Housing units in structures - Boat, RV, van, etc. (%)
Housing units in structures - Owners - 1, detached (%)
Housing units in structures - Owners - 1, attached (%)
Housing units in structures - Owners - 2 (%)
Housing units in structures - Owners - 3 or 4 (%)
Housing units in structures - Owners - 5 to 9 (%)
Housing units in structures - Owners - 10 to 19 (%)
Housing units in structures - Owners - 20 to 49 (%)
Housing units in structures - Owners - 50 or more (%)
Housing units in structures - Owners - Mobile home (%)
Housing units in structures - Owners - Boat, RV, van, etc. (%)
Housing units in structures - Renters - 1, detached (%)
Housing units in structures - Renters - 1, attached (%)
Housing units in structures - Renters - 2 (%)
Housing units in structures - Renters - 3 or 4 (%)
Housing units in structures - Renters - 5 to 9 (%)
Housing units in structures - Renters - 10 to 19 (%)
Housing units in structures - Renters - 20 to 49 (%)
Housing units in structures - Renters - 50 or more (%)
Housing units in structures - Renters - Mobile home (%)
Housing units in structures - Renters - Boat, RV, van, etc. (%)
House/condo owner moved in on average (years ago)
Renter moved in on average (years ago)
Year householder moved into unit - Moved in 1999 to March 2000 (%)
Year householder moved into unit - Moved in 1999 to March 2000 (%) - White
Year householder moved into unit - Moved in 1999 to March 2000 (%) - Black or African American
Year householder moved into unit - Moved in 1999 to March 2000 (%) - Asian
Year householder moved into unit - Moved in 1999 to March 2000 (%) - Hispanic or Latino
Year householder moved into unit - Moved in 1999 to March 2000 (%) - American Indian and Alaska Native
Year householder moved into unit - Moved in 1999 to March 2000 (%) - Multirace
Year householder moved into unit - Moved in 1999 to March 2000 (%) - Other Race
Year householder moved into unit - Moved in 1995 to 1998 (%)
Year householder moved into unit - Moved in 1995 to 1998 (%) - White
Year householder moved into unit - Moved in 1995 to 1998 (%) - Black or African American
Year householder moved into unit - Moved in 1995 to 1998 (%) - Asian
Year householder moved into unit - Moved in 1995 to 1998 (%) - Hispanic or Latino
Year householder moved into unit - Moved in 1995 to 1998 (%) - American Indian and Alaska Native
Year householder moved into unit - Moved in 1995 to 1998 (%) - Multirace
Year householder moved into unit - Moved in 1995 to 1998 (%) - Other Race
Year householder moved into unit - Moved in 1990 to 1994 (%)
Year householder moved into unit - Moved in 1990 to 1994 (%) - White
Year householder moved into unit - Moved in 1990 to 1994 (%) - Black or African American
Year householder moved into unit - Moved in 1990 to 1994 (%) - Asian
Year householder moved into unit - Moved in 1990 to 1994 (%) - Hispanic or Latino
Year householder moved into unit - Moved in 1990 to 1994 (%) - American Indian and Alaska Native
Year householder moved into unit - Moved in 1990 to 1994 (%) - Multirace
Year householder moved into unit - Moved in 1990 to 1994 (%) - Other Race
Year householder moved into unit - Moved in 1980 to 1989 (%)
Year householder moved into unit - Moved in 1980 to 1989 (%) - White
Year householder moved into unit - Moved in 1980 to 1989 (%) - Black or African American
Year householder moved into unit - Moved in 1980 to 1989 (%) - Asian
Year householder moved into unit - Moved in 1980 to 1989 (%) - Hispanic or Latino
Year householder moved into unit - Moved in 1980 to 1989 (%) - American Indian and Alaska Native
Year householder moved into unit - Moved in 1980 to 1989 (%) - Multirace
Year householder moved into unit - Moved in 1980 to 1989 (%) - Other Race
Year householder moved into unit - Moved in 1970 to 1979 (%)
Year householder moved into unit - Moved in 1970 to 1979 (%) - White
Year householder moved into unit - Moved in 1970 to 1979 (%) - Black or African American
Year householder moved into unit - Moved in 1970 to 1979 (%) - Asian
Year householder moved into unit - Moved in 1970 to 1979 (%) - Hispanic or Latino
Year householder moved into unit - Moved in 1970 to 1979 (%) - American Indian and Alaska Native
Year householder moved into unit - Moved in 1970 to 1979 (%) - Multirace
Year householder moved into unit - Moved in 1970 to 1979 (%) - Other Race
Year householder moved into unit - Moved in 1969 or earlier (%)
Year householder moved into unit - Moved in 1969 or earlier (%) - White
Year householder moved into unit - Moved in 1969 or earlier (%) - Black or African American
Year householder moved into unit - Moved in 1969 or earlier (%) - Asian
Year householder moved into unit - Moved in 1969 or earlier (%) - Hispanic or Latino
Year householder moved into unit - Moved in 1969 or earlier (%) - American Indian and Alaska Native
Year householder moved into unit - Moved in 1969 or earlier (%) - Multirace
Year householder moved into unit - Moved in 1969 or earlier (%) - Other Race
Housing units lacking complete plumbing facilities (%)
Housing units lacking complete kitchen facilities (%)
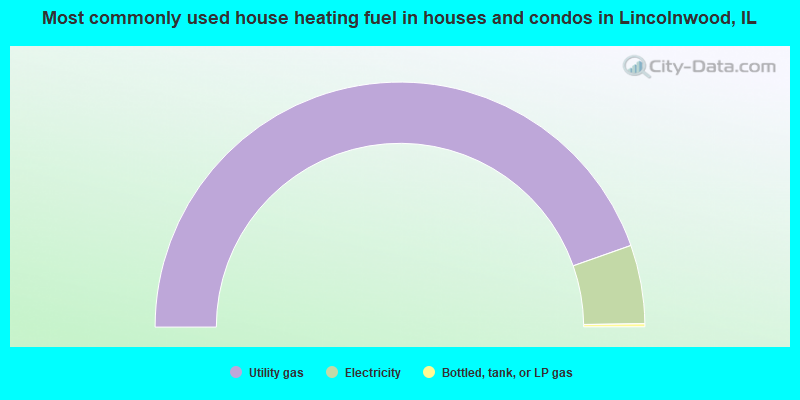
House heating fuel used in houses and condos - Utility gas (%)
House heating fuel used in houses and condos - Bottled, tank, or LP gas (%)
House heating fuel used in houses and condos - Electricity (%)
House heating fuel used in houses and condos - Fuel oil, kerosene, etc. (%)
House heating fuel used in houses and condos - Coal or coke (%)
House heating fuel used in houses and condos - Wood (%)
House heating fuel used in houses and condos - Solar energy (%)
House heating fuel used in houses and condos - Other fuel (%)
House heating fuel used in houses and condos - No fuel used (%)
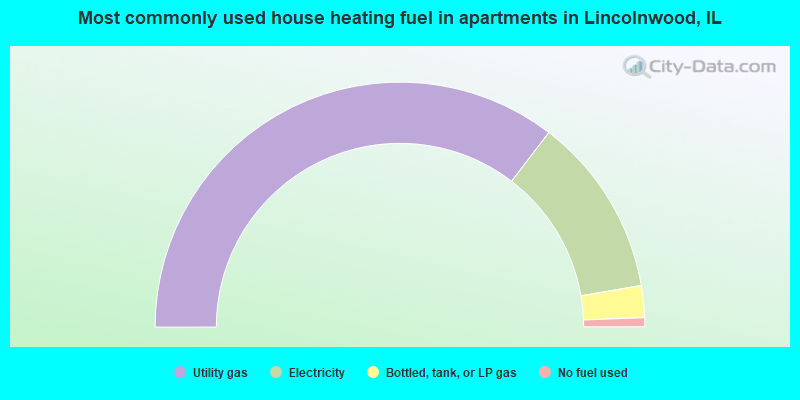
House heating fuel used in apartments - Utility gas (%)
House heating fuel used in apartments - Bottled, tank, or LP gas (%)
House heating fuel used in apartments - Electricity (%)
House heating fuel used in apartments - Fuel oil, kerosene, etc. (%)
House heating fuel used in apartments - Coal or coke (%)
House heating fuel used in apartments - Wood (%)
House heating fuel used in apartments - Solar energy (%)
House heating fuel used in apartments - Other fuel (%)
House heating fuel used in apartments - No fuel used (%)
Latest news about housing in Lincolnwood, IL collected exclusively by city-data.com from local newspapers, TV, and radio stations
Median year house/condo built: 1958Median year apartment built: 1972Household type by relationship:
Households: 12,973
Male householders: 2,736 (407 living alone ), Female householders: 1,828 (583 living alone )2,863 spouses (2,863 opposite-sex spouses ), 91 unmarried partners , (91 opposite-sex unmarried partners ), 4,148 children (4,124 natural , 24 adopted , 0 stepchildren ), 150 grandchildren , 97 brothers or sisters , 521 parents , 0 foster children , 386 other relatives , 48 non-relatives In group quarters: 98
Size of family households: 1,419 2-persons , 792 3-persons , 730 4-persons , 390 5-persons , 84 6-persons , 132 7-or-more-persons .
Size of nonfamily households: 1,065 1-person , 101 2-persons .
2,239 married couples with children. single-parent households (47 men , 398 women ).
50.2% of residents of Lincolnwood speak English at home. of residents speak Spanish at home (68% speak English very well , 27% speak English well , 6% speak English not well ).of residents speak other Indo-European language at home (76% speak English very well , 16% speak English well , 7% speak English not well , 1% don't speak English at all ).of residents speak Asian or Pacific Island language at home (60% speak English very well , 27% speak English well , 12% speak English not well ).of residents speak other language at home (76% speak English very well , 11% speak English well , 12% speak English not well , 1% don't speak English at all ).
Foreign born population: 4,509 (34.8%)of them are naturalized citizens )
Median number of rooms in houses and condos:
Median number of rooms in apartments
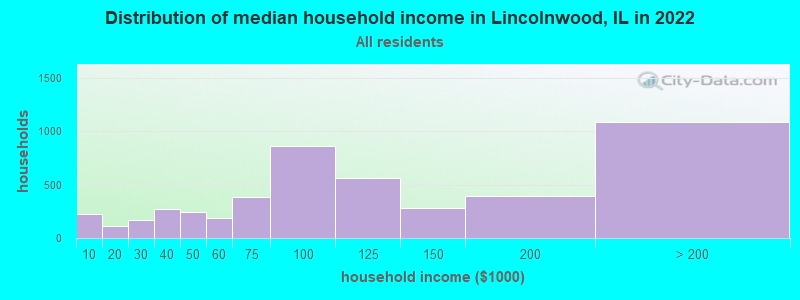
Lincolnwood, IL household income distribution 221 Less than $10,000113 $10,000 to $19,999170 $20,000 to $29,999274 $30,000 to $39,999245 $40,000 to $49,999185 $50,000 to $59,999386 $60,000 to $74,999857 $75,000 to $99,999559 $100,000 to $124,999278 $125,000 to $149,999390 $150,000 to $199,9991,085 $200,000 or more
Home value of owner - occupied houses in 2022 in Lincolnwood, IL 89 Less than $10,00015 $20,000 to $24,99944 $25,000 to $29,9996 $40,000 to $49,99919 $100,000 to $124,99920 $125,000 to $149,99920 $175,000 to $199,999163 $200,000 to $249,999285 $250,000 to $299,999944 $300,000 to $399,999872 $400,000 to $499,999988 $500,000 to $749,999398 $750,000 to $999,99981 $1,000,000 to $1,499,99965 $1,500,000 to $1,999,9999 $2,000,000 or moreRent paid by renters in 2022 in Lincolnwood, IL 10 $100 to $1498 $500 to $54915 $650 to $6999 $900 to $999119 $1,000 to $1,24948 $1,500 to $1,999112 $2,000 to $2,4997 $2,500 to $2,99976 $3,000 to $3,499427 $3,500 or more91 No cash rent
Percentage of workers working in this county: 94.3%Number of people working at home: 1,270 (24.6% of all workers )
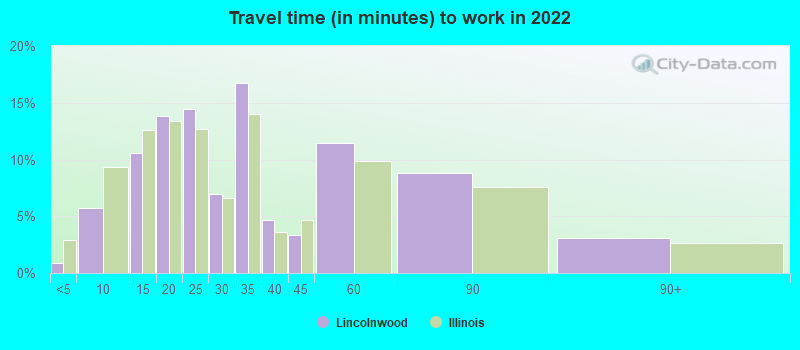
Travel time to work (commute)
Less than 5 minutes: 905 to 9 minutes: 64110 to 14 minutes: 53915 to 19 minutes: 51620 to 24 minutes: 44625 to 29 minutes: 9830 to 34 minutes: 58935 to 39 minutes: 16240 to 44 minutes: 16545 to 59 minutes: 48160 to 89 minutes: 28290 or more minutes: 23
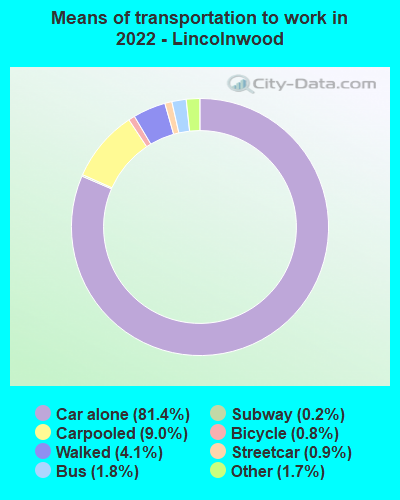
Means of transportation to work:
Drove a car alone: 5,248 (69.1%)Carpooled: 624 (8.2%)Bus : 106 (1.4%)Subway or elevated rail : 43 (0.6%)Long-distance train or commuter rail : 10 (0.1%)Taxi: 112 (1.5%)Bicycle: 57 (0.8%)Walked: 271 (3.6%)Worked at home: 1,270 (16.7%)
Unemployment by race in 2022
Unemployment rate for White non-Hispanic residents 7.1% Males5.6% FemalesUnemployment rate for Black residents 29.1% MalesUnemployment rate for Asian residents 7.2% Males0.5% FemalesUnemployment rate for two or more race residents 10.0% Males7.1% FemalesUnemployment rate for Hispanic or Latino residents 6.8% Males4.3% Females
Year of entry for the foreign-born population in Lincolnwood, Illinois
718 2010 or later 797 2000 to 2009 810 1990 to 1999 960 1980 to 1989 1,227 1970 to 1979 1,218 Before 1970
First ancestries reported:
Assyrian: 688 (8.0%)
German: 668 (7.7%)
Greek: 546 (6.3%)
Romanian: 511 (5.9%)
Russian: 306 (3.5%)
Yugoslavian: 263 (3.1%)
American: 222 (2.6%)
Italian: 194 (2.2%)
Polish: 189 (2.2%)
Irish: 187 (2.2%)
Albanian: 183 (2.1%)
European: 179 (2.1%)
Nigerian: 153 (1.8%)
Serbian: 132 (1.5%)
Macedonian: 98 (1.1%)
Iranian: 96 (1.1%)
English: 93 (1.1%)
Croatian: 88 (1.0%)
Lebanese: 66 (0.8%)
Eastern European: 54 (0.6%)
Arab: 53 (0.6%)
Lithuanian: 50 (0.6%)
Syrian: 47 (0.5%)
Czech: 43 (0.5%)
Armenian: 41 (0.5%)
Bulgarian: 29 (0.3%)
Hungarian: 25 (0.3%)
Dutch: 22 (0.3%)
Palestinian: 21 (0.2%)
French: 15 (0.2%)
Ukrainian: 15 (0.2%)
Swiss: 13 (0.2%)
Welsh: 13 (0.2%)
Jamaican: 8 (0.09%)
Austrian: 7 (0.08%)
Swedish: 6 (0.07%)
Belgian: 2 (0.02%) Most common places of birth for foreign-born residents (%): India Lincolnwood:
11.6% (521)Illinois:
9.2% (166,409)
Philippines Lincolnwood:
9.7% (438)Illinois:
5.2% (93,003)
Romania Lincolnwood:
7.2% (325)Illinois:
0.8% (14,736)
Bosnia and Herzegovina Lincolnwood:
6.5% (292)Illinois:
0.6% (10,776)
Vietnam Lincolnwood:
6.3% (286)Illinois:
1.2% (22,269)
Iraq Lincolnwood:
6.3% (282)Illinois:
0.7% (13,214)
Lebanon Lincolnwood:
5.1% (231)Illinois:
0.2% (3,080)
Mexico Lincolnwood:
3.8% (171)Illinois:
34.7% (626,958)
Korea Lincolnwood:
3.7% (166)Illinois:
2.2% (40,393)
Pakistan Lincolnwood:
3.3% (149)Illinois:
1.6% (29,519)
Nigeria Lincolnwood:
2.9% (129)Illinois:
1.2% (21,186)
Other Eastern Europe Lincolnwood:
2.6% (117)Illinois:
0.5% (9,834)
Iran Lincolnwood:
2.4% (106)Illinois:
0.4% (6,922)
Serbia Lincolnwood:
2.3% (103)Illinois:
0.5% (8,574)
Syria Lincolnwood:
2.2% (101)Illinois:
0.4% (6,781)
Germany Lincolnwood:
1.8% (81)Illinois:
1.0% (18,753)
Greece Lincolnwood:
1.7% (77)Illinois:
0.6% (10,720)
Israel Lincolnwood:
1.6% (74)Illinois:
0.2% (4,177)
Place of birth for U.S.-born residents:
This state: 6,964Other state: 1,296Northeast: 291Midwest: 755South: 64West: 211 91.0% of Lincolnwood residents lived in the same house 1 years ago.
Out of people who lived in different houses, 39.2% lived in this county.
Out of people who lived in different counties, 70.9% lived in Illinois.
Lincolnwood:
91.0%State average:
88.3%
Education attainment for males 25 years and older:
No schooling: 80Nursery to 4th grade: 125th and 6th grade: 577th and 8th grade: 349th grade: 010th grade: 1811th grade: 1612th grade, no diploma: 26High school graduate (or equivalency): 832Less than 1 year of college: 102Some college more than 1 year, no degree: 428Associate degree: 209Bachelor's degree: 1,589Master's degree: 538Professional school degree: 337Doctorate degree: 101
Education attainment for females 25 years and older:
No schooling: 110Nursery to 4th grade: 255th and 6th grade: 707th and 8th grade: 429th grade: 010th grade: 2911th grade: 1712th grade, no diploma: 84High school graduate (or equivalency): 728Less than 1 year of college: 167Some college more than 1 year, no degree: 527Associate degree: 248Bachelor's degree: 1,814Master's degree: 739Professional school degree: 239Doctorate degree: 132
Housing units in structures:
One, detached: 3,717One, attached: 219Two: 1513 or 4: 5720 to 49: 1950 or more: 944Mobile homes: 4Housing units lacking complete plumbing facilities in 2022: 0.4%Housing units lacking complete kitchen facilities in 2022: 1.4%House/condo owner moved in on average 16 years ago
Renter moved in on average 2 years ago
Private vs. public school enrollment:
Students in private schools in grades 1 to 8 (elementary and middle school): 251 Students in private schools in grades 9 to 12 (high school): 77 Students in private undergraduate colleges: 220