Lincolnshire, IL (Illinois) Houses and Residents
| Lincolnshire: | $624,983 |
| Illinois: | $251,600 |
Mean price in 2022:
Detached houses: $828,495
Here: $828,495 State: $310,164 Townhouses or other attached units: $527,216
Here: $527,216 State: $286,230 In 3-to-4-unit structures: $393,662
Here: $393,662 State: $330,907 In 5-or-more-unit structures: $498,264
Here: $498,264 State: $318,887
Total population: 7,292 (Urban population: 6,172, Rural population: 9 (all nonfarm))
Houses: 3,539 (3,349 occupied: 2,714 owner occupied, 699 renter occupied)
| % of renters here: | 20% |
| State: | 33% |
Housing density: 803 houses/condos per square mile
Median price asked for vacant for-sale houses and condos in 2022 in this county: $314,142.
Median contract rent in 2022: over $2,000
Median rent asked for vacant for-rent units in 2022: $3,250
Median gross rent in Lincolnshire, IL in 2022: over $2,000
Housing units in Lincolnshire with a mortgage: 1,445 (203 second mortgage, 0 home equity loan, 184 both second mortgage and home equity loan)
Houses without a mortgage: 0
Median household income for houses/condos with a mortgage: $212,889
Median household income for apartments without a mortgage: $125,318
Median monthly housing costs: $2,363
Compare current foreclosures near Lincolnshire, IL:
| Photo | Address | Area | Beds / Baths | Price | Details |
|---|---|---|---|---|---|

|
#1
Hotchkiss Ct
Lincolnshire, IL 60069
|
2,175 sq. feet
|
2 baths - beds |
show details | |

|
#2
Berkshire Ln
Lincolnshire, IL 60069
|
2,106 sq. feet
|
2 baths - beds |
show details | |

|
#3
Oakwood Ln
Lincolnshire, IL 60069
|
1,355 sq. feet
|
1 baths - beds |
show details | |

|
#4
Rivershire Pl
Lincolnshire, IL 60069
|
3,502 sq. feet
|
2 baths - beds |
show details | |

|
#5
Parkway Dr, Apt 323
Lincolnshire, IL 60069
|
- sq. feet
|
- baths - beds |
show details | |

|
#6
N Florence Ave
Lincolnshire, IL 60069
|
- sq. feet
|
- baths - beds |
show details | |

|
#7
Clover Ct
Round Lake, IL 60073
|
1,682 sq. feet
|
1 baths 3 beds |
$273,000
|
show details |

|
#8
Christiana Ave # 1
Skokie, IL 60076
|
1,400 sq. feet
|
1 baths 3 beds |
$319,000
|
show details |

|
#9
Carriage Way Dr
Arlington Heights, IL 60004
|
- sq. feet
|
2 baths 2 beds |
$179,900
|
show details |

|
#10
N 4th Ave
Des Plaines, IL 60016
|
1,381 sq. feet
|
1 baths 3 beds |
$335,000
|
show details |
| Photo | Address | Area | Beds / Baths | Price | Details |
|---|---|---|---|---|---|

|
#11
Briar Hill Dr
Schaumburg, IL 60194
|
1,600 sq. feet
|
2 baths 4 beds |
$410,400
|
show details |

|
#12
Main St
Skokie, IL 60076
|
1,428 sq. feet
|
1 baths 3 beds |
$455,000
|
show details |

|
#13
Webster Ln
Des Plaines, IL 60018
|
1,608 sq. feet
|
3 baths 3 beds |
$515,000
|
show details |

|
#14
Wisconsin Ave
Barrington, IL 60010
|
1,297 sq. feet
|
2 baths 3 beds |
$489,900
|
show details |

|
#15
S Lyman Ave
Des Plaines, IL 60016
|
2,233 sq. feet
|
2 baths 4 beds |
$330,000
|
show details |

|
#16
Avenida Serra Test
Des Plaines, IL 60018
|
- sq. feet
|
2 baths 3 beds |
$100,000
|
show details |

|
#17
Woods Dr Unit Unit 2004
Skokie, IL 60077
|
- sq. feet
|
2 baths 3 beds |
$572,000
|
show details |

|
#18
Clover Ln
Round Lake, IL 60073
|
- sq. feet
|
2 baths 3 beds |
$130,000
|
show details |

|
#19
Scarsdale Ct Unit C2
Schaumburg, IL 60193
|
950 sq. feet
|
1 baths 2 beds |
show details | |

|
#20
N Gilmer Rd
Mundelein, IL 60060
|
1,908 sq. feet
|
2 baths 4 beds |
show details |
| Photo | Address | Area | Beds / Baths | Price | Details |
|---|---|---|---|---|---|

|
#21
Crossland Dr
Grayslake, IL 60030
|
1,562 sq. feet
|
1 baths 3 beds |
show details | |

|
#22
W Kepwick Ln
Lake Zurich, IL 60047
|
2,823 sq. feet
|
3 baths 4 beds |
show details | |

|
#23
Mccraren Rd
Highland Park, IL 60035
|
2,680 sq. feet
|
2 baths 4 beds |
show details | |

|
#24
Winston Dr
Schaumburg, IL 60192
|
1,379 sq. feet
|
2 baths 3 beds |
show details | |

|
#25
E Church St
Des Plaines, IL 60016
|
- sq. feet
|
- baths - beds |
$185,500
|
show details |

|
#26
Rebecca Ct
Schaumburg, IL 60193
|
2,330 sq. feet
|
5 baths 4 beds |
show details | |

|
#27
Sprucewood Ln
Lake Villa, IL 60046
|
1,291 sq. feet
|
1 baths 3 beds |
show details | |

|
#28
Flora Ave
Glenview, IL 60025
|
2,100 sq. feet
|
3 baths 4 beds |
show details | |

|
#29
Ojibwa Trl
Round Lake, IL 60073
|
1,683 sq. feet
|
2 baths 2 beds |
show details | |

|
#30
S Hart St
Palatine, IL 60067
|
1,183 sq. feet
|
1 baths 3 beds |
show details |
| Photo | Address | Area | Beds / Baths | Price | Details |
|---|---|---|---|---|---|

|
#31
Williamsburg Dr
Hoffman Estates, IL 60169
|
1,176 sq. feet
|
1 baths 3 beds |
show details | |

|
#32
W Larkdale Ln
Mount Prospect, IL 60056
|
1,920 sq. feet
|
2 baths 4 beds |
show details | |

|
#33
Woodside Ct
Grayslake, IL 60030
|
3,078 sq. feet
|
2 baths 4 beds |
show details | |

|
#34
Old Barn Rd
Barrington, IL 60010
|
2,371 sq. feet
|
5 baths 4 beds |
show details | |

|
#35
N Buck Ct
Lake Villa, IL 60046
|
3,192 sq. feet
|
3 baths 5 beds |
show details | |

|
#36
Henley St
Glenview, IL 60025
|
3,575 sq. feet
|
2 baths 4 beds |
show details | |

|
#37
Jeffreys Pl
Highwood, IL 60040
|
1,747 sq. feet
|
2 baths 4 beds |
show details | |

|
#38
Grove Ave
Des Plaines, IL 60016
|
1,072 sq. feet
|
1 baths 3 beds |
show details | |

|
#39
N Braintree Dr
Schaumburg, IL 60194
|
2,265 sq. feet
|
3 baths 4 beds |
show details | |

|
#40
Mallard Pt
Island Lake, IL 60042
|
2,496 sq. feet
|
3 baths 4 beds |
show details |
| Photo | Address | Area | Beds / Baths | Price | Details |
|---|---|---|---|---|---|

|
#41
Park Ave
North Chicago, IL 60064
|
1,550 sq. feet
|
1 baths 3 beds |
show details | |

|
#42
Lincoln St
North Chicago, IL 60064
|
1,136 sq. feet
|
1 baths 2 beds |
show details | |

|
#43
Grace Ln
Schaumburg, IL 60193
|
976 sq. feet
|
1 baths 3 beds |
show details | |

|
#44
S Elmhurst Rd
Mount Prospect, IL 60056
|
1,340 sq. feet
|
2 baths 3 beds |
show details | |

|
#45
Rockwell Ln
Des Plaines, IL 60016
|
- sq. feet
|
2 baths 3 beds |
show details | |

|
#46
Ridge Rd
Highland Park, IL 60035
|
3,036 sq. feet
|
3 baths 5 beds |
show details | |

|
#47
Fieldbrook Dr
Wauconda, IL 60084
|
2,286 sq. feet
|
3 baths 3 beds |
show details | |

|
#48
16th St
North Chicago, IL 60064
|
1,388 sq. feet
|
1 baths 4 beds |
show details | |

|
#49
Emerson St
Morton Grove, IL 60053
|
1,296 sq. feet
|
2 baths 3 beds |
show details | |

|
Check over 1 million property listings on Foreclosure.com!
|
browse all offers | |||

Latest news about housing in Lincolnshire, IL collected exclusively by city-data.com from local newspapers, TV, and radio stations


Median year apartment built: 2008
Household type by relationship:
Households: 7,862- Male householders: 1,543 (413 living alone), Female householders: 1,771 (833 living alone)
1,768 spouses (1,754 opposite-sex spouses), 26 unmarried partners, (26 opposite-sex unmarried partners), 2,122 children (2,050 natural, 46 adopted, 25 stepchildren), 0 grandchildren, 46 brothers or sisters, 114 parents, 0 foster children, 78 other relatives, 59 non-relatives
- In group quarters: 329
Size of family households: 914 2-persons, 480 3-persons, 496 4-persons, 139 5-persons, 41 6-persons.
Size of nonfamily households: 1,316 1-person, 36 2-persons, 12 5-persons.
1,359 married couples with children.
78 single-parent households (39 men, 39 women).
75.8% of residents of Lincolnshire speak English at home.
1.5% of residents speak Spanish at home (82% speak English very well, 8% speak English well, 10% speak English not well).
8.2% of residents speak other Indo-European language at home (86% speak English very well, 9% speak English well, 2% speak English not well, 3% don't speak English at all).
14.9% of residents speak Asian or Pacific Island language at home (74% speak English very well, 18% speak English well, 5% speak English not well, 4% don't speak English at all).
0.5% of residents speak other language at home (100% speak English very well).
Foreign born population: 1,752 (22.3%)
(52.7% of them are naturalized citizens)
| Here: | 7.1 |
| State: | 6.4 |
| Here: | 3.6 |
| State: | 4.1 |

- Bedrooms in owner-occupied houses and condos in Lincolnshire, Illinois
- 0no bedroom
- 911 bedroom
- 6712 bedrooms
- 7413 bedrooms
- 8904 bedrooms
- 3215+ bedrooms

- Bedrooms in renter-occupied apartments in Lincolnshire, Illinois
- 81no bedroom
- 2781 bedroom
- 2402 bedrooms
- 933 bedrooms
- 74 bedrooms
- 05+ bedrooms

- Cars and other vehicles available in Lincolnshire in owner-occupied houses/condos
- 173no vehicle
- 6751 vehicle
- 1,1832 vehicles
- 5773 vehicles
- 494 vehicles
- 575+ vehicles

- Cars and other vehicles available in Lincolnshire in renter-occupied apartments
- 273no vehicle
- 2631 vehicle
- 1252 vehicles
- 383 vehicles
- 04 vehicles
- 05+ vehicles

- Rooms in owner-occupied houses in Lincolnshire, Illinois
- 01 room
- 92 rooms
- 973 rooms
- 2884 rooms
- 3675 rooms
- 4276 rooms
- 2937 rooms
- 2598 rooms
- 9759+ rooms

- Rooms in renter-occupied apartments in Lincolnshire, Illinois
- 811 room
- 472 rooms
- 2053 rooms
- 2464 rooms
- 675 rooms
- 436 rooms
- 47 rooms
- 78 rooms
- 09+ rooms


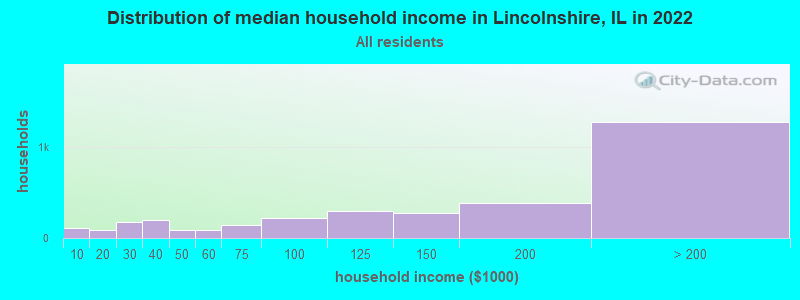
Lincolnshire, IL household income distribution

- 107Less than $10,000
- 84$10,000 to $19,999
- 179$20,000 to $29,999
- 193$30,000 to $39,999
- 89$40,000 to $49,999
- 84$50,000 to $59,999
- 140$60,000 to $74,999
- 217$75,000 to $99,999
- 295$100,000 to $124,999
- 274$125,000 to $149,999
- 388$150,000 to $199,999
- 1,274$200,000 or more
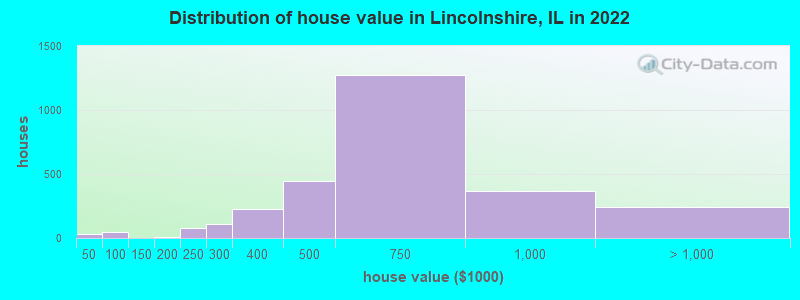
Home value of owner - occupied houses in 2022 in Lincolnshire, IL
-
- 11Less than $10,000
- 8$30,000 to $34,999
- 7$35,000 to $39,999
- 3$40,000 to $49,999
- 2$50,000 to $59,999
- 21$70,000 to $79,999
- 15$80,000 to $89,999
- 5$90,000 to $99,999
- 7$175,000 to $199,999
- 76$200,000 to $249,999
- 109$250,000 to $299,999
- 228$300,000 to $399,999
- 442$400,000 to $499,999
- 1,277$500,000 to $749,999
- 364$750,000 to $999,999
- 212$1,000,000 to $1,499,999
- 12$1,500,000 to $1,999,999
- 16$2,000,000 or more
Rent paid by renters in 2022 in Lincolnshire, IL
-
- 24$1,000 to $1,249
- 4$1,250 to $1,499
- 122$1,500 to $1,999
- 64$2,000 to $2,499
- 182$2,500 to $2,999
- 109$3,000 to $3,499
- 64$3,500 or more
- 77No cash rent


Percentage of workers working in this county: 72.9%
Number of people working at home: 1,393 (36.9% of all workers)
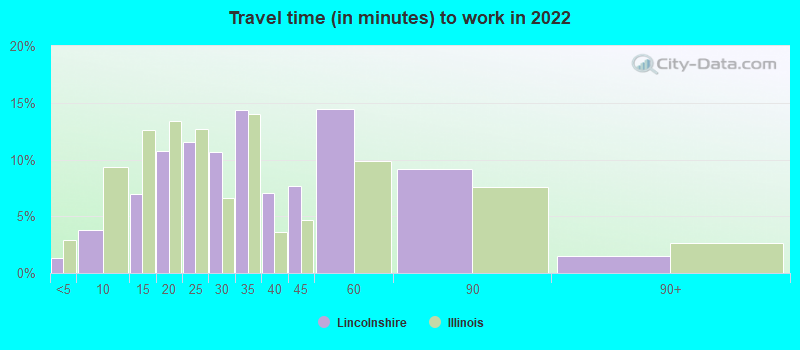
Travel time to work (commute)
- Less than 5 minutes: 63
- 5 to 9 minutes: 197
- 10 to 14 minutes: 465
- 15 to 19 minutes: 454
- 20 to 24 minutes: 432
- 25 to 29 minutes: 164
- 30 to 34 minutes: 272
- 35 to 39 minutes: 108
- 40 to 44 minutes: 111
- 45 to 59 minutes: 101
- 60 to 89 minutes: 131
- 90 or more minutes: 55
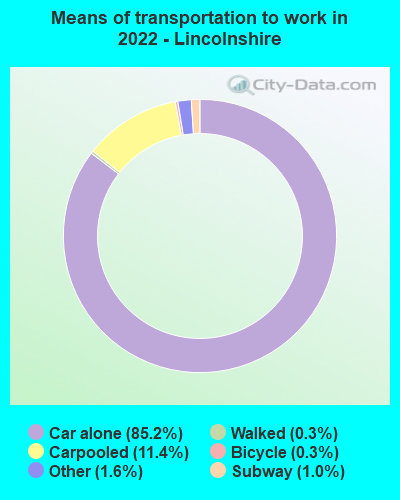
Means of transportation to work:
- Drove a car alone: 10,879 (75.0%)
- Carpooled: 1,484 (10.2%)
- Bus: 11 (0.1%)
- Long-distance train or commuter rail: 115 (0.8%)
- Taxi: 214 (1.5%)
- Bicycle: 56 (0.4%)
- Walked: 34 (0.2%)
- Worked at home: 1,393 (9.6%)

- Unemployment by race in 2022
- Unemployment rate for White non-Hispanic residents
- 2.5%Males
- 0.9%Females
- Unemployment rate for Black residents
- 8.8%Females
- Unemployment rate for Asian residents
- 3.1%Females

- Year of entry for the foreign-born population in Lincolnshire, Illinois
- 6912010 or later
- 3352000 to 2009
- 4841990 to 1999
- 971980 to 1989
- 1521970 to 1979
- 255Before 1970

First ancestries reported:
- Russian: 300 (7.5%)
- American: 239 (6.0%)
- German: 204 (5.1%)
- Irish: 184 (4.6%)
- Polish: 174 (4.3%)
- Eastern European: 118 (2.9%)
- Hungarian: 116 (2.9%)
- European: 102 (2.5%)
- Norwegian: 93 (2.3%)
- Italian: 81 (2.0%)
- Greek: 71 (1.8%)
- English: 65 (1.6%)
- French Canadian: 63 (1.6%)
- Iranian: 51 (1.3%)
- Swedish: 32 (0.8%)
- Dutch: 20 (0.5%)
- Romanian: 20 (0.5%)
- Egyptian: 17 (0.4%)
- Northern European: 17 (0.4%)
- Ukrainian: 17 (0.4%)
- Austrian: 13 (0.3%)
- British: 11 (0.3%)
- Welsh: 11 (0.3%)
- Bulgarian: 10 (0.2%)
- Syrian: 9 (0.2%)
- Scottish: 9 (0.2%)
- Scandinavian: 7 (0.2%)
- Jordanian: 5 (0.1%)
- Lebanese: 4 (0.10%)
- Turkish: 4 (0.10%)
- Belgian: 2 (0.05%)
Most common places of birth for foreign-born residents (%):
| Lincolnshire: | 27.5% (461) |
| Illinois: | 4.1% (74,364) |
| Lincolnshire: | 23.8% (399) |
| Illinois: | 9.2% (166,409) |
| Lincolnshire: | 9.5% (160) |
| Illinois: | 2.2% (40,393) |
| Lincolnshire: | 4.6% (78) |
| Illinois: | 0.8% (14,736) |
| Lincolnshire: | 3.7% (62) |
| Illinois: | 1.1% (19,306) |
| Lincolnshire: | 3.0% (51) |
| Illinois: | 1.0% (18,753) |
| Lincolnshire: | 2.9% (48) |
| Illinois: | 34.7% (626,958) |
| Lincolnshire: | 2.4% (40) |
| Illinois: | 0.5% (8,235) |
| Lincolnshire: | 2.1% (36) |
| Illinois: | 0.6% (10,943) |
| Lincolnshire: | 2.0% (34) |
| Illinois: | 0.2% (3,256) |
| Lincolnshire: | 2.0% (34) |
| Illinois: | 0.9% (16,308) |
| Lincolnshire: | 1.9% (32) |
| Illinois: | 0.2% (4,177) |
| Lincolnshire: | 1.5% (26) |
| Illinois: | 1.6% (29,316) |
Place of birth for U.S.-born residents:
- This state: 4,111
- Other state: 1,965
- Northeast: 716
- Midwest: 748
- South: 298
- West: 175
91.0% of Lincolnshire residents lived in the same house 1 years ago.
Out of people who lived in different houses, 28.6% lived in this county.
Out of people who lived in different counties, 53.8% lived in Illinois.
| Lincolnshire: | 91.0% |
| State average: | 88.3% |
Education attainment for males 25 years and older:
- No schooling: 36
- Nursery to 4th grade: 0
- 5th and 6th grade: 5
- 7th and 8th grade: 13
- 9th grade: 0
- 10th grade: 3
- 11th grade: 4
- 12th grade, no diploma: 0
- High school graduate (or equivalency): 226
- Less than 1 year of college: 78
- Some college more than 1 year, no degree: 53
- Associate degree: 88
- Bachelor's degree: 1,089
- Master's degree: 740
- Professional school degree: 285
- Doctorate degree: 301

Education attainment for females 25 years and older:
- No schooling: 10
- Nursery to 4th grade: 9
- 5th and 6th grade: 0
- 7th and 8th grade: 18
- 9th grade: 0
- 10th grade: 0
- 11th grade: 5
- 12th grade, no diploma: 38
- High school graduate (or equivalency): 424
- Less than 1 year of college: 54
- Some college more than 1 year, no degree: 252
- Associate degree: 143
- Bachelor's degree: 1,038
- Master's degree: 827
- Professional school degree: 144
- Doctorate degree: 211


Housing units in structures:
- One, detached: 1,717
- One, attached: 487
- Two: 5
- 3 or 4: 27
- 5 to 9: 13
- 10 to 19: 7
- 20 to 49: 236
- 50 or more: 1,045
Housing units lacking complete kitchen facilities in 2022: 1.2%
House/condo owner moved in on average 8 years ago
Renter moved in on average 2 years ago

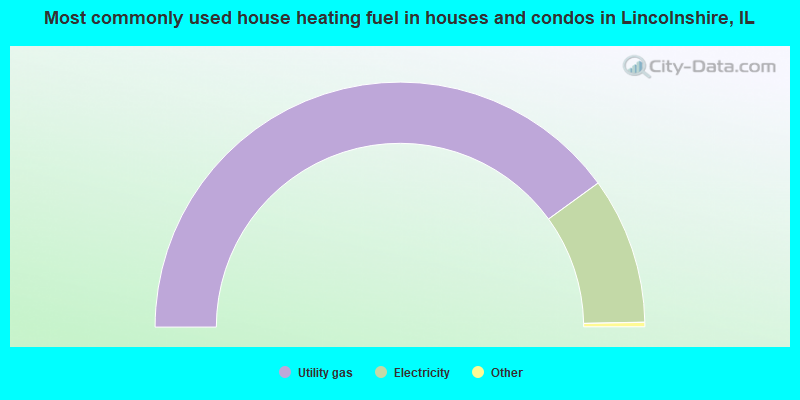
- 80.0%Utility gas
- 19.4%Electricity
- 0.3%No fuel used
- 0.2%Bottled, tank, or LP gas
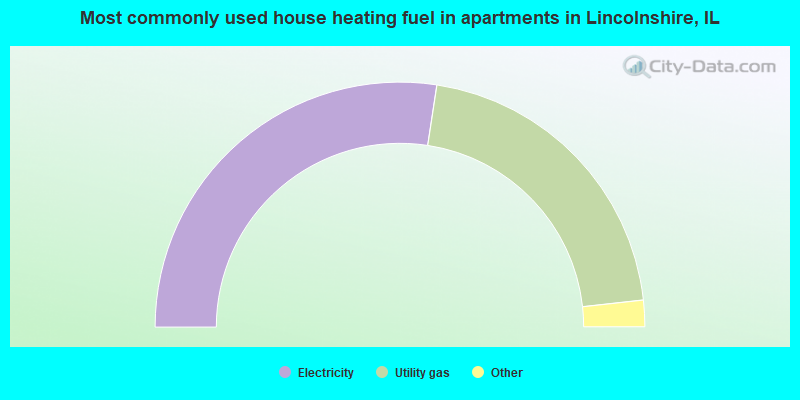
- 54.9%Electricity
- 41.7%Utility gas
- 1.9%No fuel used
- 1.5%Other fuel
Private vs. public school enrollment:
| Here: | 4.1% |
| Illinois: | 13.3% |
| Here: | 3.2% |
| Illinois: | 9.9% |
| Here: | 30.3% |
| Illinois: | 27.4% |


