Lewistown, PA (Pennsylvania) Houses and Residents
| Lewistown: | $93,880 |
| Pennsylvania: | $245,500 |
Mean price in 2022:
Detached houses: $129,279
Here: $129,279 State: $317,202 Townhouses or other attached units: $90,126
Here: $90,126 State: $254,369 In 2-unit structures: $46,603
Here: $46,603 State: $249,182 Mobile homes: $110,347
Here: $110,347 State: $92,414
Total population: 8,297 (All urban)
Houses: 4,445 (3,936 occupied: 1,618 owner occupied, 2,351 renter occupied)
| % of renters here: | 59% |
| State: | 31% |
Housing density: 2,206 houses/condos per square mile
Median price asked for vacant for-sale houses and condos in 2022: $162,235.
Median contract rent in 2022: $553 (lower quartile is $441, upper quartile is $657)
Median rent asked for vacant for-rent units in 2022: $775
Median gross rent in Lewistown, PA in 2022: $732
Housing units in Lewistown with a mortgage: 848 (48 second mortgage, 0 home equity loan, 48 both second mortgage and home equity loan)
Houses without a mortgage: 96
Median household income for houses/condos with a mortgage: $66,977
Median household income for apartments without a mortgage: $37,049
Median monthly housing costs: $726
Compare current foreclosures near Lewistown, PA:
| Photo | Address | Area | Beds / Baths | Price | Details |
|---|---|---|---|---|---|

|
#1
W 6th St
Lewistown, PA 17044
|
1,044 sq. feet
|
1 baths 3 beds |
show details | |

|
#2
Briar Patch Ln Apt A
Lewistown, PA 17044
|
- sq. feet
|
- baths - beds |
show details | |

|
#3
Fairview Pl
Lewistown, PA 17044
|
1,456 sq. feet
|
- baths - beds |
show details | |

|
#4
Pannebaker Ave
Lewistown, PA 17044
|
1,152 sq. feet
|
- baths - beds |
show details | |

|
#5
Spanogle Ave
Lewistown, PA 17044
|
1,456 sq. feet
|
- baths - beds |
show details | |

|
#6
E Walnut St
Lewistown, PA 17044
|
1,485 sq. feet
|
- baths - beds |
show details | |

|
#7
Vira Rd
Lewistown, PA 17044
|
768 sq. feet
|
- baths - beds |
show details | |

|
#8
E Walnut St
Lewistown, PA 17044
|
1,192 sq. feet
|
- baths - beds |
show details | |

|
#9
Us Highway 522 S
Lewistown, PA 17044
|
- sq. feet
|
- baths - beds |
show details | |

|
#10
S Main St
Lewistown, PA 17044
|
1,272 sq. feet
|
- baths - beds |
show details |
| Photo | Address | Area | Beds / Baths | Price | Details |
|---|---|---|---|---|---|

|
#11
Peace Dr # 53aa
Lewistown, PA 17044
|
- sq. feet
|
- baths - beds |
show details | |

|
#12
S Spruce St
Lewistown, PA 17044
|
- sq. feet
|
- baths - beds |
show details | |

|
#13
S Wayne St
Lewistown, PA 17044
|
1,556 sq. feet
|
- baths - beds |
show details | |

|
#14
E Walnut St
Lewistown, PA 17044
|
1,440 sq. feet
|
- baths - beds |
show details | |

|
#15
Us Highway 522 N
Lewistown, PA 17044
|
- sq. feet
|
- baths - beds |
show details | |

|
#16
E Walnut St
Lewistown, PA 17044
|
1,344 sq. feet
|
- baths - beds |
show details | |

|
#17
Caldwell Hill Rd
Lewistown, PA 17044
|
1,484 sq. feet
|
- baths - beds |
show details | |

|
#18
Glenbrook Ln
Lewistown, PA 17044
|
- sq. feet
|
- baths - beds |
show details | |

|
#19
Route 522
Mc Clure, PA 17841
|
- sq. feet
|
1 baths 3 beds |
show details | |

|
#20
West Dr
Boalsburg, PA 16827
|
1,416 sq. feet
|
1 baths 3 beds |
show details |
| Photo | Address | Area | Beds / Baths | Price | Details |
|---|---|---|---|---|---|

|
#21
Miller Ln
Granville, PA 17029
|
1,128 sq. feet
|
1 baths 1 beds |
show details | |

|
#22
Jacks Mill Dr # 8
Boalsburg, PA 16827
|
- sq. feet
|
- baths - beds |
show details | |

|
#23
Center Rd
Mifflintown, PA 17059
|
- sq. feet
|
- baths - beds |
show details | |

|
#24
Ferne Ridge Ln
Spring Mills, PA 16875
|
- sq. feet
|
- baths - beds |
show details | |

|
#25
Back Maitland Rd
Mc Clure, PA 17841
|
1,360 sq. feet
|
- baths - beds |
show details | |

|
#26
Back Maitland Rd
Mc Clure, PA 17841
|
- sq. feet
|
- baths - beds |
show details | |

|
#27
Lexi St
Mifflintown, PA 17059
|
- sq. feet
|
- baths - beds |
show details | |

|
#28
Snook Rd
Mc Clure, PA 17841
|
- sq. feet
|
- baths - beds |
show details | |

|
#29
Upper Stone Mountain Rd
Belleville, PA 17004
|
1,528 sq. feet
|
- baths - beds |
show details | |

|
#30
Country Ln
Mc Veytown, PA 17051
|
1,536 sq. feet
|
- baths - beds |
show details |
| Photo | Address | Area | Beds / Baths | Price | Details |
|---|---|---|---|---|---|

|
#31
W Freedom Ave, Trlr B29
Burnham, PA 17009
|
- sq. feet
|
- baths - beds |
show details | |

|
#32
E Logan Street Ext
Reedsville, PA 17084
|
1,008 sq. feet
|
- baths - beds |
show details | |

|
#33
Colonel Ln
Milroy, PA 17063
|
- sq. feet
|
- baths - beds |
show details | |

|
#34
Wisteria Ln
Mc Veytown, PA 17051
|
1,904 sq. feet
|
- baths - beds |
show details | |

|
#35
E Back Mountain Rd
Milroy, PA 17063
|
- sq. feet
|
- baths - beds |
show details | |

|
#36
E Main St
Belleville, PA 17004
|
- sq. feet
|
- baths - beds |
show details | |

|
#37
Maclay St
Milroy, PA 17063
|
1,448 sq. feet
|
- baths - beds |
show details | |

|
#38
Us Highway 522 N
Mc Clure, PA 17841
|
- sq. feet
|
- baths - beds |
show details | |

|
#39
Old Us Highway 322
Reedsville, PA 17084
|
- sq. feet
|
- baths - beds |
show details | |

|
#40
Us Highway 522 S
Mc Veytown, PA 17051
|
- sq. feet
|
- baths - beds |
show details |
| Photo | Address | Area | Beds / Baths | Price | Details |
|---|---|---|---|---|---|

|
#41
Route 522
Mc Clure, PA 17841
|
- sq. feet
|
- baths - beds |
show details | |

|
#42
S Zeller St
Mc Clure, PA 17841
|
- sq. feet
|
- baths - beds |
show details | |

|
#43
E Ohio St
Mc Clure, PA 17841
|
- sq. feet
|
- baths - beds |
show details | |

|
#44
Shade St
Mc Clure, PA 17841
|
- sq. feet
|
- baths - beds |
show details | |

|
#45
E Main St
Boalsburg, PA 16827
|
- sq. feet
|
- baths - beds |
show details | |

|
#46
Kline Hill Rd
Mc Clure, PA 17841
|
- sq. feet
|
- baths - beds |
show details | |

|
Check over 1 million property listings on Foreclosure.com!
|
browse all offers | |||

Latest news about housing in Lewistown, PA collected exclusively by city-data.com from local newspapers, TV, and radio stations

 | single family homes to rent (4 replies) |
| Walkable areas - PA small to mid sized cities (19 replies) |
| Living mostly off grid in PA with tiny house on wheels? (15 replies) |
| PA population loss and retention - merged threads (112 replies) |
| Living mostly off grid in Pennsylvania with tiny house on wheels? (9 replies) |
| East and West Pa. Different or the same? (32 replies) |

Median year apartment built: 1948
Household type by relationship:
Households: 8,510- Male householders: 1,716 (744 living alone), Female householders: 2,173 (857 living alone)
971 spouses (971 opposite-sex spouses), 608 unmarried partners, (580 opposite-sex unmarried partners), 2,262 children (2,171 natural, 35 adopted, 55 stepchildren), 248 grandchildren, 41 brothers or sisters, 18 parents, 0 foster children, 27 other relatives, 274 non-relatives
- In group quarters: 165
Size of family households: 853 2-persons, 427 3-persons, 413 4-persons, 85 5-persons, 90 6-persons, 42 7-or-more-persons.
Size of nonfamily households: 1,655 1-person, 333 2-persons, 79 3-persons, 7 4-persons.
756 married couples with children.
1,164 single-parent households (414 men, 750 women).
95.1% of residents of Lewistown speak English at home.
3.0% of residents speak Spanish at home (60% speak English very well, 4% speak English well, 36% speak English not well).
0.5% of residents speak other Indo-European language at home (66% speak English very well, 34% speak English not well).
0.8% of residents speak Asian or Pacific Island language at home (80% speak English very well, 20% speak English well).
Foreign born population: 164 (1.9%)
(62.8% of them are naturalized citizens)
| Here: | 6.4 |
| State: | 6.8 |
| Here: | 4.4 |
| State: | 4.3 |

- Bedrooms in owner-occupied houses and condos in Lewistown, Pennsylvania
- 0no bedroom
- 1051 bedroom
- 2292 bedrooms
- 8223 bedrooms
- 4314 bedrooms
- 325+ bedrooms

- Bedrooms in renter-occupied apartments in Lewistown, Pennsylvania
- 286no bedroom
- 6501 bedroom
- 7052 bedrooms
- 6333 bedrooms
- 614 bedrooms
- 155+ bedrooms

- Cars and other vehicles available in Lewistown in owner-occupied houses/condos
- 33no vehicle
- 7401 vehicle
- 6022 vehicles
- 2093 vehicles
- 254 vehicles
- 95+ vehicles

- Cars and other vehicles available in Lewistown in renter-occupied apartments
- 682no vehicle
- 1,1631 vehicle
- 4272 vehicles
- 413 vehicles
- 274 vehicles
- 125+ vehicles

- Rooms in owner-occupied houses in Lewistown, Pennsylvania
- 01 room
- 02 rooms
- 213 rooms
- 664 rooms
- 2235 rooms
- 5666 rooms
- 2767 rooms
- 1798 rooms
- 2869+ rooms

- Rooms in renter-occupied apartments in Lewistown, Pennsylvania
- 2741 room
- 742 rooms
- 4273 rooms
- 4674 rooms
- 2865 rooms
- 5506 rooms
- 1807 rooms
- 588 rooms
- 349+ rooms


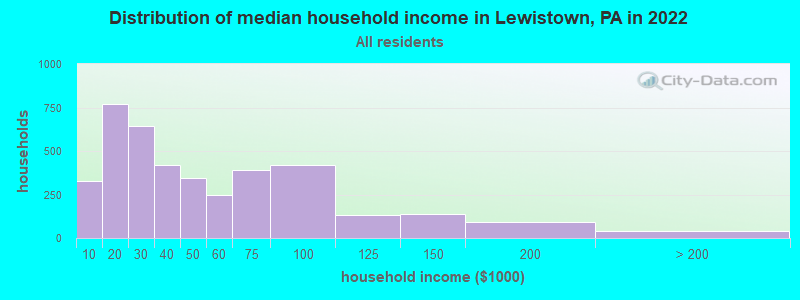
Lewistown, PA household income distribution

- 328Less than $10,000
- 772$10,000 to $19,999
- 646$20,000 to $29,999
- 418$30,000 to $39,999
- 342$40,000 to $49,999
- 250$50,000 to $59,999
- 390$60,000 to $74,999
- 418$75,000 to $99,999
- 134$100,000 to $124,999
- 137$125,000 to $149,999
- 93$150,000 to $199,999
- 42$200,000 or more
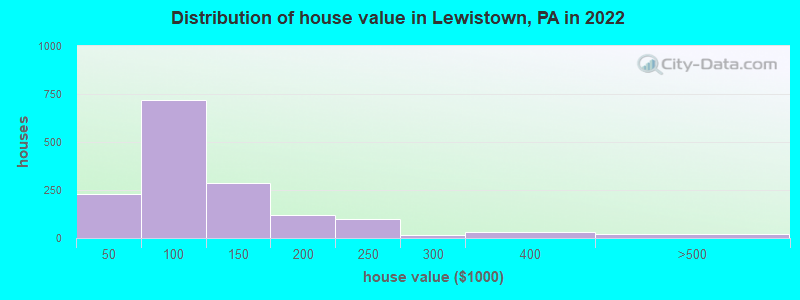
Home value of owner - occupied houses in 2022 in Lewistown, PA
-
- 52$20,000 to $24,999
- 22$25,000 to $29,999
- 39$30,000 to $34,999
- 46$35,000 to $39,999
- 68$40,000 to $49,999
- 205$50,000 to $59,999
- 148$60,000 to $69,999
- 58$70,000 to $79,999
- 166$80,000 to $89,999
- 71$90,000 to $99,999
- 161$100,000 to $124,999
- 124$125,000 to $149,999
- 107$150,000 to $174,999
- 12$175,000 to $199,999
- 99$200,000 to $249,999
- 14$250,000 to $299,999
- 33$300,000 to $399,999
- 21$400,000 to $499,999
Rent paid by renters in 2022 in Lewistown, PA
-
- 45Less than $100
- 40$100 to $149
- 52$200 to $249
- 83$250 to $299
- 151$300 to $349
- 83$350 to $399
- 140$400 to $449
- 125$450 to $499
- 503$500 to $549
- 121$550 to $599
- 582$600 to $649
- 170$650 to $699
- 123$700 to $749
- 62$750 to $799
- 45$800 to $899
- 45$900 to $999
- 16$1,250 to $1,499
- 59No cash rent


Percentage of workers working in this county: 72.1%
Number of people working at home: 164 (4.9% of all workers)
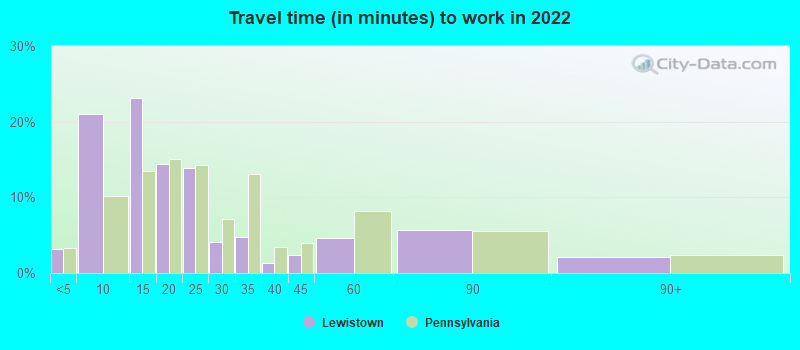
Travel time to work (commute)
- Less than 5 minutes: 97
- 5 to 9 minutes: 805
- 10 to 14 minutes: 679
- 15 to 19 minutes: 341
- 20 to 24 minutes: 307
- 25 to 29 minutes: 144
- 30 to 34 minutes: 146
- 35 to 39 minutes: 74
- 40 to 44 minutes: 112
- 45 to 59 minutes: 206
- 60 to 89 minutes: 129
- 90 or more minutes: 84
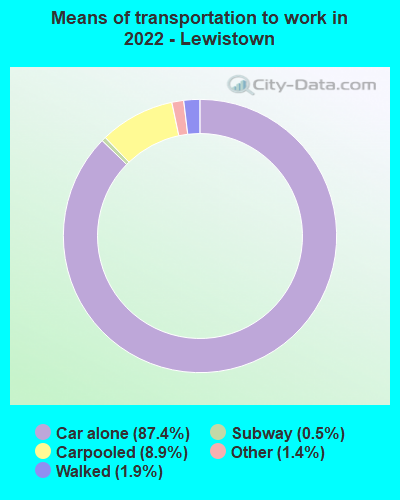
Means of transportation to work:
- Drove a car alone: 4,355 (82.4%)
- Carpooled: 443 (8.4%)
- Long-distance train or commuter rail: 16 (0.3%)
- Taxi: 79 (1.5%)
- Walked: 94 (1.8%)
- Worked at home: 164 (3.1%)

- Unemployment by race in 2022
- Unemployment rate for White non-Hispanic residents
- 1.7%Males
- 8.2%Females
- Unemployment rate for two or more race residents
- 44.4%Females
- Unemployment rate for Hispanic or Latino residents
- 22.4%Females

- Year of entry for the foreign-born population in Lewistown, Pennsylvania
- 02010 or later
- 822000 to 2009
- 491990 to 1999
- 141980 to 1989
- 101970 to 1979
- 31Before 1970

First ancestries reported:
- German: 1,247 (27.4%)
- American: 889 (19.5%)
- Irish: 567 (12.5%)
- English: 223 (4.9%)
- Pennsylvania German: 159 (3.5%)
- Polish: 89 (2.0%)
- Italian: 61 (1.3%)
- Scottish: 45 (1.0%)
- Welsh: 34 (0.7%)
- Dutch: 27 (0.6%)
- European: 26 (0.6%)
- Belgian: 25 (0.5%)
- Greek: 12 (0.3%)
- British: 10 (0.2%)
- Eastern European: 7 (0.2%)
- French: 7 (0.2%)
- Scotch-Irish: 7 (0.2%)
- Ukrainian: 6 (0.1%)
- Iranian: 5 (0.1%)
- Swiss: 5 (0.1%)
- Slovak: 1 (0.02%)
Most common places of birth for foreign-born residents (%):
| Lewistown: | 32.9% (54) |
| Pennsylvania: | 5.8% (54,190) |
| Lewistown: | 22.6% (37) |
| Pennsylvania: | 7.2% (67,704) |
| Lewistown: | 20.7% (34) |
| Pennsylvania: | 10.7% (100,596) |
| Lewistown: | 7.9% (13) |
| Pennsylvania: | 2.2% (21,039) |
| Lewistown: | 6.7% (11) |
| Pennsylvania: | 0.5% (4,593) |
| Lewistown: | 3.7% (6) |
| Pennsylvania: | 0.4% (4,204) |
Place of birth for U.S.-born residents:
- This state: 7,125
- Other state: 964
- Northeast: 307
- Midwest: 188
- South: 439
- West: 26
84.8% of Lewistown residents lived in the same house 1 years ago.
Out of people who lived in different houses, 40.9% lived in this county.
Out of people who lived in different counties, 74.0% lived in Pennsylvania.
| Lewistown: | 84.8% |
| State average: | 89.3% |
Education attainment for males 25 years and older:
- No schooling: 37
- Nursery to 4th grade: 0
- 5th and 6th grade: 0
- 7th and 8th grade: 15
- 9th grade: 29
- 10th grade: 141
- 11th grade: 132
- 12th grade, no diploma: 72
- High school graduate (or equivalency): 1,330
- Less than 1 year of college: 122
- Some college more than 1 year, no degree: 353
- Associate degree: 151
- Bachelor's degree: 187
- Master's degree: 61
- Professional school degree: 7
- Doctorate degree: 8

Education attainment for females 25 years and older:
- No schooling: 28
- Nursery to 4th grade: 0
- 5th and 6th grade: 5
- 7th and 8th grade: 98
- 9th grade: 62
- 10th grade: 156
- 11th grade: 108
- 12th grade, no diploma: 25
- High school graduate (or equivalency): 1,158
- Less than 1 year of college: 277
- Some college more than 1 year, no degree: 273
- Associate degree: 177
- Bachelor's degree: 254
- Master's degree: 114
- Professional school degree: 14
- Doctorate degree: 28


Housing units in structures:
- One, detached: 1,937
- One, attached: 745
- Two: 567
- 3 or 4: 361
- 5 to 9: 309
- 10 to 19: 137
- 20 to 49: 144
- 50 or more: 162
- Mobile homes: 78
Housing units lacking complete kitchen facilities in 2022: 5.6%
House/condo owner moved in on average 16 years ago
Renter moved in on average 1 years ago

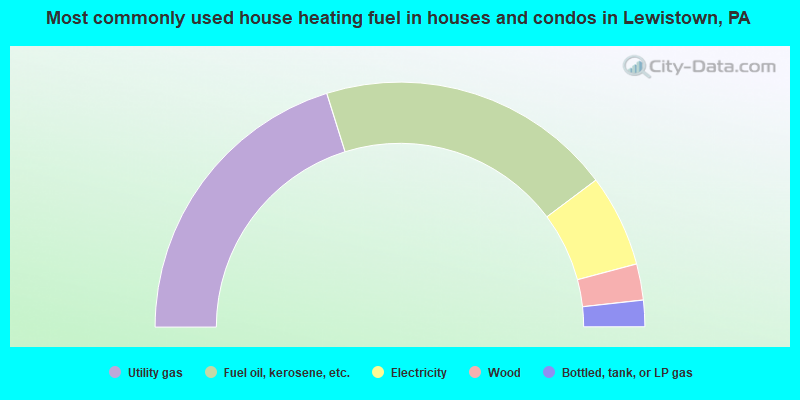
- 40.4%Utility gas
- 39.2%Fuel oil, kerosene, etc.
- 12.2%Electricity
- 4.8%Wood
- 3.5%Bottled, tank, or LP gas
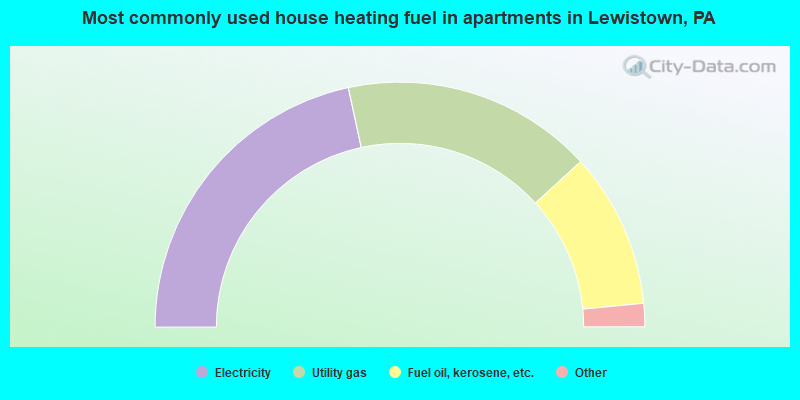
- 43.3%Electricity
- 33.2%Utility gas
- 20.5%Fuel oil, kerosene, etc.
- 0.9%Wood
- 0.9%Bottled, tank, or LP gas
- 0.7%Other fuel
- 0.6%No fuel used
Private vs. public school enrollment:
| Here: | 13.6% |
| Pennsylvania: | 15.7% |
| Here: | 14.0% |
| Pennsylvania: | 13.4% |
| Here: | 35.6% |
| Pennsylvania: | 39.8% |


