Lenexa, KS (Kansas) Houses and Residents
Estimated median house or condo value in 2022: $375,103 (it was $156,300 in 2000 )
Lenexa:
$375,103Kansas:
$206,600
Lower value quartile - upper value quartile: $290,038 - $485,366Mean price in 2022: Detached houses: $414,682 Here:
$414,682State:
$264,181
Townhouses or other attached units: $230,656 Here:
$230,656State:
$219,178
In 3-to-4-unit structures: $119,907 Here:
$119,907State:
$161,859
In 5-or-more-unit structures: $197,747 Here:
$197,747State:
$267,030
Mobile homes: $147,458 Here:
$147,458State:
$74,712
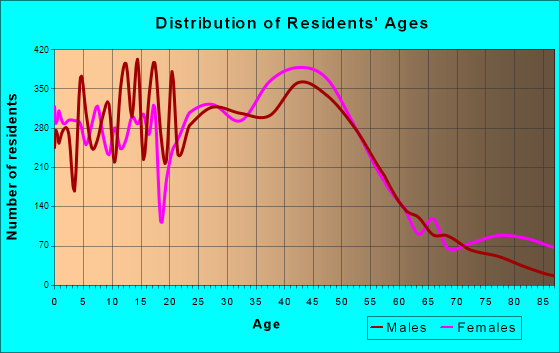
Total population: 51,042 (Urban population: 38,540, Rural population: 1,557 (87 farm, 1,470 nonfarm ))
Houses: 26,093 (24,810 occupied: 14,268 owner occupied, 10,660 renter occupied )
% of renters here:
43%State:
32%
Housing density: 761 houses/condos per square mile
Median price asked for vacant for-sale houses and condos in 2022: $298,386.
Median contract rent in 2022: $1,200 (lower quartile is $983, upper quartile is $1,495)
Median rent asked for vacant for-rent units in 2022: $2,472
Median gross rent in Lenexa, KS in 2022: $1,361
Housing units in Lenexa with a mortgage: 9,555 (1,086 second mortgage, 81 home equity loan, 836 both second mortgage and home equity loan )Houses without a mortgage: 398
Median household income for houses/condos with a mortgage: $140,747
Median household income for apartments without a mortgage: $94,018
Median monthly housing costs: $1,487
Data:
Median house or condo value ($)
Median house or condo value ($ change since 2000)
Median house or condo value ($) - White
Median house or condo value ($) - Black or African American
Median house or condo value ($) - Asian
Median house or condo value ($) - Hispanic or Latino
Median house or condo value ($) - American Indian and Alaska Native
Median house or condo value ($) - Multirace
Median house or condo value ($) - Other Race
Median price asked for mobile homes ($)
Household density (households per square mile)
Mean house or condo value by units in structure - 1, detached ($)
Mean house or condo value by units in structure - 1, attached ($)
Mean house or condo value by units in structure - 2 ($)
Mean house or condo value by units in structure by units in structure - 3 or 4 ($)
Mean house or condo value by units in structure - 5 or more ($)
Mean house or condo value by units in structure - Boat, RV, van, etc. ($)
Mean house or condo value by units in structure - Mobile home ($)
Median contract rent ($)
Median contract rent - Lower quartile ($)
Median contract rent - Upper quartile ($)
Median gross rent ($)
Urban houses (%)
Rural houses (%)
Houses occupied (%)
Houses occupied (% change since 2000)
Houses owner occupied (%)
Houses owner occupied (% change since 2000)
Houses renter occupied (%)
Houses renter occupied (% change since 2000)
Vacant housing units - For rent (%)
Vacant housing units - For rent (% change since 2000)
Vacant housing units - For sale only (%)
Vacant housing units - For sale only (% change since 2000)
Vacant housing units - Rented or sold, not occupied (%)
Vacant housing units - Rented or sold, not occupied (% change since 2000)
Vacant housing units - For seasonal, recreational, or occasional use (%)
Vacant housing units - For seasonal, recreational, or occasional use (% change since 2000)
Vacant housing units - For migrant workers (%)
Vacant housing units - For migrant workers (% change since 2000)
Vacant housing units - Other vacant (%)
Vacant housing units - Other vacant (% change since 2000)
Median monthly housing costs ($)
Median household income for houses/condos with a mortgage ($)
Median household income for houses/condos without a mortgage ($)
Median household income ($)
Median household income ($) - White
Median household income ($) - Black or African American
Median household income ($) - Asian
Median household income ($) - Hispanic or Latino
Median household income ($) - American Indian and Alaska Native
Median household income ($) - Multirace
Median household income ($) - Other Race
Mortgage status - with mortgage (%)
Mortgage status - with second mortgage (%)
Mortgage status - with home equity loan (%)
Mortgage status - with both second mortgage and home equity loan (%)
Mortgage status - without a mortgage (%)
Median year house/condo built
Median year apartment built
Household type by relationship - Male householder living alone (%)
Household type by relationship - Male householder not living alone (%)
Household type by relationship - Female householder living alone (%)
Household type by relationship - Female householder not living alone (%)
Household type by relationship - Opposite-Sex spouse (%)
Household type by relationship - Same-Sex spouse (%)
Household type by relationship - Opposite-Sex unmarried partner (%)
Household type by relationship - Same-Sex unmarried partner (%)
Household type by relationship - In group quarters (%)
Size of family households - 2-person household (%)
Size of family households - 3-person household (%)
Size of family households - 4-person household (%)
Size of family households - 5-person household (%)
Size of family households - 6-person household (%)
Size of family households - 7-or-more-person household (%)
Size of nonfamily households - 1-person household (%)
Size of nonfamily households - 2-person household (%)
Size of nonfamily households - 3-person household (%)
Size of nonfamily households - 4-person household (%)
Size of nonfamily households - 5-person household (%)
Size of nonfamily households - 6-person household (%)
Size of nonfamily households - 7-or-moreperson household (%)
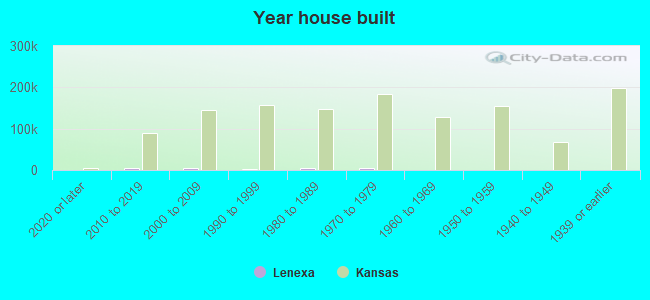
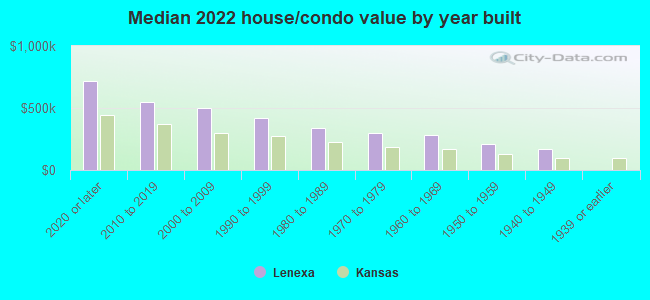
Year house built - Built 2010 or later (%)
Year house built - Built 2000 to 2009 (%)
Year house built - Built 1990 to 1999 (%)
Year house built - Built 1980 to 1989 (%)
Year house built - Built 1970 to 1979 (%)
Year house built - Built 1960 to 1969 (%)
Year house built - Built 1950 to 1959 (%)
Year house built - Built 1940 to 1949 (%)
Year house built - Built 1939 or earlier (%)
Median number of rooms in houses and condos
Median number of rooms in apartments
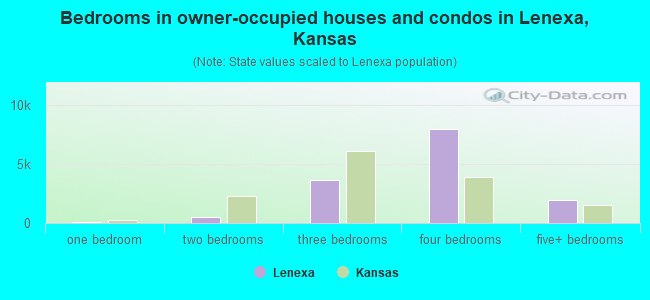
Median number of bedrooms in owner occupied houses
Mean number of bedrooms in owner occupied houses
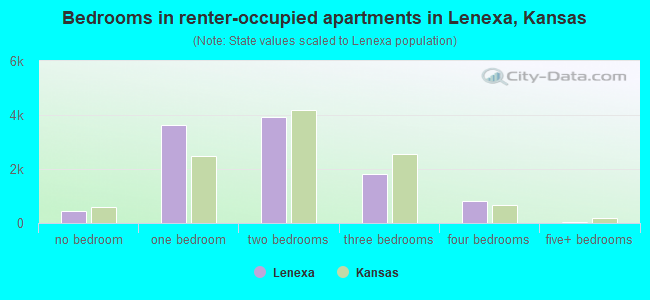
Median number of bedrooms in renter occupied houses
Mean number of bedrooms in renter occupied houses
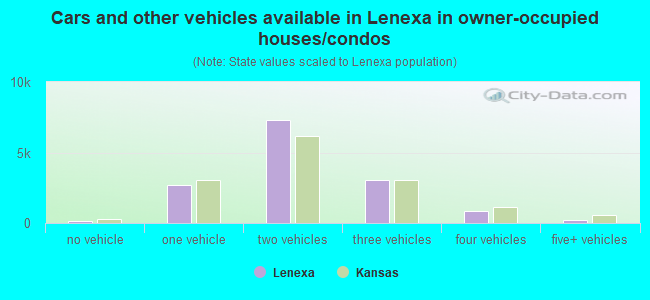
Median number of vehichles in owner occupied houses
Mean number of vehichles in owner occupied houses
Median number of vehichles in renter occupied houses
Mean number of vehichles in renter occupied houses
Rooms in owner-occupied houses - 1 room (%)
Rooms in owner-occupied houses - 2 rooms (%)
Rooms in owner-occupied houses - 3 rooms (%)
Rooms in owner-occupied houses - 4 rooms (%)
Rooms in owner-occupied houses - 5 rooms (%)
Rooms in owner-occupied houses - 6 rooms (%)
Rooms in owner-occupied houses - 7 rooms (%)
Rooms in owner-occupied houses - 8 rooms (%)
Rooms in owner-occupied houses - 9+ rooms (%)
Rooms in renter-occupied houses - 1 room (%)
Rooms in renter-occupied houses - 2 rooms (%)
Rooms in renter-occupied houses - 3 rooms (%)
Rooms in renter-occupied houses - 4 rooms (%)
Rooms in renter-occupied houses - 5 rooms (%)
Rooms in renter-occupied houses - 6 rooms (%)
Rooms in renter-occupied houses - 7 rooms (%)
Rooms in renter-occupied houses - 8 rooms (%)
Rooms in renter-occupied houses - 9+ rooms (%)
Bedrooms in owner-occupied houses - no bedrooms (%)
Bedrooms in owner-occupied houses - 1 bedroom (%)
Bedrooms in owner-occupied houses - 2 bedrooms (%)
Bedrooms in owner-occupied houses - 3 bedrooms (%)
Bedrooms in owner-occupied houses - 4 bedrooms (%)
Bedrooms in owner-occupied houses - 5+ bedrooms (%)
Bedrooms in renter-occupied houses - no bedrooms (%)
Bedrooms in renter-occupied houses - 1 bedroom (%)
Bedrooms in renter-occupied houses - 2 bedrooms (%)
Bedrooms in renter-occupied houses - 3 bedrooms (%)
Bedrooms in renter-occupied houses - 4 bedrooms (%)
Bedrooms in renter-occupied houses - 5+ bedrooms (%)
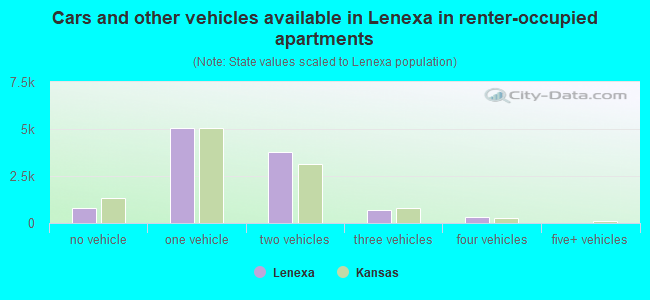
Vehicles available in owner-occupied houses - no vehicle available (%)
Vehicles available in owner-occupied houses - 1 vehicle available(%)
Vehicles available in owner-occupied houses - 2 Vehicles available (%)
Vehicles available in owner-occupied houses - 3 Vehicles available (%)
Vehicles available in owner-occupied houses - 4 Vehicles available (%)
Vehicles available in owner-occupied houses - 5+ Vehicles available (%)
Vehicles available in renter-occupied houses - no vehicle available (%)
Vehicles available in renter-occupied houses - 1 vehicle available (%)
Vehicles available in renter-occupied houses - 2 Vehicles available (%)
Vehicles available in renter-occupied houses - 3 Vehicles available (%)
Vehicles available in renter-occupied houses - 4 Vehicles available (%)
Vehicles available in renter-occupied houses - 5+ Vehicles available (%)
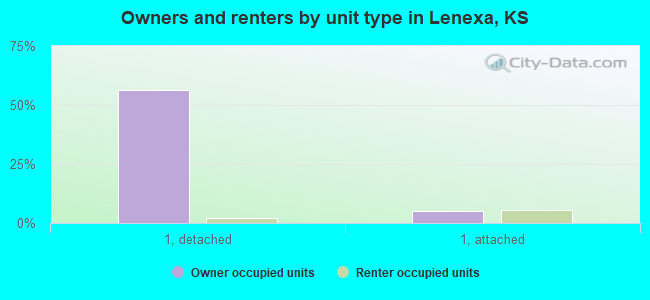
Housing units in structures - 1, detached (%)
Housing units in structures - 1, attached (%)
Housing units in structures - 2 (%)
Housing units in structures - 3 or 4 (%)
Housing units in structures - 5 to 9 (%)
Housing units in structures - 10 to 19 (%)
Housing units in structures - 20 to 49 (%)
Housing units in structures - 50 or more (%)
Housing units in structures - Mobile home (%)
Housing units in structures - Boat, RV, van, etc. (%)
Housing units in structures - Owners - 1, detached (%)
Housing units in structures - Owners - 1, attached (%)
Housing units in structures - Owners - 2 (%)
Housing units in structures - Owners - 3 or 4 (%)
Housing units in structures - Owners - 5 to 9 (%)
Housing units in structures - Owners - 10 to 19 (%)
Housing units in structures - Owners - 20 to 49 (%)
Housing units in structures - Owners - 50 or more (%)
Housing units in structures - Owners - Mobile home (%)
Housing units in structures - Owners - Boat, RV, van, etc. (%)
Housing units in structures - Renters - 1, detached (%)
Housing units in structures - Renters - 1, attached (%)
Housing units in structures - Renters - 2 (%)
Housing units in structures - Renters - 3 or 4 (%)
Housing units in structures - Renters - 5 to 9 (%)
Housing units in structures - Renters - 10 to 19 (%)
Housing units in structures - Renters - 20 to 49 (%)
Housing units in structures - Renters - 50 or more (%)
Housing units in structures - Renters - Mobile home (%)
Housing units in structures - Renters - Boat, RV, van, etc. (%)
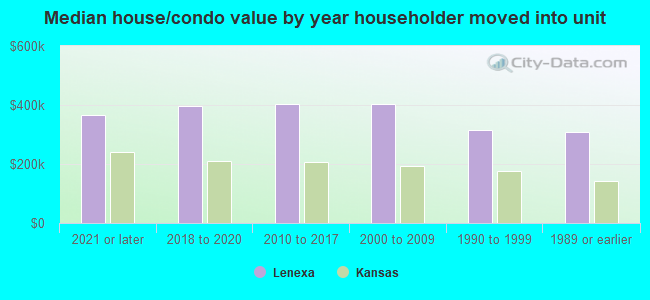
House/condo owner moved in on average (years ago)
Renter moved in on average (years ago)
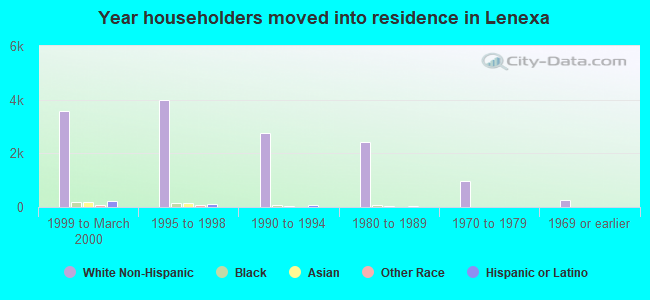
Year householder moved into unit - Moved in 1999 to March 2000 (%)
Year householder moved into unit - Moved in 1999 to March 2000 (%) - White
Year householder moved into unit - Moved in 1999 to March 2000 (%) - Black or African American
Year householder moved into unit - Moved in 1999 to March 2000 (%) - Asian
Year householder moved into unit - Moved in 1999 to March 2000 (%) - Hispanic or Latino
Year householder moved into unit - Moved in 1999 to March 2000 (%) - American Indian and Alaska Native
Year householder moved into unit - Moved in 1999 to March 2000 (%) - Multirace
Year householder moved into unit - Moved in 1999 to March 2000 (%) - Other Race
Year householder moved into unit - Moved in 1995 to 1998 (%)
Year householder moved into unit - Moved in 1995 to 1998 (%) - White
Year householder moved into unit - Moved in 1995 to 1998 (%) - Black or African American
Year householder moved into unit - Moved in 1995 to 1998 (%) - Asian
Year householder moved into unit - Moved in 1995 to 1998 (%) - Hispanic or Latino
Year householder moved into unit - Moved in 1995 to 1998 (%) - American Indian and Alaska Native
Year householder moved into unit - Moved in 1995 to 1998 (%) - Multirace
Year householder moved into unit - Moved in 1995 to 1998 (%) - Other Race
Year householder moved into unit - Moved in 1990 to 1994 (%)
Year householder moved into unit - Moved in 1990 to 1994 (%) - White
Year householder moved into unit - Moved in 1990 to 1994 (%) - Black or African American
Year householder moved into unit - Moved in 1990 to 1994 (%) - Asian
Year householder moved into unit - Moved in 1990 to 1994 (%) - Hispanic or Latino
Year householder moved into unit - Moved in 1990 to 1994 (%) - American Indian and Alaska Native
Year householder moved into unit - Moved in 1990 to 1994 (%) - Multirace
Year householder moved into unit - Moved in 1990 to 1994 (%) - Other Race
Year householder moved into unit - Moved in 1980 to 1989 (%)
Year householder moved into unit - Moved in 1980 to 1989 (%) - White
Year householder moved into unit - Moved in 1980 to 1989 (%) - Black or African American
Year householder moved into unit - Moved in 1980 to 1989 (%) - Asian
Year householder moved into unit - Moved in 1980 to 1989 (%) - Hispanic or Latino
Year householder moved into unit - Moved in 1980 to 1989 (%) - American Indian and Alaska Native
Year householder moved into unit - Moved in 1980 to 1989 (%) - Multirace
Year householder moved into unit - Moved in 1980 to 1989 (%) - Other Race
Year householder moved into unit - Moved in 1970 to 1979 (%)
Year householder moved into unit - Moved in 1970 to 1979 (%) - White
Year householder moved into unit - Moved in 1970 to 1979 (%) - Black or African American
Year householder moved into unit - Moved in 1970 to 1979 (%) - Asian
Year householder moved into unit - Moved in 1970 to 1979 (%) - Hispanic or Latino
Year householder moved into unit - Moved in 1970 to 1979 (%) - American Indian and Alaska Native
Year householder moved into unit - Moved in 1970 to 1979 (%) - Multirace
Year householder moved into unit - Moved in 1970 to 1979 (%) - Other Race
Year householder moved into unit - Moved in 1969 or earlier (%)
Year householder moved into unit - Moved in 1969 or earlier (%) - White
Year householder moved into unit - Moved in 1969 or earlier (%) - Black or African American
Year householder moved into unit - Moved in 1969 or earlier (%) - Asian
Year householder moved into unit - Moved in 1969 or earlier (%) - Hispanic or Latino
Year householder moved into unit - Moved in 1969 or earlier (%) - American Indian and Alaska Native
Year householder moved into unit - Moved in 1969 or earlier (%) - Multirace
Year householder moved into unit - Moved in 1969 or earlier (%) - Other Race
Housing units lacking complete plumbing facilities (%)
Housing units lacking complete kitchen facilities (%)
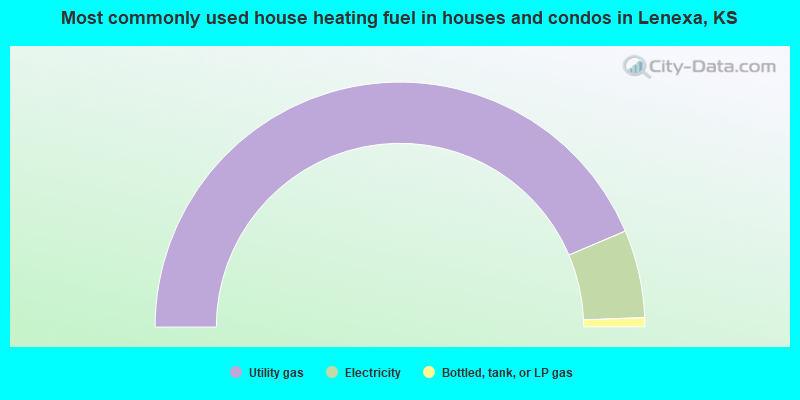
House heating fuel used in houses and condos - Utility gas (%)
House heating fuel used in houses and condos - Bottled, tank, or LP gas (%)
House heating fuel used in houses and condos - Electricity (%)
House heating fuel used in houses and condos - Fuel oil, kerosene, etc. (%)
House heating fuel used in houses and condos - Coal or coke (%)
House heating fuel used in houses and condos - Wood (%)
House heating fuel used in houses and condos - Solar energy (%)
House heating fuel used in houses and condos - Other fuel (%)
House heating fuel used in houses and condos - No fuel used (%)
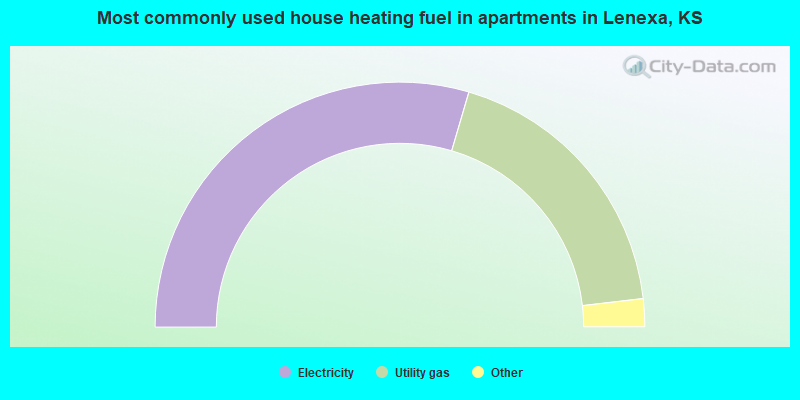
House heating fuel used in apartments - Utility gas (%)
House heating fuel used in apartments - Bottled, tank, or LP gas (%)
House heating fuel used in apartments - Electricity (%)
House heating fuel used in apartments - Fuel oil, kerosene, etc. (%)
House heating fuel used in apartments - Coal or coke (%)
House heating fuel used in apartments - Wood (%)
House heating fuel used in apartments - Solar energy (%)
House heating fuel used in apartments - Other fuel (%)
House heating fuel used in apartments - No fuel used (%)
Latest news about housing in Lenexa, KS collected exclusively by city-data.com from local newspapers, TV, and radio stations
Median year house/condo built: 1987Median year apartment built: 1997Household type by relationship:
Households: 58,292
Male householders: 12,663 (2,967 living alone ), Female householders: 11,870 (3,970 living alone )12,521 spouses (12,480 opposite-sex spouses ), 1,604 unmarried partners , (1,543 opposite-sex unmarried partners ), 15,898 children (14,981 natural , 558 adopted , 357 stepchildren ), 452 grandchildren , 494 brothers or sisters , 362 parents , 74 foster children , 429 other relatives , 1,455 non-relatives In group quarters: 464
Size of family households: 7,830 2-persons , 3,452 3-persons , 3,028 4-persons , 949 5-persons , 372 6-persons , 81 7-or-more-persons .
Size of nonfamily households: 7,687 1-person , 1,399 2-persons , 173 3-persons , 33 4-persons .
9,543 married couples with children. single-parent households (582 men , 1,628 women ).
91.4% of residents of Lenexa speak English at home. of residents speak Spanish at home (66% speak English very well , 16% speak English well , 12% speak English not well , 6% don't speak English at all ).of residents speak other Indo-European language at home (82% speak English very well , 14% speak English well , 4% speak English not well ).of residents speak Asian or Pacific Island language at home (58% speak English very well , 18% speak English well , 16% speak English not well , 8% don't speak English at all ).of residents speak other language at home (71% speak English very well , 17% speak English well , 12% speak English not well ).
Foreign born population: 4,199 (7.2%)of them are naturalized citizens )
Median number of rooms in houses and condos:
Median number of rooms in apartments
Owner-occupied Renter-occupied
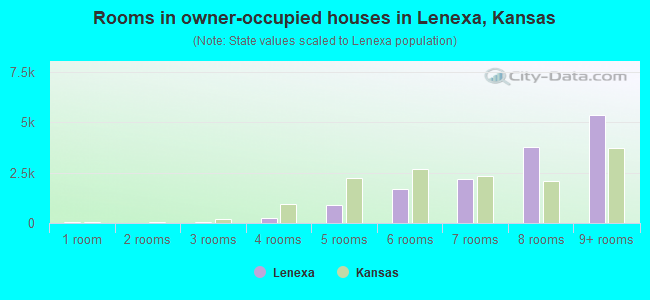
Rooms in owner-occupied houses in Lenexa, Kansas
60 1 room 16 2 rooms 46 3 rooms 265 4 rooms 897 5 rooms 1,675 6 rooms 2,196 7 rooms 3,755 8 rooms 5,358 9+ rooms
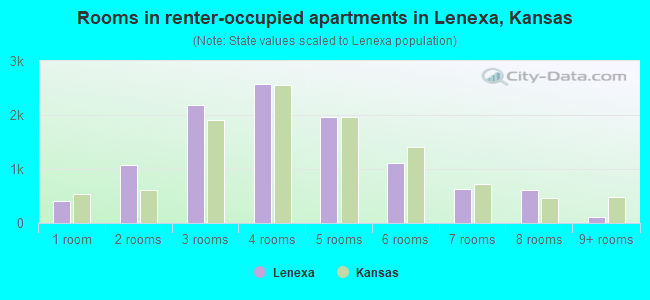
Rooms in renter-occupied apartments in Lenexa, Kansas
411 1 room 1,078 2 rooms 2,193 3 rooms 2,570 4 rooms 1,965 5 rooms 1,108 6 rooms 621 7 rooms 606 8 rooms 108 9+ rooms
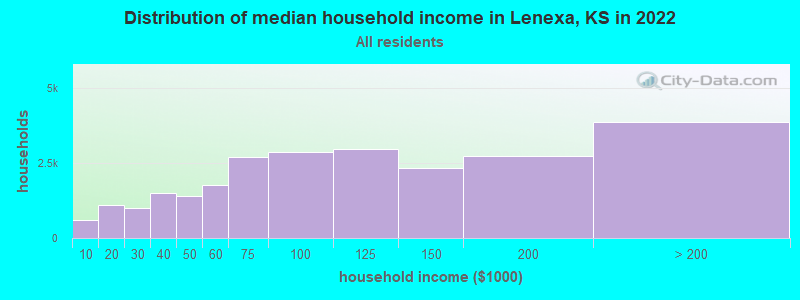
Lenexa, KS household income distribution 609 Less than $10,0001,096 $10,000 to $19,999998 $20,000 to $29,9991,515 $30,000 to $39,9991,415 $40,000 to $49,9991,759 $50,000 to $59,9992,721 $60,000 to $74,9992,888 $75,000 to $99,9992,978 $100,000 to $124,9992,330 $125,000 to $149,9992,735 $150,000 to $199,9993,876 $200,000 or more
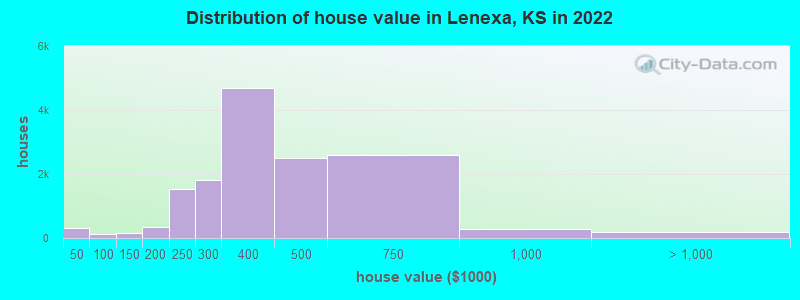
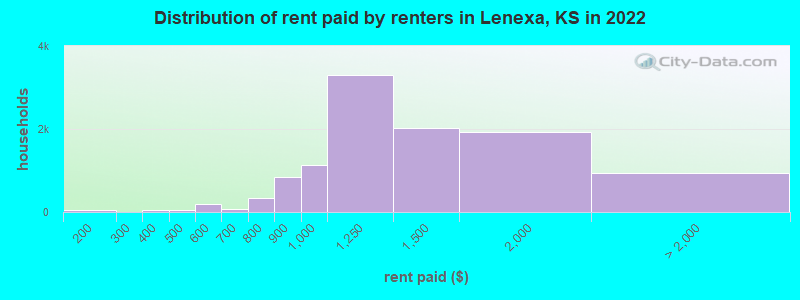
Home value of owner - occupied houses in 2022 in Lenexa, KS 45 Less than $10,0001 $10,000 to $14,99998 $15,000 to $19,99940 $20,000 to $24,9990 $25,000 to $29,99915 $30,000 to $34,99930 $35,000 to $39,99964 $40,000 to $49,99924 $50,000 to $59,99918 $80,000 to $89,9999 $90,000 to $99,99947 $100,000 to $124,999102 $125,000 to $149,999119 $150,000 to $174,999214 $175,000 to $199,9991,524 $200,000 to $249,9991,798 $250,000 to $299,9994,687 $300,000 to $399,9992,505 $400,000 to $499,9992,588 $500,000 to $749,999276 $750,000 to $999,999150 $1,000,000 to $1,499,99933 $2,000,000 or moreRent paid by renters in 2022 in Lenexa, KS 49 $150 to $1997 $200 to $24950 $350 to $39930 $400 to $4497 $450 to $49946 $500 to $549151 $550 to $59965 $600 to $64916 $650 to $699123 $700 to $749218 $750 to $799853 $800 to $8991,126 $900 to $9993,301 $1,000 to $1,2492,034 $1,250 to $1,4991,923 $1,500 to $1,999158 $2,000 to $2,49966 $2,500 to $2,999267 $3,000 to $3,499310 $3,500 or more142 No cash rent
Percentage of workers working in this county: 80.2%Number of people working at home: 8,397 (24.9% of all workers )
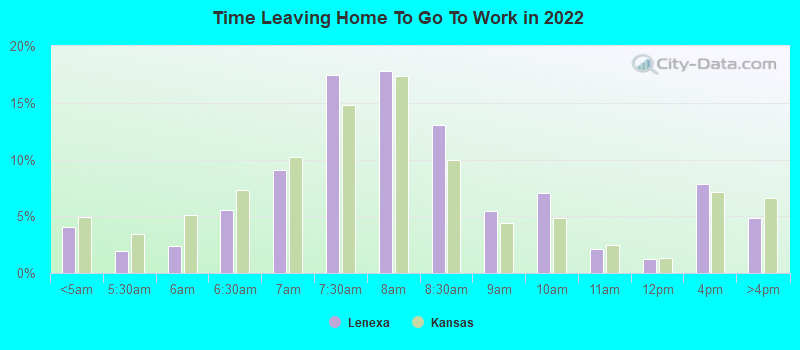
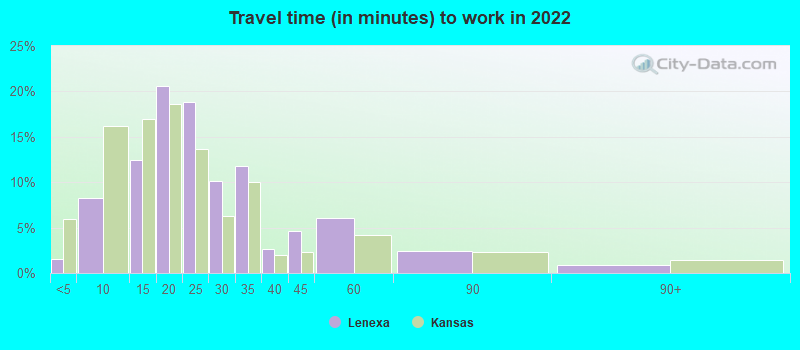
Travel time to work (commute)
Less than 5 minutes: 5305 to 9 minutes: 3,08110 to 14 minutes: 4,47715 to 19 minutes: 5,82120 to 24 minutes: 4,85425 to 29 minutes: 2,33530 to 34 minutes: 2,57935 to 39 minutes: 34340 to 44 minutes: 49245 to 59 minutes: 55860 to 89 minutes: 32090 or more minutes: 120
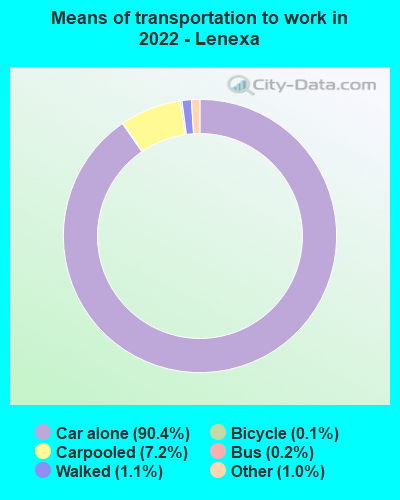
Means of transportation to work:
Drove a car alone: 42,932 (74.9%)Carpooled: 3,224 (5.6%)Bus : 169 (0.3%)Subway or elevated rail : 43 (0.1%)Taxi: 729 (1.3%)Bicycle: 46 (0.1%)Walked: 534 (0.9%)Worked at home: 8,397 (14.6%)
Unemployment by race in 2022
Unemployment rate for White non-Hispanic residents 2.6% Males1.1% FemalesUnemployment rate for Black residents 2.4% Males2.5% FemalesUnemployment rate for American Indian and Alaska Native residents 4.1% FemalesUnemployment rate for Asian residents 0.5% FemalesUnemployment rate for other race residents 2.6% FemalesUnemployment rate for two or more race residents 4.8% Males10.1% FemalesUnemployment rate for Hispanic or Latino residents 2.5% Males10.3% Females
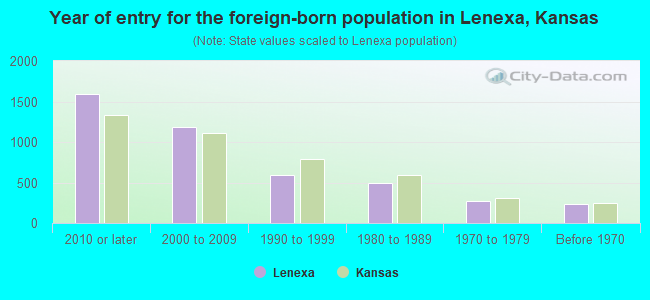
Year of entry for the foreign-born population in Lenexa, Kansas
1,592 2010 or later 1,189 2000 to 2009 587 1990 to 1999 499 1980 to 1989 277 1970 to 1979 229 Before 1970
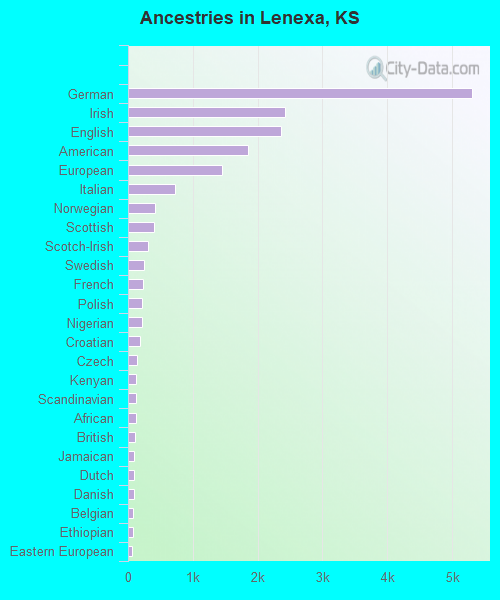
First ancestries reported:
German: 5,305 (20.1%)
Irish: 2,416 (9.2%)
English: 2,355 (8.9%)
American: 1,848 (7.0%)
European: 1,458 (5.5%)
Italian: 726 (2.8%)
Norwegian: 414 (1.6%)
Scottish: 396 (1.5%)
Scotch-Irish: 314 (1.2%)
Swedish: 242 (0.9%)
French: 225 (0.9%)
Polish: 221 (0.8%)
Nigerian: 220 (0.8%)
Croatian: 191 (0.7%)
Czech: 133 (0.5%)
Kenyan: 124 (0.5%)
Scandinavian: 124 (0.5%)
African: 119 (0.5%)
British: 101 (0.4%)
Jamaican: 92 (0.3%)
Dutch: 86 (0.3%)
Danish: 85 (0.3%)
Belgian: 77 (0.3%)
Ethiopian: 77 (0.3%)
Eastern European: 66 (0.3%)
Lebanese: 62 (0.2%)
Swiss: 60 (0.2%)
Welsh: 60 (0.2%)
Ukrainian: 53 (0.2%)
Northern European: 48 (0.2%)
Ghanaian: 42 (0.2%)
Hungarian: 41 (0.2%)
Slovak: 27 (0.1%)
Brazilian: 27 (0.1%)
Russian: 25 (0.09%)
Lithuanian: 21 (0.08%)
Iranian: 21 (0.08%)
Austrian: 19 (0.07%)
Arab: 16 (0.06%)
Luxembourger: 11 (0.04%)
Turkish: 11 (0.04%)
German Russian: 10 (0.04%)
Pennsylvania German: 7 (0.03%)
French Canadian: 7 (0.03%)
Slavic: 7 (0.03%)
Romanian: 6 (0.02%)
Slovene: 2 (0.01%)
Most common places of birth for foreign-born residents (%): Mexico Lenexa:
19.9% (868)Kansas:
39.2% (81,282)
India Lenexa:
10.5% (459)Kansas:
6.5% (13,547)
Kenya Lenexa:
5.6% (244)Kansas:
1.6% (3,322)
Guatemala Lenexa:
5.1% (224)Kansas:
3.5% (7,355)
China, excluding Hong Kong and Taiwan Lenexa:
4.5% (195)Kansas:
3.9% (8,053)
Ethiopia Lenexa:
4.4% (193)Kansas:
0.9% (1,901)
Vietnam Lenexa:
4.4% (192)Kansas:
5.5% (11,323)
Nigeria Lenexa:
3.6% (158)Kansas:
0.5% (1,058)
England Lenexa:
3.5% (151)Kansas:
0.8% (1,646)
Honduras Lenexa:
3.1% (136)Kansas:
1.6% (3,353)
Brazil Lenexa:
2.9% (128)Kansas:
0.9% (1,963)
Venezuela Lenexa:
2.8% (124)Kansas:
0.8% (1,695)
Taiwan Lenexa:
2.7% (119)Kansas:
0.7% (1,362)
Algeria Lenexa:
2.1% (90)Kansas:
0.2% (518)
Germany Lenexa:
2.0% (89)Kansas:
1.6% (3,349)
Iraq Lenexa:
1.7% (74)Kansas:
0.5% (1,022)
Laos Lenexa:
1.7% (72)Kansas:
1.5% (3,082)
Philippines Lenexa:
1.6% (68)Kansas:
2.6% (5,492)
Thailand Lenexa:
1.5% (67)Kansas:
0.8% (1,732)
Place of birth for U.S.-born residents:
This state: 26,126Other state: 27,486Northeast: 1,701Midwest: 16,514South: 5,282West: 4,029 84.8% of Lenexa residents lived in the same house 1 years ago.
Out of people who lived in different houses, 36.5% lived in this county.
Out of people who lived in different counties, 23.1% lived in Kansas.
Lenexa:
84.8%State average:
85.3%
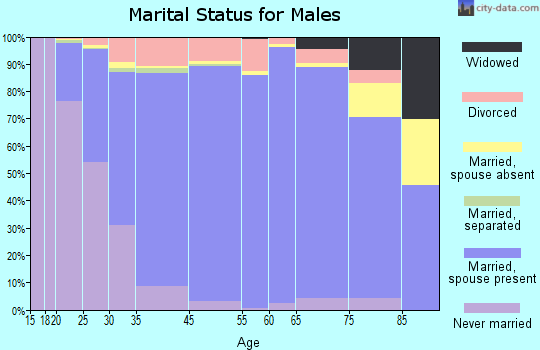
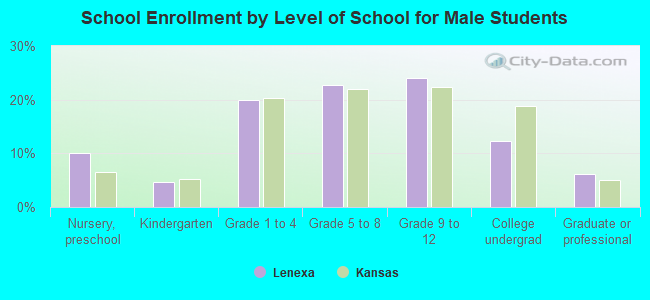
Education attainment for males 25 years and older:
No schooling: 189Nursery to 4th grade: 155th and 6th grade: 87th and 8th grade: 79th grade: 4010th grade: 3111th grade: 912th grade, no diploma: 173High school graduate (or equivalency): 2,892Less than 1 year of college: 1,357Some college more than 1 year, no degree: 2,234Associate degree: 1,345Bachelor's degree: 7,619Master's degree: 2,933Professional school degree: 921Doctorate degree: 485
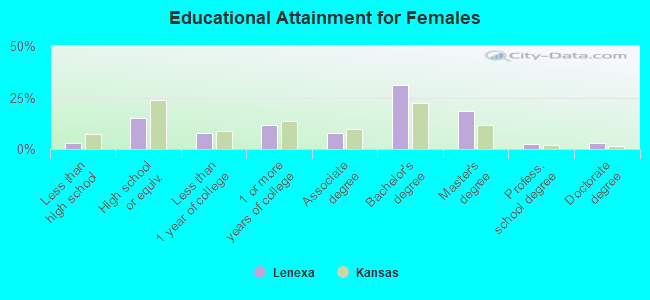
Education attainment for females 25 years and older:
No schooling: 166Nursery to 4th grade: 805th and 6th grade: 277th and 8th grade: 359th grade: 2310th grade: 1911th grade: 8312th grade, no diploma: 180High school graduate (or equivalency): 3,058Less than 1 year of college: 1,565Some college more than 1 year, no degree: 2,350Associate degree: 1,622Bachelor's degree: 6,392Master's degree: 3,739Professional school degree: 541Doctorate degree: 584
Housing units in structures:
One, detached: 14,721One, attached: 2,294Two: 2643 or 4: 9985 to 9: 2,20310 to 19: 2,36920 to 49: 1,62950 or more: 1,587Mobile homes: 25Housing units lacking complete plumbing facilities in 2022: 0.1%Housing units lacking complete kitchen facilities in 2022: 1.1%House/condo owner moved in on average 11 years ago
Renter moved in on average 1 years ago
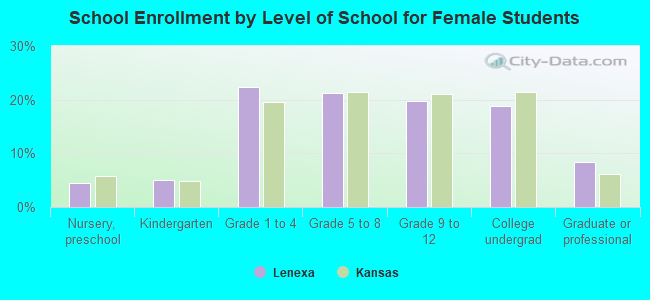
Private vs. public school enrollment:
Students in private schools in grades 1 to 8 (elementary and middle school): 1,094 Students in private schools in grades 9 to 12 (high school): 298 Students in private undergraduate colleges: 287