Leavenworth, KS (Kansas) Houses and Residents
| Leavenworth: | $177,813 |
| Kansas: | $206,600 |
Total population: 36,000 (Urban population: 35,137 (all inside urban clusters), Rural population: 167 (all nonfarm))
Houses: 14,993 (13,559 occupied: 6,884 owner occupied, 6,875 renter occupied)
| % of renters here: | 50% |
| State: | 32% |
Housing density: 638 houses/condos per square mile
Median price asked for vacant for-sale houses and condos in 2022: $920,401.
Median contract rent in 2022: $939 (lower quartile is $734, upper quartile is $1,610)
Median rent asked for vacant for-rent units in 2022: $756
Median gross rent in Leavenworth, KS in 2022: $1,178
Housing units in Leavenworth with a mortgage: 4,195 (159 second mortgage, 0 home equity loan, 161 both second mortgage and home equity loan)
Houses without a mortgage: 34
Median household income for houses/condos with a mortgage: $82,545
Median household income for apartments without a mortgage: $63,416
Median monthly housing costs: $983
Compare current foreclosures in Leavenworth, KS:
| Photo | Address | Area | Beds / Baths | Price | Details |
|---|---|---|---|---|---|

|
#1
N 3rd St
Leavenworth, KS 66048
|
2,520 sq. feet
|
2 baths 4 beds |
show details | |

|
#2
Pottawatomie St
Leavenworth, KS 66048
|
2,651 sq. feet
|
2 baths 5 beds |
show details | |

|
#3
Kiowa St
Leavenworth, KS 66048
|
1,512 sq. feet
|
2 baths 3 beds |
show details | |

|
#4
Francis Ave
Leavenworth, KS 66048
|
2,512 sq. feet
|
3 baths 4 beds |
show details | |

|
#5
Marjorie Cir
Leavenworth, KS 66048
|
2,044 sq. feet
|
2 baths 3 beds |
show details | |

|
#6
N Broadway St
Leavenworth, KS 66048
|
1,080 sq. feet
|
1 baths 3 beds |
show details | |

|
#7
S 14th St
Leavenworth, KS 66048
|
1,776 sq. feet
|
3 baths 3 beds |
show details | |

|
#8
Broadway Ter
Leavenworth, KS 66048
|
2,315 sq. feet
|
3 baths 4 beds |
show details | |

|
#9
S 16th St
Leavenworth, KS 66048
|
1,682 sq. feet
|
3 baths 3 beds |
show details | |

|
#10
Chestnut St
Leavenworth, KS 66048
|
1,470 sq. feet
|
1 baths 3 beds |
show details |
| Photo | Address | Area | Beds / Baths | Price | Details |
|---|---|---|---|---|---|

|
#11
Broadway Ter
Leavenworth, KS 66048
|
2,378 sq. feet
|
3 baths 4 beds |
show details | |

|
#12
Marion St
Leavenworth, KS 66048
|
1,323 sq. feet
|
2 baths 3 beds |
show details | |

|
#13
Osage St
Leavenworth, KS 66048
|
936 sq. feet
|
1 baths 2 beds |
show details | |

|
#14
S 5th St
Leavenworth, KS 66048
|
1,036 sq. feet
|
1 baths 2 beds |
show details | |

|
#15
Kelly Rd
Leavenworth, KS 66048
|
2,214 sq. feet
|
2 baths 3 beds |
show details | |

|
#16
Osage St
Leavenworth, KS 66048
|
1,736 sq. feet
|
1 baths 3 beds |
show details | |

|
#17
Folsom St
Leavenworth, KS 66048
|
1,862 sq. feet
|
2 baths 3 beds |
show details | |

|
#18
S 2nd St
Leavenworth, KS 66048
|
1,240 sq. feet
|
2 baths 2 beds |
show details | |

|
#19
Limit St
Leavenworth, KS 66048
|
3,026 sq. feet
|
2 baths 4 beds |
show details | |

|
#20
Dakota St
Leavenworth, KS 66048
|
1,223 sq. feet
|
1 baths 2 beds |
show details |
| Photo | Address | Area | Beds / Baths | Price | Details |
|---|---|---|---|---|---|

|
#21
Osage St
Leavenworth, KS 66048
|
1,072 sq. feet
|
1 baths 3 beds |
show details | |

|
#22
S 21st St
Leavenworth, KS 66048
|
1,716 sq. feet
|
3 baths 4 beds |
show details | |

|
#23
Western St
Leavenworth, KS 66048
|
1,409 sq. feet
|
1 baths 3 beds |
show details | |

|
#24
Dakota St
Leavenworth, KS 66048
|
1,134 sq. feet
|
1 baths 3 beds |
show details | |

|
#25
5th Ave
Leavenworth, KS 66048
|
1,908 sq. feet
|
1 baths 3 beds |
show details | |

|
#26
Dakota St
Leavenworth, KS 66048
|
2,253 sq. feet
|
3 baths 4 beds |
show details | |

|
#27
S 21st Ct
Leavenworth, KS 66048
|
1,956 sq. feet
|
3 baths 4 beds |
show details | |

|
#28
N 14th St
Leavenworth, KS 66048
|
1,555 sq. feet
|
2 baths 3 beds |
show details | |

|
#29
Pawnee St
Leavenworth, KS 66048
|
1,165 sq. feet
|
1 baths 2 beds |
show details | |

|
#30
Spruce St
Leavenworth, KS 66048
|
1,941 sq. feet
|
2 baths 4 beds |
show details |
| Photo | Address | Area | Beds / Baths | Price | Details |
|---|---|---|---|---|---|

|
#31
Evergreen St
Leavenworth, KS 66048
|
1,629 sq. feet
|
2 baths 4 beds |
show details | |

|
#32
Delaware St
Leavenworth, KS 66048
|
744 sq. feet
|
1 baths 2 beds |
show details | |

|
#33
Lakeview Cir
Leavenworth, KS 66048
|
2,215 sq. feet
|
2 baths 3 beds |
show details | |

|
#34
Westwood Dr
Leavenworth, KS 66048
|
2,374 sq. feet
|
3 baths 3 beds |
show details | |

|
#35
Central St
Leavenworth, KS 66048
|
1,254 sq. feet
|
2 baths 3 beds |
show details | |

|
#36
Michigan Ave
Leavenworth, KS 66048
|
- sq. feet
|
- baths - beds |
show details | |

|
#37
Casey Ct Apt A
Leavenworth, KS 66048
|
- sq. feet
|
- baths - beds |
show details | |

|
#38
Rose St
Leavenworth, KS 66048
|
- sq. feet
|
- baths - beds |
show details | |

|
#39
S 2nd St
Leavenworth, KS 66048
|
- sq. feet
|
- baths - beds |
show details | |

|
#40
Chestnut St
Leavenworth, KS 66048
|
- sq. feet
|
- baths - beds |
show details |
| Photo | Address | Area | Beds / Baths | Price | Details |
|---|---|---|---|---|---|

|
#41
N 18th St
Leavenworth, KS 66048
|
- sq. feet
|
- baths - beds |
show details | |

|
#42
Seneca St Apt B
Leavenworth, KS 66048
|
- sq. feet
|
- baths - beds |
show details | |

|
#43
3rd Ave
Leavenworth, KS 66048
|
- sq. feet
|
- baths - beds |
show details | |

|
#44
Silver Leaf St Apt C
Leavenworth, KS 66048
|
- sq. feet
|
- baths - beds |
show details | |

|
#45
S 5th St
Leavenworth, KS 66048
|
- sq. feet
|
- baths - beds |
show details | |

|
#46
Shawnee St Apt 309
Leavenworth, KS 66048
|
- sq. feet
|
- baths - beds |
show details | |

|
#47
Pottawatomie St
Leavenworth, KS 66048
|
- sq. feet
|
- baths - beds |
show details | |

|
#48
Spruce St Apt A
Leavenworth, KS 66048
|
- sq. feet
|
- baths - beds |
show details | |

|
#49
Seneca St Apt C
Leavenworth, KS 66048
|
- sq. feet
|
- baths - beds |
show details | |

|
Check over 1 million property listings on Foreclosure.com!
|
browse all offers | |||

Latest news about housing in Leavenworth, KS collected exclusively by city-data.com from local newspapers, TV, and radio stations

 | 1 bedroom apartment electricity consumption/bill (9 replies) |
| Moving to Kansas and then moving out of mom's house (11 replies) |
| Possible Kansas relocation (17 replies) |
| Topeka vs. Wichita (49 replies) |
| Kansas Job Losses (390 replies) |
| If You Live In KS and Pay Property Tax (25 replies) |

Median year apartment built: 1970
Household type by relationship:
Households: 37,574- Male householders: 7,222 (2,029 living alone), Female householders: 6,198 (2,228 living alone)
6,490 spouses (6,417 opposite-sex spouses), 1,022 unmarried partners, (999 opposite-sex unmarried partners), 9,004 children (8,364 natural, 371 adopted, 267 stepchildren), 1,080 grandchildren, 315 brothers or sisters, 332 parents, 111 foster children, 660 other relatives, 1,031 non-relatives
- In group quarters: 4,103
Size of family households: 3,356 2-persons, 1,460 3-persons, 1,595 4-persons, 718 5-persons, 681 6-persons, 166 7-or-more-persons.
Size of nonfamily households: 4,997 1-person, 1,041 2-persons, 38 3-persons, 25 4-persons.
5,706 married couples with children.
1,312 single-parent households (567 men, 745 women).
93.4% of residents of Leavenworth speak English at home.
3.1% of residents speak Spanish at home (73% speak English very well, 21% speak English well, 4% speak English not well, 2% don't speak English at all).
1.5% of residents speak other Indo-European language at home (91% speak English very well, 9% speak English well).
1.4% of residents speak Asian or Pacific Island language at home (70% speak English very well, 22% speak English well, 7% speak English not well, 1% don't speak English at all).
0.3% of residents speak other language at home (94% speak English very well, 6% speak English well).
Foreign born population: 1,823 (4.9%)
(32.6% of them are naturalized citizens)
| Here: | 6.5 |
| State: | 6.9 |
| Here: | 5.7 |
| State: | 4.4 |

- Bedrooms in owner-occupied houses and condos in Leavenworth, Kansas
- 10no bedroom
- 1201 bedroom
- 1,3042 bedrooms
- 2,9773 bedrooms
- 1,7744 bedrooms
- 6995+ bedrooms

- Bedrooms in renter-occupied apartments in Leavenworth, Kansas
- 205no bedroom
- 1,6211 bedroom
- 1,5332 bedrooms
- 2,0503 bedrooms
- 1,2994 bedrooms
- 1685+ bedrooms

- Cars and other vehicles available in Leavenworth in owner-occupied houses/condos
- 143no vehicle
- 1,6521 vehicle
- 3,0182 vehicles
- 1,5893 vehicles
- 3374 vehicles
- 1465+ vehicles

- Cars and other vehicles available in Leavenworth in renter-occupied apartments
- 1,007no vehicle
- 3,0151 vehicle
- 2,1412 vehicles
- 3733 vehicles
- 3064 vehicles
- 345+ vehicles

- Rooms in owner-occupied houses in Leavenworth, Kansas
- 101 room
- 02 rooms
- 1053 rooms
- 7014 rooms
- 9625 rooms
- 1,4206 rooms
- 1,0087 rooms
- 1,1428 rooms
- 1,5369+ rooms

- Rooms in renter-occupied apartments in Leavenworth, Kansas
- 1921 room
- 4932 rooms
- 7253 rooms
- 1,1694 rooms
- 1,3485 rooms
- 8676 rooms
- 1,0927 rooms
- 6348 rooms
- 3569+ rooms


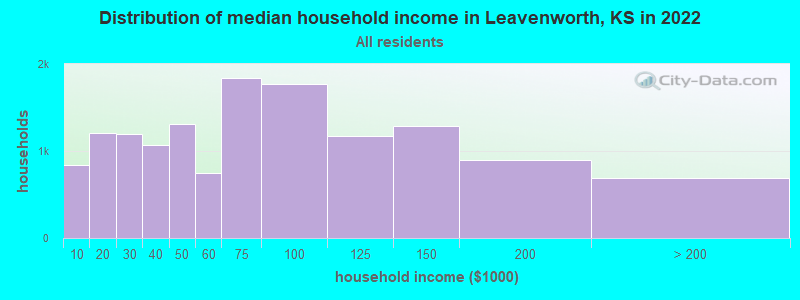
Leavenworth, KS household income distribution

- 844Less than $10,000
- 1,207$10,000 to $19,999
- 1,194$20,000 to $29,999
- 1,068$30,000 to $39,999
- 1,311$40,000 to $49,999
- 748$50,000 to $59,999
- 1,839$60,000 to $74,999
- 1,768$75,000 to $99,999
- 1,177$100,000 to $124,999
- 1,283$125,000 to $149,999
- 902$150,000 to $199,999
- 689$200,000 or more
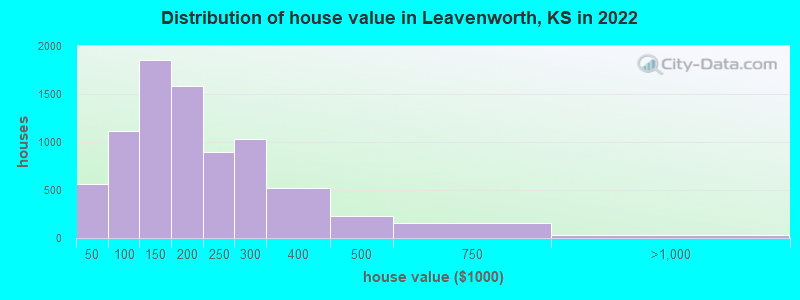
Home value of owner - occupied houses in 2022 in Leavenworth, KS
-
- 106Less than $10,000
- 48$10,000 to $14,999
- 63$15,000 to $19,999
- 45$20,000 to $24,999
- 29$25,000 to $29,999
- 36$30,000 to $34,999
- 20$35,000 to $39,999
- 210$40,000 to $49,999
- 141$50,000 to $59,999
- 147$60,000 to $69,999
- 233$70,000 to $79,999
- 120$80,000 to $89,999
- 262$90,000 to $99,999
- 619$100,000 to $124,999
- 1,234$125,000 to $149,999
- 1,155$150,000 to $174,999
- 424$175,000 to $199,999
- 899$200,000 to $249,999
- 1,032$250,000 to $299,999
- 517$300,000 to $399,999
- 226$400,000 to $499,999
- 155$500,000 to $749,999
- 23$750,000 to $999,999
- 10$1,000,000 to $1,499,999
- 1$2,000,000 or more
Rent paid by renters in 2022 in Leavenworth, KS
-
- 18Less than $100
- 23$100 to $149
- 29$150 to $199
- 55$200 to $249
- 49$250 to $299
- 133$300 to $349
- 159$350 to $399
- 32$400 to $449
- 201$450 to $499
- 115$500 to $549
- 295$550 to $599
- 269$600 to $649
- 643$650 to $699
- 263$700 to $749
- 547$750 to $799
- 494$800 to $899
- 439$900 to $999
- 551$1,000 to $1,249
- 254$1,250 to $1,499
- 1,146$1,500 to $1,999
- 399$2,000 to $2,499
- 12$2,500 to $2,999
- 15$3,500 or more
- 430No cash rent


Percentage of workers working in this county: 76.5%
Number of people working at home: 1,447 (9.1% of all workers)
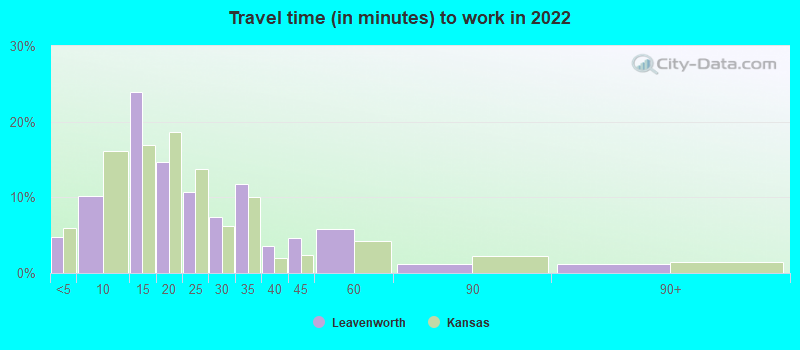
Travel time to work (commute)
- Less than 5 minutes: 956
- 5 to 9 minutes: 1,864
- 10 to 14 minutes: 4,168
- 15 to 19 minutes: 2,486
- 20 to 24 minutes: 1,152
- 25 to 29 minutes: 447
- 30 to 34 minutes: 1,277
- 35 to 39 minutes: 426
- 40 to 44 minutes: 313
- 45 to 59 minutes: 946
- 60 to 89 minutes: 426
- 90 or more minutes: 36
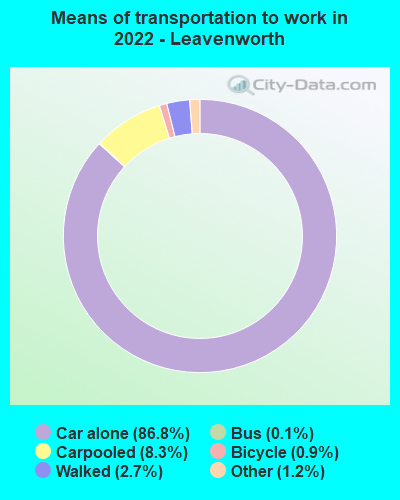
Means of transportation to work:
- Drove a car alone: 16,477 (79.4%)
- Carpooled: 1,595 (7.7%)
- Bus: 30 (0.1%)
- Taxi: 267 (1.3%)
- Bicycle: 171 (0.8%)
- Walked: 521 (2.5%)
- Worked at home: 1,447 (7.0%)

- Unemployment by race in 2022
- Unemployment rate for White non-Hispanic residents
- 3.0%Males
- 2.7%Females
- Unemployment rate for Black residents
- 5.0%Males
- Unemployment rate for Asian residents
- 10.4%Females
- Unemployment rate for other race residents
- 33.3%Males
- Unemployment rate for two or more race residents
- 1.4%Females
- Unemployment rate for Hispanic or Latino residents
- 6.6%Males
- 2.0%Females

- Year of entry for the foreign-born population in Leavenworth, Kansas
- 4032010 or later
- 2782000 to 2009
- 1361990 to 1999
- 2221980 to 1989
- 1711970 to 1979
- 270Before 1970
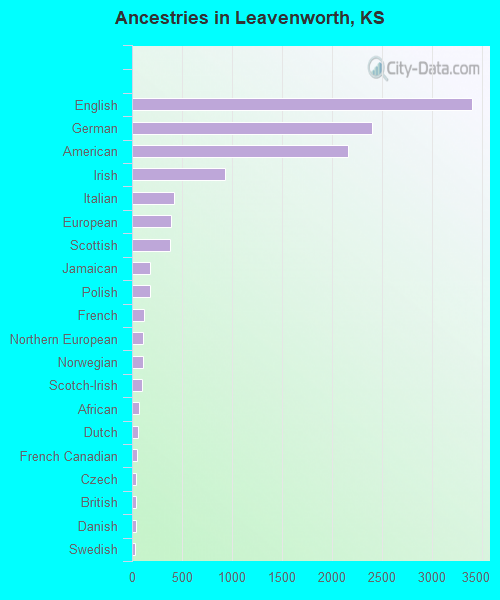
First ancestries reported:
- English: 3,404 (21.6%)
- German: 2,398 (15.2%)
- American: 2,165 (13.7%)
- Irish: 929 (5.9%)
- Italian: 422 (2.7%)
- European: 390 (2.5%)
- Scottish: 381 (2.4%)
- Jamaican: 182 (1.2%)
- Polish: 176 (1.1%)
- French: 117 (0.7%)
- Northern European: 114 (0.7%)
- Norwegian: 106 (0.7%)
- Scotch-Irish: 98 (0.6%)
- African: 73 (0.5%)
- Dutch: 64 (0.4%)
- French Canadian: 49 (0.3%)
- Czech: 45 (0.3%)
- British: 42 (0.3%)
- Danish: 36 (0.2%)
- Swedish: 34 (0.2%)
- Scandinavian: 30 (0.2%)
- Welsh: 28 (0.2%)
- Finnish: 26 (0.2%)
- Jordanian: 24 (0.2%)
- Portuguese: 22 (0.1%)
- Moroccan: 21 (0.1%)
- Eastern European: 20 (0.1%)
- Russian: 20 (0.1%)
- Slovak: 20 (0.1%)
- Canadian: 19 (0.1%)
- Haitian: 19 (0.1%)
- Ukrainian: 14 (0.09%)
- Croatian: 10 (0.06%)
- Hungarian: 8 (0.05%)
- Romanian: 6 (0.04%)
- Nigerian: 6 (0.04%)
- Armenian: 5 (0.03%)
- Austrian: 5 (0.03%)
- Brazilian: 5 (0.03%)
- Iranian: 5 (0.03%)
Most common places of birth for foreign-born residents (%):
| Leavenworth: | 24.7% (277) |
| Kansas: | 1.6% (3,345) |
| Leavenworth: | 9.4% (106) |
| Kansas: | 1.6% (3,349) |
| Leavenworth: | 7.6% (85) |
| Kansas: | 39.2% (81,282) |
| Leavenworth: | 5.8% (65) |
| Kansas: | 2.2% (4,488) |
| Leavenworth: | 5.7% (64) |
| Kansas: | 0.9% (1,963) |
| Leavenworth: | 4.6% (52) |
| Kansas: | 0.8% (1,732) |
| Leavenworth: | 3.2% (36) |
| Kansas: | 0.3% (651) |
| Leavenworth: | 3.1% (35) |
| Kansas: | 0.2% (364) |
| Leavenworth: | 2.7% (30) |
| Kansas: | 5.5% (11,323) |
| Leavenworth: | 2.3% (26) |
| Kansas: | 0.2% (335) |
| Leavenworth: | 2.3% (26) |
| Kansas: | 0.7% (1,520) |
| Leavenworth: | 2.2% (25) |
| Kansas: | 0.8% (1,646) |
| Leavenworth: | 2.2% (25) |
| Kansas: | 1.2% (2,585) |
| Leavenworth: | 1.6% (18) |
| Kansas: | 0.5% (1,058) |
| Leavenworth: | 1.6% (18) |
| Kansas: | 0.4% (770) |
| Leavenworth: | 1.6% (18) |
| Kansas: | 0.2% (429) |
| Leavenworth: | 1.5% (17) |
| Kansas: | 0.1% (292) |
Place of birth for U.S.-born residents:
- This state: 15,620
- Other state: 17,951
- Northeast: 2,117
- Midwest: 6,652
- South: 5,132
- West: 3,704
73.4% of Leavenworth residents lived in the same house 1 years ago.
Out of people who lived in different houses, 20.2% lived in this county.
Out of people who lived in different counties, 40.7% lived in Kansas.
| Leavenworth: | 73.4% |
| State average: | 85.3% |
Education attainment for males 25 years and older:
- No schooling: 82
- Nursery to 4th grade: 7
- 5th and 6th grade: 4
- 7th and 8th grade: 281
- 9th grade: 115
- 10th grade: 160
- 11th grade: 274
- 12th grade, no diploma: 158
- High school graduate (or equivalency): 4,256
- Less than 1 year of college: 1,044
- Some college more than 1 year, no degree: 1,941
- Associate degree: 1,068
- Bachelor's degree: 2,629
- Master's degree: 1,625
- Professional school degree: 153
- Doctorate degree: 379

Education attainment for females 25 years and older:
- No schooling: 35
- Nursery to 4th grade: 0
- 5th and 6th grade: 11
- 7th and 8th grade: 91
- 9th grade: 62
- 10th grade: 51
- 11th grade: 230
- 12th grade, no diploma: 120
- High school graduate (or equivalency): 2,375
- Less than 1 year of college: 902
- Some college more than 1 year, no degree: 1,484
- Associate degree: 1,540
- Bachelor's degree: 2,065
- Master's degree: 1,565
- Professional school degree: 42
- Doctorate degree: 84


Housing units in structures:
- One, detached: 9,828
- One, attached: 1,750
- Two: 516
- 3 or 4: 636
- 5 to 9: 1,002
- 10 to 19: 448
- 20 to 49: 275
- 50 or more: 333
- Mobile homes: 188
- Boats, RVs, vans, etc.: 13
Housing units lacking complete kitchen facilities in 2022: 2.8%
House/condo owner moved in on average 14 years ago
Renter moved in on average 0 years ago

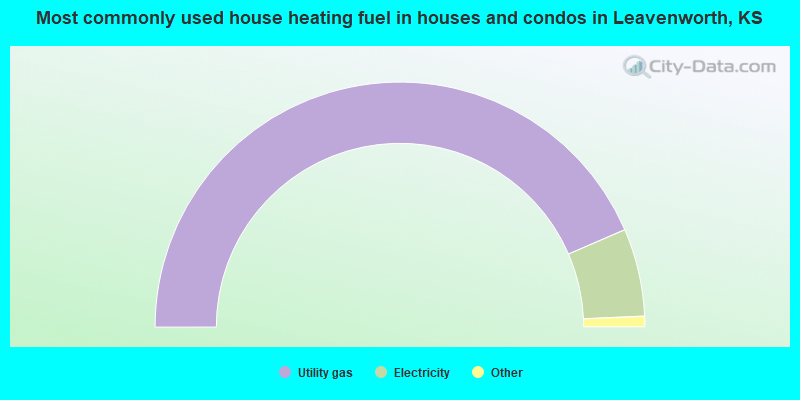
- 87.0%Utility gas
- 11.6%Electricity
- 1.1%Bottled, tank, or LP gas
- 0.3%No fuel used
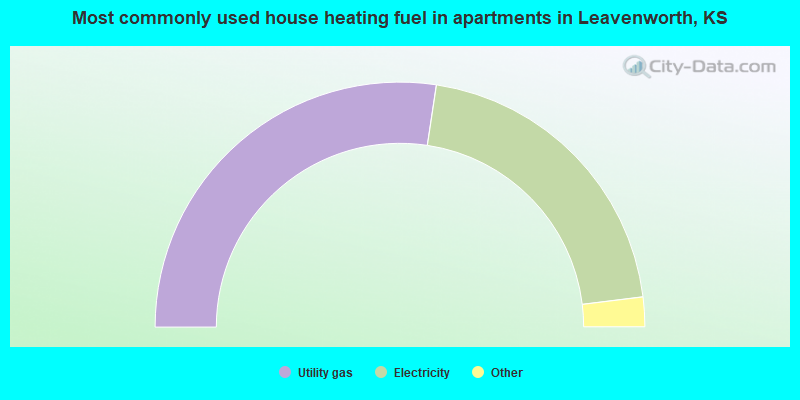
- 54.7%Utility gas
- 41.3%Electricity
- 2.5%No fuel used
- 1.1%Bottled, tank, or LP gas
- 0.3%Coal or coke
Private vs. public school enrollment:
| Here: | 16.4% |
| Kansas: | 14.1% |
| Here: | 11.6% |
| Kansas: | 10.8% |
| Here: | 32.3% |
| Kansas: | 15.4% |


