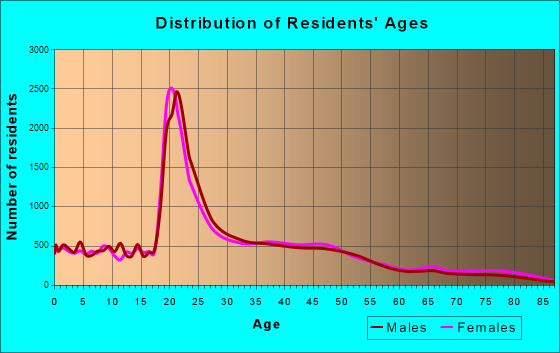
Lawrence, KS (Kansas) Houses and Residents
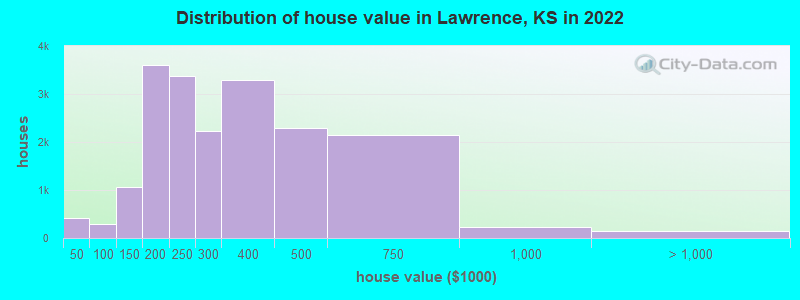
Estimated median house or condo value in 2022: $291,100 (it was $112,800 in 2000 )
Lawrence:
$291,100Kansas:
$206,600
Lower value quartile - upper value quartile: $195,000 - $394,300Mean price in 2022: Detached houses: $345,774 Here:
$345,774State:
$264,181
Townhouses or other attached units: $242,673 Here:
$242,673State:
$219,178
In 2-unit structures: $178,719 Here:
$178,719State:
$190,919
In 3-to-4-unit structures: $160,335 Here:
$160,335State:
$161,859
In 5-or-more-unit structures: $139,551 Here:
$139,551State:
$267,030
Mobile homes: $35,061 Here:
$35,061State:
$74,712
Total population: 92,763 (Urban population: 79,445, Rural population: 638 (all nonfarm) )
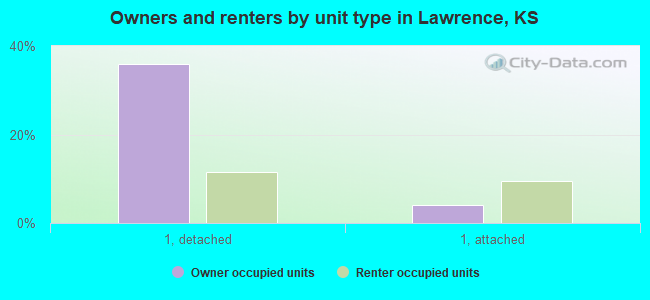
Houses: 44,318 (41,109 occupied: 18,564 owner occupied, 22,545 renter occupied )
% of renters here:
55%State:
32%
Housing density: 1,577 houses/condos per square mile
Median price asked for vacant for-sale houses and condos in 2022: $799,112.
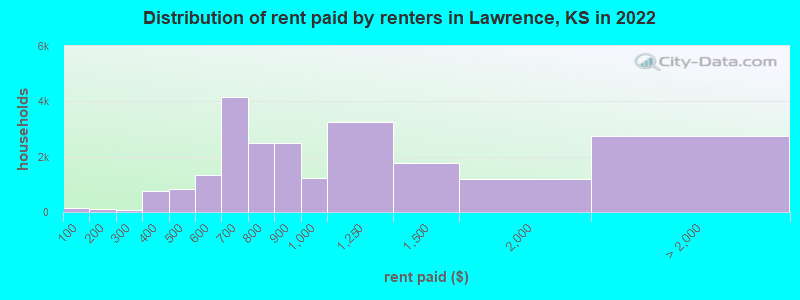
Median contract rent in 2022: $836 (lower quartile is $649, upper quartile is $1,200)
Median rent asked for vacant for-rent units in 2022: $908
Median gross rent in Lawrence, KS in 2022: $996
Housing units in Lawrence with a mortgage: 12,288 (1,686 second mortgage, 73 home equity loan, 1,238 both second mortgage and home equity loan )Houses without a mortgage: 283
Median household income for houses/condos with a mortgage: $104,162
Median household income for apartments without a mortgage: $64,732
Median monthly housing costs: $1,118
Data:
Median house or condo value ($)
Median house or condo value ($ change since 2000)
Median house or condo value ($) - White
Median house or condo value ($) - Black or African American
Median house or condo value ($) - Asian
Median house or condo value ($) - Hispanic or Latino
Median house or condo value ($) - American Indian and Alaska Native
Median house or condo value ($) - Multirace
Median house or condo value ($) - Other Race
Median price asked for mobile homes ($)
Household density (households per square mile)
Mean house or condo value by units in structure - 1, detached ($)
Mean house or condo value by units in structure - 1, attached ($)
Mean house or condo value by units in structure - 2 ($)
Mean house or condo value by units in structure by units in structure - 3 or 4 ($)
Mean house or condo value by units in structure - 5 or more ($)
Mean house or condo value by units in structure - Boat, RV, van, etc. ($)
Mean house or condo value by units in structure - Mobile home ($)
Median contract rent ($)
Median contract rent - Lower quartile ($)
Median contract rent - Upper quartile ($)
Median gross rent ($)
Urban houses (%)
Rural houses (%)
Houses occupied (%)
Houses occupied (% change since 2000)
Houses owner occupied (%)
Houses owner occupied (% change since 2000)
Houses renter occupied (%)
Houses renter occupied (% change since 2000)
Vacant housing units - For rent (%)
Vacant housing units - For rent (% change since 2000)
Vacant housing units - For sale only (%)
Vacant housing units - For sale only (% change since 2000)
Vacant housing units - Rented or sold, not occupied (%)
Vacant housing units - Rented or sold, not occupied (% change since 2000)
Vacant housing units - For seasonal, recreational, or occasional use (%)
Vacant housing units - For seasonal, recreational, or occasional use (% change since 2000)
Vacant housing units - For migrant workers (%)
Vacant housing units - For migrant workers (% change since 2000)
Vacant housing units - Other vacant (%)
Vacant housing units - Other vacant (% change since 2000)
Median monthly housing costs ($)
Median household income for houses/condos with a mortgage ($)
Median household income for houses/condos without a mortgage ($)
Median household income ($)
Median household income ($) - White
Median household income ($) - Black or African American
Median household income ($) - Asian
Median household income ($) - Hispanic or Latino
Median household income ($) - American Indian and Alaska Native
Median household income ($) - Multirace
Median household income ($) - Other Race
Mortgage status - with mortgage (%)
Mortgage status - with second mortgage (%)
Mortgage status - with home equity loan (%)
Mortgage status - with both second mortgage and home equity loan (%)
Mortgage status - without a mortgage (%)
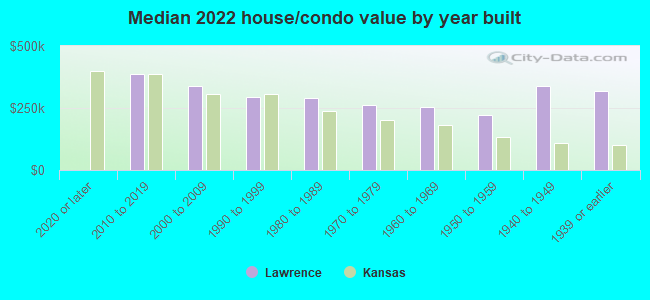
Median year house/condo built
Median year apartment built
Household type by relationship - Male householder living alone (%)
Household type by relationship - Male householder not living alone (%)
Household type by relationship - Female householder living alone (%)
Household type by relationship - Female householder not living alone (%)
Household type by relationship - Opposite-Sex spouse (%)
Household type by relationship - Same-Sex spouse (%)
Household type by relationship - Opposite-Sex unmarried partner (%)
Household type by relationship - Same-Sex unmarried partner (%)
Household type by relationship - In group quarters (%)
Size of family households - 2-person household (%)
Size of family households - 3-person household (%)
Size of family households - 4-person household (%)
Size of family households - 5-person household (%)
Size of family households - 6-person household (%)
Size of family households - 7-or-more-person household (%)
Size of nonfamily households - 1-person household (%)
Size of nonfamily households - 2-person household (%)
Size of nonfamily households - 3-person household (%)
Size of nonfamily households - 4-person household (%)
Size of nonfamily households - 5-person household (%)
Size of nonfamily households - 6-person household (%)
Size of nonfamily households - 7-or-moreperson household (%)
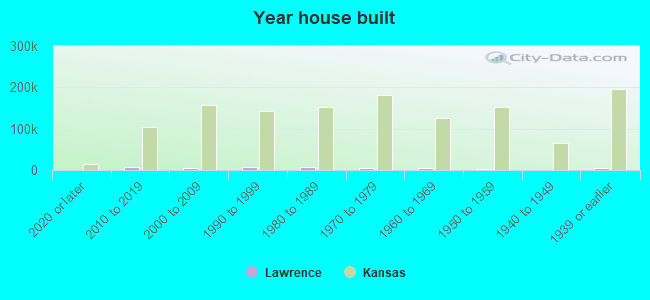
Year house built - Built 2010 or later (%)
Year house built - Built 2000 to 2009 (%)
Year house built - Built 1990 to 1999 (%)
Year house built - Built 1980 to 1989 (%)
Year house built - Built 1970 to 1979 (%)
Year house built - Built 1960 to 1969 (%)
Year house built - Built 1950 to 1959 (%)
Year house built - Built 1940 to 1949 (%)
Year house built - Built 1939 or earlier (%)
Median number of rooms in houses and condos
Median number of rooms in apartments
Median number of bedrooms in owner occupied houses
Mean number of bedrooms in owner occupied houses
Median number of bedrooms in renter occupied houses
Mean number of bedrooms in renter occupied houses
Median number of vehichles in owner occupied houses
Mean number of vehichles in owner occupied houses
Median number of vehichles in renter occupied houses
Mean number of vehichles in renter occupied houses
Rooms in owner-occupied houses - 1 room (%)
Rooms in owner-occupied houses - 2 rooms (%)
Rooms in owner-occupied houses - 3 rooms (%)
Rooms in owner-occupied houses - 4 rooms (%)
Rooms in owner-occupied houses - 5 rooms (%)
Rooms in owner-occupied houses - 6 rooms (%)
Rooms in owner-occupied houses - 7 rooms (%)
Rooms in owner-occupied houses - 8 rooms (%)
Rooms in owner-occupied houses - 9+ rooms (%)
Rooms in renter-occupied houses - 1 room (%)
Rooms in renter-occupied houses - 2 rooms (%)
Rooms in renter-occupied houses - 3 rooms (%)
Rooms in renter-occupied houses - 4 rooms (%)
Rooms in renter-occupied houses - 5 rooms (%)
Rooms in renter-occupied houses - 6 rooms (%)
Rooms in renter-occupied houses - 7 rooms (%)
Rooms in renter-occupied houses - 8 rooms (%)
Rooms in renter-occupied houses - 9+ rooms (%)
Bedrooms in owner-occupied houses - no bedrooms (%)
Bedrooms in owner-occupied houses - 1 bedroom (%)
Bedrooms in owner-occupied houses - 2 bedrooms (%)
Bedrooms in owner-occupied houses - 3 bedrooms (%)
Bedrooms in owner-occupied houses - 4 bedrooms (%)
Bedrooms in owner-occupied houses - 5+ bedrooms (%)
Bedrooms in renter-occupied houses - no bedrooms (%)
Bedrooms in renter-occupied houses - 1 bedroom (%)
Bedrooms in renter-occupied houses - 2 bedrooms (%)
Bedrooms in renter-occupied houses - 3 bedrooms (%)
Bedrooms in renter-occupied houses - 4 bedrooms (%)
Bedrooms in renter-occupied houses - 5+ bedrooms (%)
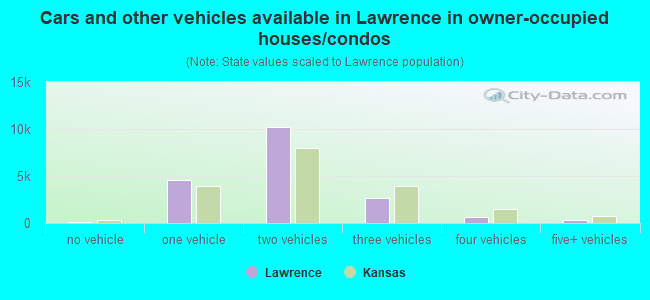
Vehicles available in owner-occupied houses - no vehicle available (%)
Vehicles available in owner-occupied houses - 1 vehicle available(%)
Vehicles available in owner-occupied houses - 2 Vehicles available (%)
Vehicles available in owner-occupied houses - 3 Vehicles available (%)
Vehicles available in owner-occupied houses - 4 Vehicles available (%)
Vehicles available in owner-occupied houses - 5+ Vehicles available (%)
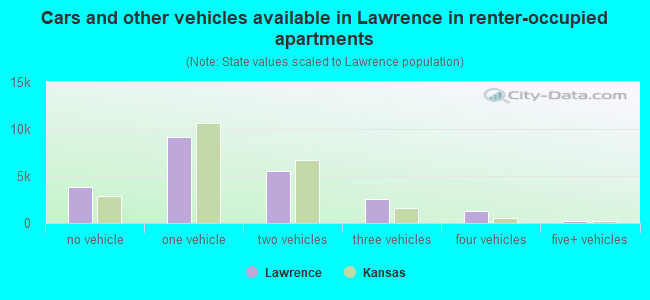
Vehicles available in renter-occupied houses - no vehicle available (%)
Vehicles available in renter-occupied houses - 1 vehicle available (%)
Vehicles available in renter-occupied houses - 2 Vehicles available (%)
Vehicles available in renter-occupied houses - 3 Vehicles available (%)
Vehicles available in renter-occupied houses - 4 Vehicles available (%)
Vehicles available in renter-occupied houses - 5+ Vehicles available (%)
Housing units in structures - 1, detached (%)
Housing units in structures - 1, attached (%)
Housing units in structures - 2 (%)
Housing units in structures - 3 or 4 (%)
Housing units in structures - 5 to 9 (%)
Housing units in structures - 10 to 19 (%)
Housing units in structures - 20 to 49 (%)
Housing units in structures - 50 or more (%)
Housing units in structures - Mobile home (%)
Housing units in structures - Boat, RV, van, etc. (%)
Housing units in structures - Owners - 1, detached (%)
Housing units in structures - Owners - 1, attached (%)
Housing units in structures - Owners - 2 (%)
Housing units in structures - Owners - 3 or 4 (%)
Housing units in structures - Owners - 5 to 9 (%)
Housing units in structures - Owners - 10 to 19 (%)
Housing units in structures - Owners - 20 to 49 (%)
Housing units in structures - Owners - 50 or more (%)
Housing units in structures - Owners - Mobile home (%)
Housing units in structures - Owners - Boat, RV, van, etc. (%)
Housing units in structures - Renters - 1, detached (%)
Housing units in structures - Renters - 1, attached (%)
Housing units in structures - Renters - 2 (%)
Housing units in structures - Renters - 3 or 4 (%)
Housing units in structures - Renters - 5 to 9 (%)
Housing units in structures - Renters - 10 to 19 (%)
Housing units in structures - Renters - 20 to 49 (%)
Housing units in structures - Renters - 50 or more (%)
Housing units in structures - Renters - Mobile home (%)
Housing units in structures - Renters - Boat, RV, van, etc. (%)
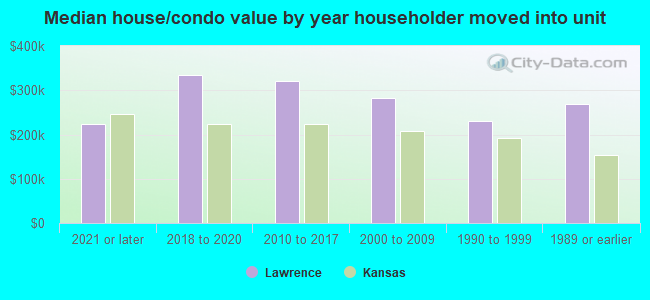
House/condo owner moved in on average (years ago)
Renter moved in on average (years ago)
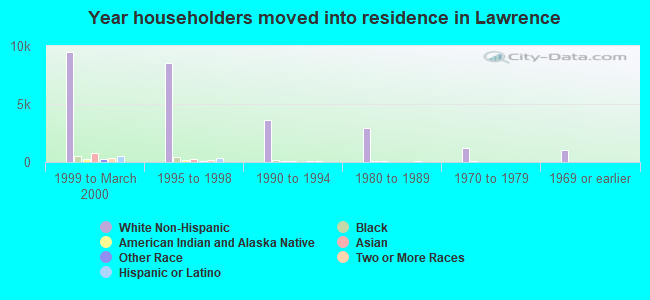
Year householder moved into unit - Moved in 1999 to March 2000 (%)
Year householder moved into unit - Moved in 1999 to March 2000 (%) - White
Year householder moved into unit - Moved in 1999 to March 2000 (%) - Black or African American
Year householder moved into unit - Moved in 1999 to March 2000 (%) - Asian
Year householder moved into unit - Moved in 1999 to March 2000 (%) - Hispanic or Latino
Year householder moved into unit - Moved in 1999 to March 2000 (%) - American Indian and Alaska Native
Year householder moved into unit - Moved in 1999 to March 2000 (%) - Multirace
Year householder moved into unit - Moved in 1999 to March 2000 (%) - Other Race
Year householder moved into unit - Moved in 1995 to 1998 (%)
Year householder moved into unit - Moved in 1995 to 1998 (%) - White
Year householder moved into unit - Moved in 1995 to 1998 (%) - Black or African American
Year householder moved into unit - Moved in 1995 to 1998 (%) - Asian
Year householder moved into unit - Moved in 1995 to 1998 (%) - Hispanic or Latino
Year householder moved into unit - Moved in 1995 to 1998 (%) - American Indian and Alaska Native
Year householder moved into unit - Moved in 1995 to 1998 (%) - Multirace
Year householder moved into unit - Moved in 1995 to 1998 (%) - Other Race
Year householder moved into unit - Moved in 1990 to 1994 (%)
Year householder moved into unit - Moved in 1990 to 1994 (%) - White
Year householder moved into unit - Moved in 1990 to 1994 (%) - Black or African American
Year householder moved into unit - Moved in 1990 to 1994 (%) - Asian
Year householder moved into unit - Moved in 1990 to 1994 (%) - Hispanic or Latino
Year householder moved into unit - Moved in 1990 to 1994 (%) - American Indian and Alaska Native
Year householder moved into unit - Moved in 1990 to 1994 (%) - Multirace
Year householder moved into unit - Moved in 1990 to 1994 (%) - Other Race
Year householder moved into unit - Moved in 1980 to 1989 (%)
Year householder moved into unit - Moved in 1980 to 1989 (%) - White
Year householder moved into unit - Moved in 1980 to 1989 (%) - Black or African American
Year householder moved into unit - Moved in 1980 to 1989 (%) - Asian
Year householder moved into unit - Moved in 1980 to 1989 (%) - Hispanic or Latino
Year householder moved into unit - Moved in 1980 to 1989 (%) - American Indian and Alaska Native
Year householder moved into unit - Moved in 1980 to 1989 (%) - Multirace
Year householder moved into unit - Moved in 1980 to 1989 (%) - Other Race
Year householder moved into unit - Moved in 1970 to 1979 (%)
Year householder moved into unit - Moved in 1970 to 1979 (%) - White
Year householder moved into unit - Moved in 1970 to 1979 (%) - Black or African American
Year householder moved into unit - Moved in 1970 to 1979 (%) - Asian
Year householder moved into unit - Moved in 1970 to 1979 (%) - Hispanic or Latino
Year householder moved into unit - Moved in 1970 to 1979 (%) - American Indian and Alaska Native
Year householder moved into unit - Moved in 1970 to 1979 (%) - Multirace
Year householder moved into unit - Moved in 1970 to 1979 (%) - Other Race
Year householder moved into unit - Moved in 1969 or earlier (%)
Year householder moved into unit - Moved in 1969 or earlier (%) - White
Year householder moved into unit - Moved in 1969 or earlier (%) - Black or African American
Year householder moved into unit - Moved in 1969 or earlier (%) - Asian
Year householder moved into unit - Moved in 1969 or earlier (%) - Hispanic or Latino
Year householder moved into unit - Moved in 1969 or earlier (%) - American Indian and Alaska Native
Year householder moved into unit - Moved in 1969 or earlier (%) - Multirace
Year householder moved into unit - Moved in 1969 or earlier (%) - Other Race
Housing units lacking complete plumbing facilities (%)
Housing units lacking complete kitchen facilities (%)
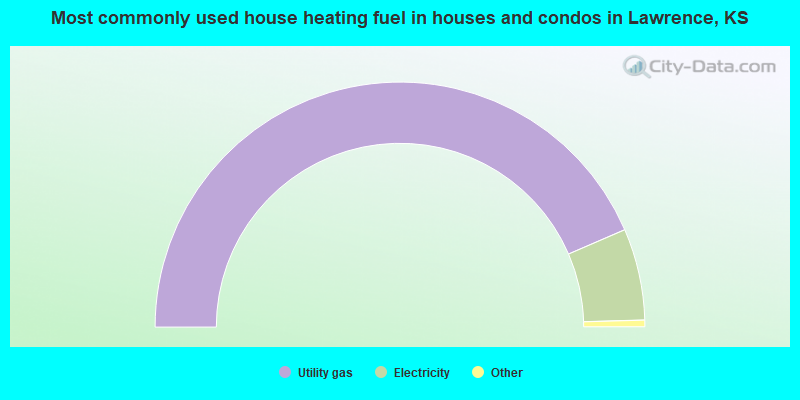
House heating fuel used in houses and condos - Utility gas (%)
House heating fuel used in houses and condos - Bottled, tank, or LP gas (%)
House heating fuel used in houses and condos - Electricity (%)
House heating fuel used in houses and condos - Fuel oil, kerosene, etc. (%)
House heating fuel used in houses and condos - Coal or coke (%)
House heating fuel used in houses and condos - Wood (%)
House heating fuel used in houses and condos - Solar energy (%)
House heating fuel used in houses and condos - Other fuel (%)
House heating fuel used in houses and condos - No fuel used (%)
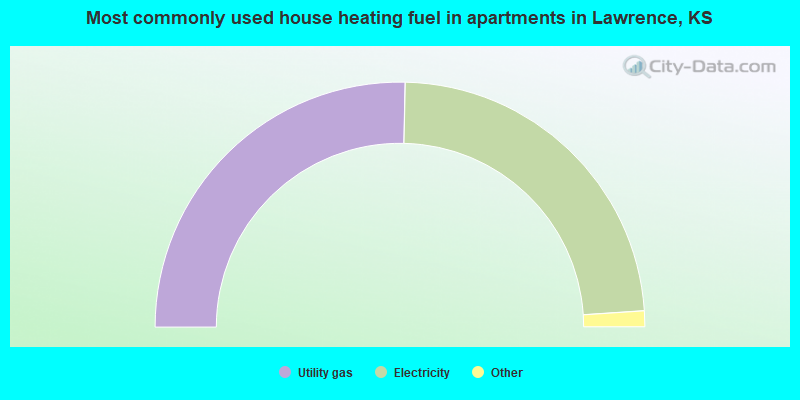
House heating fuel used in apartments - Utility gas (%)
House heating fuel used in apartments - Bottled, tank, or LP gas (%)
House heating fuel used in apartments - Electricity (%)
House heating fuel used in apartments - Fuel oil, kerosene, etc. (%)
House heating fuel used in apartments - Coal or coke (%)
House heating fuel used in apartments - Wood (%)
House heating fuel used in apartments - Solar energy (%)
House heating fuel used in apartments - Other fuel (%)
House heating fuel used in apartments - No fuel used (%)
Latest news about housing in Lawrence, KS collected exclusively by city-data.com from local newspapers, TV, and radio stations
Median year house/condo built: 1986Median year apartment built: 1986Household type by relationship:
Households: 95,784
Male householders: 18,155 (5,261 living alone ), Female householders: 22,954 (8,168 living alone )14,133 spouses (13,997 opposite-sex spouses ), 4,706 unmarried partners , (4,178 opposite-sex unmarried partners ), 17,535 children (16,882 natural , 235 adopted , 418 stepchildren ), 1,176 grandchildren , 788 brothers or sisters , 605 parents , 0 foster children , 644 other relatives , 7,982 non-relatives In group quarters: 7,106
Size of family households: 8,904 2-persons , 4,067 3-persons , 4,416 4-persons , 599 5-persons , 842 6-persons , 145 7-or-more-persons .
Size of nonfamily households: 13,429 1-person , 4,771 2-persons , 1,870 3-persons , 1,434 4-persons , 550 5-persons , 82 7-or-more-persons .
10,974 married couples with children. single-parent households (539 men , 2,696 women ).
88.2% of residents of Lawrence speak English at home. of residents speak Spanish at home (76% speak English very well , 16% speak English well , 7% speak English not well , 1% don't speak English at all ).of residents speak other Indo-European language at home (78% speak English very well , 19% speak English well , 4% speak English not well ).of residents speak Asian or Pacific Island language at home (57% speak English very well , 29% speak English well , 12% speak English not well , 2% don't speak English at all ).of residents speak other language at home (80% speak English very well , 19% speak English well , 1% don't speak English at all ).
Foreign born population: 5,551 (5.8%)of them are naturalized citizens )
Median number of rooms in houses and condos:
Median number of rooms in apartments
Owner-occupied Renter-occupied
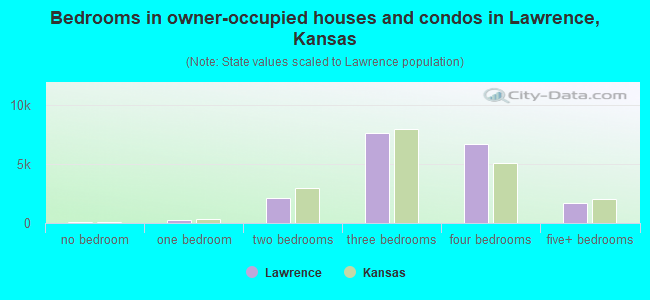
Bedrooms in owner-occupied houses and condos in Lawrence, Kansas
77 no bedroom 243 1 bedroom 2,162 2 bedrooms 7,628 3 bedrooms 6,754 4 bedrooms 1,700 5+ bedrooms
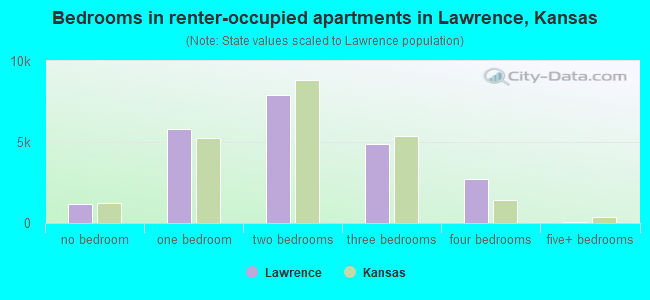
Bedrooms in renter-occupied apartments in Lawrence, Kansas
1,147 no bedroom 5,813 1 bedroom 7,916 2 bedrooms 4,882 3 bedrooms 2,736 4 bedrooms 51 5+ bedrooms
Owner-occupied Renter-occupied
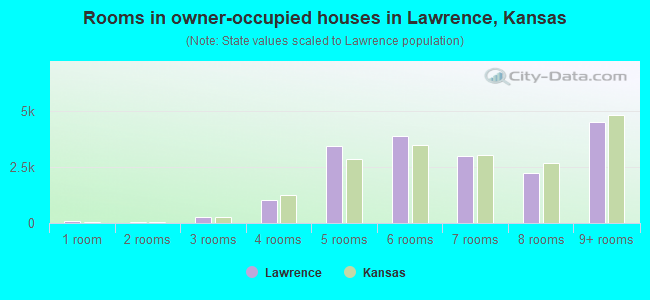
Rooms in owner-occupied houses in Lawrence, Kansas
77 1 room 41 2 rooms 274 3 rooms 1,046 4 rooms 3,461 5 rooms 3,881 6 rooms 3,019 7 rooms 2,229 8 rooms 4,536 9+ rooms
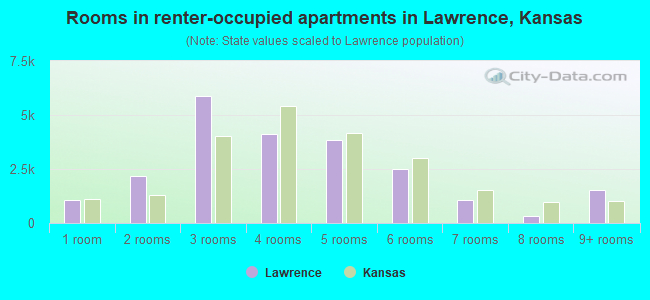
Rooms in renter-occupied apartments in Lawrence, Kansas
1,057 1 room 2,160 2 rooms 5,881 3 rooms 4,131 4 rooms 3,860 5 rooms 2,522 6 rooms 1,086 7 rooms 342 8 rooms 1,506 9+ rooms
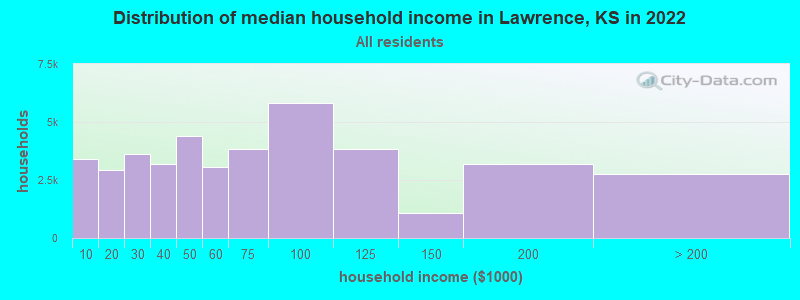
Lawrence, KS household income distribution 3,386 Less than $10,0002,926 $10,000 to $19,9993,640 $20,000 to $29,9993,187 $30,000 to $39,9994,378 $40,000 to $49,9993,051 $50,000 to $59,9993,851 $60,000 to $74,9995,828 $75,000 to $99,9993,824 $100,000 to $124,9991,093 $125,000 to $149,9993,195 $150,000 to $199,9992,750 $200,000 or more
Home value of owner - occupied houses in 2022 in Lawrence, KS 201 Less than $10,00061 $10,000 to $14,99942 $15,000 to $19,99933 $25,000 to $29,99972 $35,000 to $39,99914 $40,000 to $49,99912 $50,000 to $59,99970 $60,000 to $69,99966 $70,000 to $79,99968 $80,000 to $89,99969 $90,000 to $99,999407 $100,000 to $124,999659 $125,000 to $149,9991,943 $150,000 to $174,9991,663 $175,000 to $199,9993,380 $200,000 to $249,9992,230 $250,000 to $299,9993,282 $300,000 to $399,9992,301 $400,000 to $499,9992,146 $500,000 to $749,999231 $750,000 to $999,999125 $1,000,000 to $1,499,99929 $2,000,000 or moreRent paid by renters in 2022 in Lawrence, KS 144 Less than $100101 $150 to $19968 $200 to $249243 $300 to $349505 $350 to $399749 $400 to $44985 $450 to $499570 $500 to $549772 $550 to $5992,225 $600 to $6491,941 $650 to $6991,133 $700 to $7491,360 $750 to $7992,487 $800 to $8991,213 $900 to $9993,242 $1,000 to $1,2491,762 $1,250 to $1,4991,191 $1,500 to $1,999467 $2,000 to $2,499308 $2,500 to $2,999130 $3,000 to $3,499890 $3,500 or more959 No cash rent
Percentage of workers working in this county: 81.1%Number of people working at home: 8,302 (14.8% of all workers )
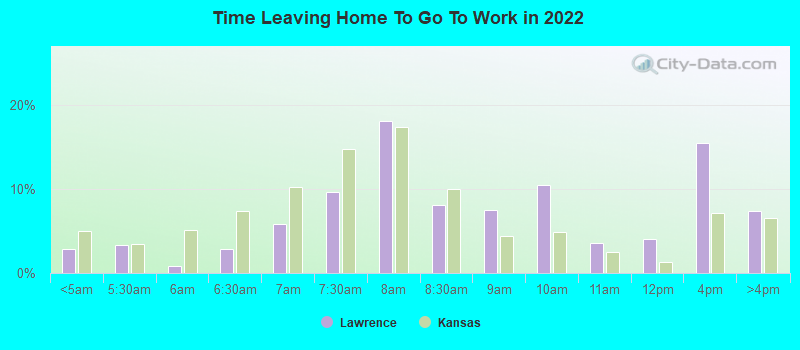
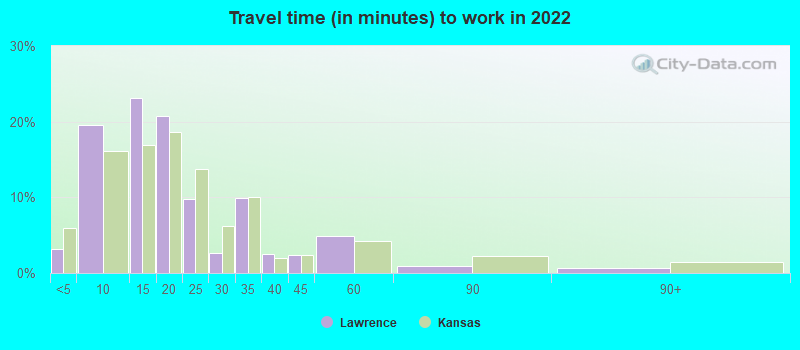
Travel time to work (commute)
Less than 5 minutes: 1,2875 to 9 minutes: 9,08110 to 14 minutes: 11,10915 to 19 minutes: 9,68820 to 24 minutes: 3,47625 to 29 minutes: 1,23730 to 34 minutes: 5,15535 to 39 minutes: 1,65940 to 44 minutes: 1,76345 to 59 minutes: 3,26560 to 89 minutes: 46090 or more minutes: 23
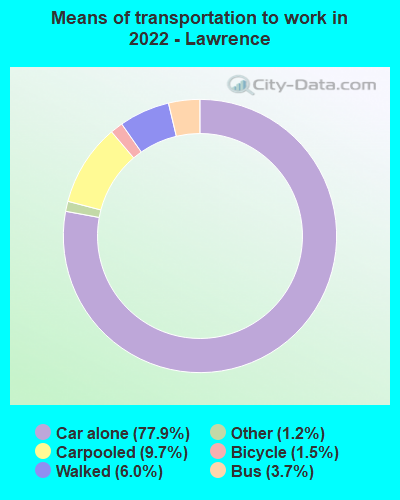
Means of transportation to work:
Drove a car alone: 33,811 (66.0%)Carpooled: 4,245 (8.3%)Bus : 1,759 (3.4%)Subway or elevated rail : 41 (0.1%)Taxi: 643 (1.3%)Bicycle: 678 (1.3%)Walked: 2,691 (5.3%)Worked at home: 8,005 (15.6%)
Unemployment by race in 2022
Unemployment rate for White non-Hispanic residents 6.5% Males5.0% FemalesUnemployment rate for Black residents 0.8% Males10.3% FemalesUnemployment rate for American Indian and Alaska Native residents 6.7% Males4.8% FemalesUnemployment rate for Asian residents 0.5% Males1.9% FemalesUnemployment rate for other race residents 6.1% MalesUnemployment rate for two or more race residents 7.5% Males4.0% FemalesUnemployment rate for Hispanic or Latino residents 2.3% Males3.9% Females
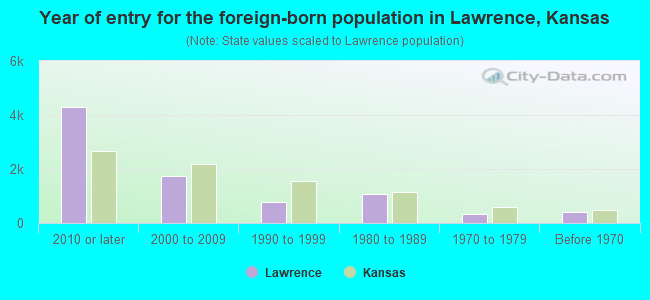
Year of entry for the foreign-born population in Lawrence, Kansas
4,292 2010 or later 1,746 2000 to 2009 783 1990 to 1999 1,088 1980 to 1989 349 1970 to 1979 405 Before 1970
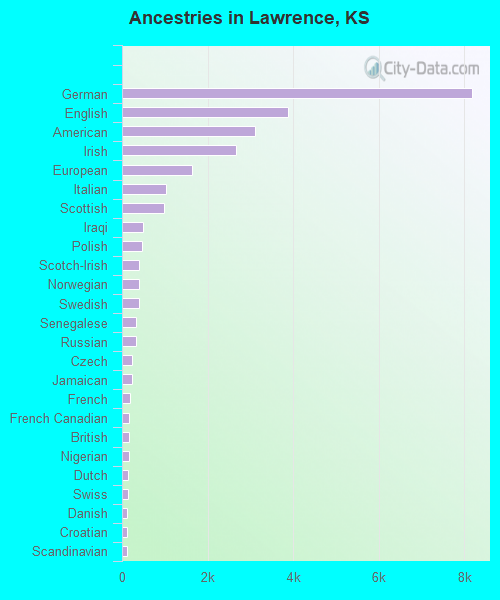
First ancestries reported:
German: 8,173 (18.9%)
English: 3,889 (9.0%)
American: 3,116 (7.2%)
Irish: 2,658 (6.1%)
European: 1,642 (3.8%)
Italian: 1,026 (2.4%)
Scottish: 972 (2.2%)
Iraqi: 486 (1.1%)
Polish: 472 (1.1%)
Scotch-Irish: 408 (0.9%)
Norwegian: 398 (0.9%)
Swedish: 395 (0.9%)
Senegalese: 328 (0.8%)
Russian: 323 (0.7%)
Czech: 239 (0.6%)
Jamaican: 226 (0.5%)
French: 197 (0.5%)
French Canadian: 168 (0.4%)
British: 157 (0.4%)
Nigerian: 154 (0.4%)
Dutch: 142 (0.3%)
Swiss: 130 (0.3%)
Danish: 128 (0.3%)
Croatian: 126 (0.3%)
Scandinavian: 108 (0.2%)
Ukrainian: 108 (0.2%)
African: 101 (0.2%)
Welsh: 99 (0.2%)
Hungarian: 96 (0.2%)
Greek: 93 (0.2%)
Iranian: 72 (0.2%)
Egyptian: 64 (0.1%)
Northern European: 63 (0.1%)
Jordanian: 49 (0.1%)
Eastern European: 43 (0.10%)
Macedonian: 41 (0.09%)
Czechoslovakian: 41 (0.09%)
Slavic: 37 (0.09%)
Brazilian: 36 (0.08%)
Serbian: 35 (0.08%)
Canadian: 35 (0.08%)
Belgian: 34 (0.08%)
Lebanese: 30 (0.07%)
Syrian: 25 (0.06%)
Finnish: 23 (0.05%)
Lithuanian: 23 (0.05%)
Slovak: 22 (0.05%)
Ethiopian: 19 (0.04%)
Arab: 18 (0.04%)
Palestinian: 14 (0.03%)
Austrian: 9 (0.02%)
Yugoslavian: 7 (0.02%)
Romanian: 5 (0.01%)
Most common places of birth for foreign-born residents (%): China, excluding Hong Kong and Taiwan Lawrence:
24.4% (1,824)Kansas:
3.9% (8,053)
Mexico Lawrence:
10.8% (807)Kansas:
39.2% (81,282)
India Lawrence:
10.5% (783)Kansas:
6.5% (13,547)
Vietnam Lawrence:
7.1% (534)Kansas:
5.5% (11,323)
Senegal Lawrence:
4.7% (353)Kansas:
0.2% (397)
Canada Lawrence:
3.0% (221)Kansas:
1.2% (2,585)
Laos Lawrence:
2.9% (217)Kansas:
1.5% (3,082)
Philippines Lawrence:
2.6% (197)Kansas:
2.6% (5,492)
Japan Lawrence:
2.2% (164)Kansas:
0.7% (1,520)
Korea Lawrence:
2.2% (163)Kansas:
1.6% (3,345)
Nepal Lawrence:
2.1% (155)Kansas:
0.6% (1,155)
Kuwait Lawrence:
1.8% (134)Kansas:
0.2% (436)
Brazil Lawrence:
1.7% (128)Kansas:
0.9% (1,963)
Venezuela Lawrence:
1.6% (118)Kansas:
0.8% (1,695)
Iran Lawrence:
1.6% (117)Kansas:
0.7% (1,401)
Place of birth for U.S.-born residents:
This state: 50,267Other state: 38,219Northeast: 3,023Midwest: 17,150South: 10,256West: 7,790 71.2% of Lawrence residents lived in the same house 1 years ago.
Out of people who lived in different houses, 30.9% lived in this county.
Out of people who lived in different counties, 46.6% lived in Kansas.
Lawrence:
71.2%State average:
85.3%
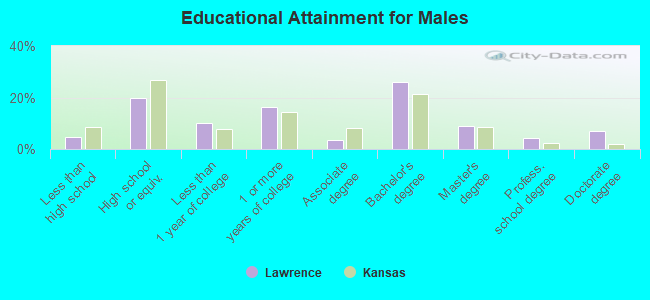
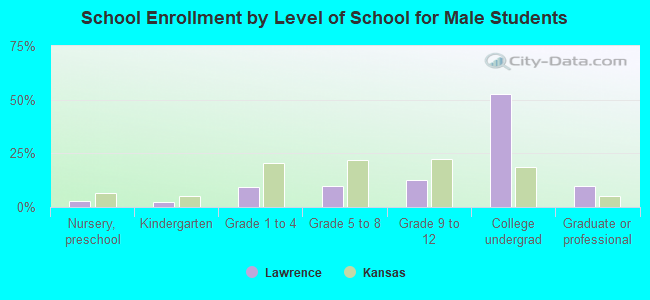
Education attainment for males 25 years and older:
No schooling: 436Nursery to 4th grade: 05th and 6th grade: 07th and 8th grade: 5509th grade: 3910th grade: 7411th grade: 14512th grade, no diploma: 40High school graduate (or equivalency): 5,223Less than 1 year of college: 2,666Some college more than 1 year, no degree: 4,305Associate degree: 911Bachelor's degree: 6,845Master's degree: 2,353Professional school degree: 1,099Doctorate degree: 1,810
Education attainment for females 25 years and older:
No schooling: 255Nursery to 4th grade: 05th and 6th grade: 07th and 8th grade: 1999th grade: 010th grade: 011th grade: 012th grade, no diploma: 185High school graduate (or equivalency): 4,325Less than 1 year of college: 2,741Some college more than 1 year, no degree: 2,906Associate degree: 1,706Bachelor's degree: 7,959Master's degree: 5,569Professional school degree: 774Doctorate degree: 1,267
Housing units in structures:
One, detached: 21,207One, attached: 3,586Two: 1,1873 or 4: 3,6845 to 9: 3,78610 to 19: 5,61320 to 49: 1,71150 or more: 2,569Mobile homes: 898Boats, RVs, vans, etc.: 77Median worth of mobile homes: $9,999
Housing units lacking complete plumbing facilities in 2022: 0.1%Housing units lacking complete kitchen facilities in 2022: 1.4%House/condo owner moved in on average 9 years ago
Renter moved in on average 0 years ago
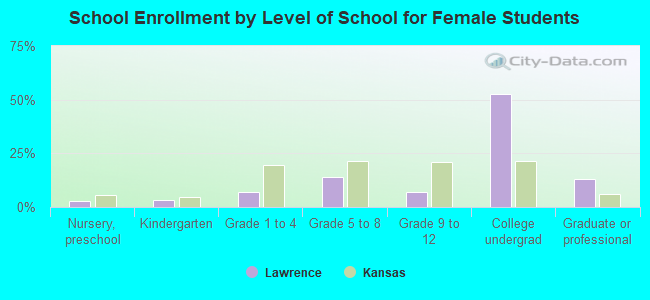
Private vs. public school enrollment:
Students in private schools in grades 1 to 8 (elementary and middle school): 2,310 Students in private schools in grades 9 to 12 (high school): 128 Students in private undergraduate colleges: 1,175