Lanham-Seabrook, MD (Maryland) Houses and Residents
| Lanham-Seabrook: | $418,519 |
| Maryland: | $398,100 |
Total population: 18,858 (Urban population: 18,087, Rural population: 0)
Houses: 6,457 (6,233 occupied: 4,745 owner occupied, 1,488 renter occupied)
| % of renters here: | 24% |
| State: | 32% |
Housing density: 1,227 houses/condos per square mile
Median price asked for vacant for-sale houses and condos in 2022 in this county: $422,373.
Median contract rent in 2022: $1,628 (lower quartile is $1,314, upper quartile is $1,941)
Median rent asked for vacant for-rent units in 2022: $1,244
Median gross rent in Lanham-Seabrook, MD in 2022: $1,720
Housing units in Lanham-Seabrook with a mortgage: 3,859 (453 second mortgage, 336 home equity loan, 8 both second mortgage and home equity loan)
Houses without a mortgage: 767
Compare current foreclosures near Lanham-Seabrook, MD:
| Photo | Address | Area | Beds / Baths | Price | Details |
|---|---|---|---|---|---|

|
#1
Rolling Meadows Rd
Upper Marlboro, MD 20772
|
2,459 sq. feet
|
2 baths 3 beds |
$405,000
|
show details |

|
#2
Bay Ridge Rd
Edgewater, MD 21037
|
2,951 sq. feet
|
3 baths 3 beds |
$615,000
|
show details |

|
#3
Gladys Retreat Cir
Bowie, MD 20720
|
2,880 sq. feet
|
3 baths 3 beds |
$409,900
|
show details |

|
#4
Henson Ln
Temple Hills, MD 20748
|
1,566 sq. feet
|
2 baths 3 beds |
$300,000
|
show details |

|
#5
17th St NW Apt 504
Washington, DC 20009
|
800 sq. feet
|
1 baths 1 beds |
$405,000
|
show details |

|
#6
Interlachen Dr Apt 111
Silver Spring, MD 20906
|
965 sq. feet
|
1 baths 2 beds |
$148,000
|
show details |

|
#7
Ensleigh Ln
Bowie, MD 20716
|
1,656 sq. feet
|
2 baths 3 beds |
$374,900
|
show details |

|
#8
Monroe St NW
Washington, DC 20010
|
- sq. feet
|
2 baths 2 beds |
$665,000
|
show details |

|
#9
Pickett Dr
Suitland, MD 20746
|
1,296 sq. feet
|
1 baths 2 beds |
$335,000
|
show details |

|
#10
Heming Ln
Bowie, MD 20716
|
1,800 sq. feet
|
2 baths 3 beds |
$400,000
|
show details |
| Photo | Address | Area | Beds / Baths | Price | Details |
|---|---|---|---|---|---|

|
#11
9th St NW
Washington, DC 20011
|
1,604 sq. feet
|
2 baths 3 beds |
$598,000
|
show details |

|
#12
Eastern Ave NE
Washington, DC 20011
|
1,024 sq. feet
|
1 baths 3 beds |
$395,000
|
show details |

|
#13
Addison Rd
Capitol Heights, MD 20743
|
1,400 sq. feet
|
1 baths 3 beds |
$260,000
|
show details |

|
#14
Elkhorn Ln
Bowie, MD 20716
|
1,514 sq. feet
|
2 baths 3 beds |
$415,000
|
show details |

|
#15
Cathedral Ave NW Apt 108
Washington, DC 20016
|
765 sq. feet
|
1 baths 1 beds |
$269,900
|
show details |

|
#16
Carousel Ct
Upper Marlboro, MD 20772
|
2,112 sq. feet
|
2 baths 3 beds |
$385,000
|
show details |

|
#17
Fitzgibbon Ct
Bowie, MD 20721
|
1,300 sq. feet
|
2 baths 3 beds |
$369,200
|
show details |

|
#18
Applegarth Pl
Capitol Heights, MD 20743
|
1,200 sq. feet
|
1 baths 3 beds |
$314,900
|
show details |

|
#19
Hammersmith Cir
Silver Spring, MD 20906
|
1,152 sq. feet
|
1 baths 3 beds |
$353,600
|
show details |

|
#20
Pooks Hill Rd Apt 1612s
Bethesda, MD 20814
|
1,250 sq. feet
|
1 baths 2 beds |
$289,000
|
show details |
| Photo | Address | Area | Beds / Baths | Price | Details |
|---|---|---|---|---|---|

|
#21
Mandan Rd Apt 103 Unit 621
Greenbelt, MD 20770
|
1,420 sq. feet
|
2 baths 3 beds |
$179,900
|
show details |

|
#22
19th St NW
Washington, DC 20036
|
2,515 sq. feet
|
6 baths 8 beds |
$1,684,800
|
show details |

|
#23
Delaware Ave SW Apt N720
Washington, DC 20024
|
- sq. feet
|
1 baths 1 beds |
$149,900
|
show details |

|
#24
Wilson Bridge Dr Unit #6770 A-2
Oxon Hill, MD 20745
|
- sq. feet
|
1 baths 1 beds |
$99,750
|
show details |

|
#25
Brooke Ln
Upper Marlboro, MD 20772
|
- sq. feet
|
5 baths 6 beds |
$949,000
|
show details |

|
#26
T St SE Apt 3
Washington, DC 20020
|
- sq. feet
|
2 baths 4 beds |
$307,500
|
show details |

|
#27
Holbrook Ter NE
Washington, DC 20002
|
3,164 sq. feet
|
4 baths 8 beds |
show details | |

|
#28
Oakwood St SE Apt B5
Washington, DC 20032
|
628 sq. feet
|
1 baths 1 beds |
show details | |

|
#29
Carrollsburg Pl SW
Washington, DC 20024
|
1,720 sq. feet
|
2 baths 3 beds |
show details | |

|
#30
Grant St NE
Washington, DC 20019
|
1,152 sq. feet
|
1 baths 3 beds |
show details |
| Photo | Address | Area | Beds / Baths | Price | Details |
|---|---|---|---|---|---|

|
#31
Scaffold Way
Odenton, MD 21113
|
1,664 sq. feet
|
4 baths 4 beds |
show details | |

|
#32
T Pl SE
Washington, DC 20020
|
900 sq. feet
|
2 baths 2 beds |
show details | |

|
#33
Sutton Ln
Bowie, MD 20720
|
2,132 sq. feet
|
3 baths 3 beds |
show details | |

|
#34
Jefferson St NW
Washington, DC 20011
|
1,280 sq. feet
|
5 baths 6 beds |
show details | |

|
#35
Kipling Pkwy
District Heights, MD 20747
|
1,680 sq. feet
|
1 baths 3 beds |
show details | |

|
#36
Auth Rd
Suitland, MD 20746
|
1,367 sq. feet
|
1 baths 4 beds |
show details | |

|
#37
Horner Pl SE
Washington, DC 20032
|
1,024 sq. feet
|
1 baths 3 beds |
show details | |

|
#38
Barnaby St SE
Washington, DC 20032
|
1,664 sq. feet
|
2 baths 3 beds |
show details | |

|
#39
Foote St NE
Washington, DC 20019
|
1,000 sq. feet
|
1 baths 3 beds |
show details | |

|
#40
47th St NE
Washington, DC 20019
|
2,363 sq. feet
|
2 baths 5 beds |
show details |
| Photo | Address | Area | Beds / Baths | Price | Details |
|---|---|---|---|---|---|

|
#41
28th St SE
Washington, DC 20020
|
1,200 sq. feet
|
3 baths 3 beds |
show details | |

|
#42
13th Ave
Hyattsville, MD 20782
|
1,598 sq. feet
|
1 baths 4 beds |
show details | |

|
#43
N Royal St
Alexandria, VA 22314
|
- sq. feet
|
1 baths 1 beds |
show details | |

|
#44
Sargent Rd NE
Washington, DC 20017
|
1,360 sq. feet
|
2 baths 3 beds |
show details | |

|
#45
Elfin Ave
Capitol Heights, MD 20743
|
1,146 sq. feet
|
2 baths 3 beds |
show details | |

|
#46
Parke West Dr
Glen Burnie, MD 21061
|
1,488 sq. feet
|
2 baths 3 beds |
show details | |

|
#47
Trenton Pl SE
Washington, DC 20032
|
1,872 sq. feet
|
3 baths 4 beds |
show details | |

|
#48
Eddy Rd
Crownsville, MD 21032
|
1,100 sq. feet
|
2 baths 2 beds |
show details | |

|
#49
Wahler Pl SE
Washington, DC 20032
|
1,364 sq. feet
|
2 baths 3 beds |
show details | |

|
Check over 1 million property listings on Foreclosure.com!
|
browse all offers | |||


Household type by relationship:
Households: 844,092- In family households: 710,220 (114,456 male householders, 89,064 female householders)
122,000 spouses, 253,142 children (236,469 natural, 5,681 adopted, 10,992 stepchildren), 29,677 grandchildren, 18,092 brothers or sisters, 12,087 parents, foster children, 29,298 other relatives, 35,579 non-relatives
- In nonfamily households: 133,872 (44,509 male householders (32,938 living alone)), 56,013 female householders (46,437 living alone)), 33,350 nonrelatives
- In group quarters: 19,328 (4,283 institutionalized population)
114,918 married couples with children.
64,724 single-parent households (11,519 men, 53,205 women).
82.5% of residents of Lanham-Seabrook speak English at home.
5.3% of residents speak Spanish at home (47% speak English very well, 27% speak English well, 22% speak English not well, 4% don't speak English at all).
3.9% of residents speak other Indo-European language at home (66% speak English very well, 30% speak English well, 3% speak English not well, 1% don't speak English at all).
4.1% of residents speak Asian or Pacific Island language at home (41% speak English very well, 37% speak English well, 18% speak English not well, 5% don't speak English at all).
4.3% of residents speak other language at home (90% speak English very well, 5% speak English well, 5% speak English not well, 1% don't speak English at all).
Foreign born population: 7,111 (33.3%)
(57.7% of them are naturalized citizens)
| Here: | 7.3 |
| State: | 7.3 |
| Here: | 4.1 |
| State: | 4.2 |

- Bedrooms in owner-occupied houses and condos in Lanham-Seabrook, Maryland
- 48no bedroom
- 591 bedroom
- 3502 bedrooms
- 2,1903 bedrooms
- 1,6894 bedrooms
- 4095+ bedrooms

- Bedrooms in renter-occupied apartments in Lanham-Seabrook, Maryland
- 121no bedroom
- 5111 bedroom
- 4942 bedrooms
- 2873 bedrooms
- 534 bedrooms
- 225+ bedrooms

- Cars and other vehicles available in Lanham-Seabrook in owner-occupied houses/condos
- 99no vehicle
- 1,4431 vehicle
- 1,9752 vehicles
- 8543 vehicles
- 3124 vehicles
- 625+ vehicles

- Cars and other vehicles available in Lanham-Seabrook in renter-occupied apartments
- 105no vehicle
- 8911 vehicle
- 4192 vehicles
- 683 vehicles
- 04 vehicles
- 55+ vehicles

- Rooms in owner-occupied houses in Lanham-Seabrook, Maryland
- 01 room
- 142 rooms
- 1913 rooms
- 1074 rooms
- 4975 rooms
- 7626 rooms
- 9747 rooms
- 1,0348 rooms
- 1,1669+ rooms

- Rooms in renter-occupied apartments in Lanham-Seabrook, Maryland
- 731 room
- 2122 rooms
- 2703 rooms
- 3504 rooms
- 2595 rooms
- 1776 rooms
- 647 rooms
- 488 rooms
- 359+ rooms


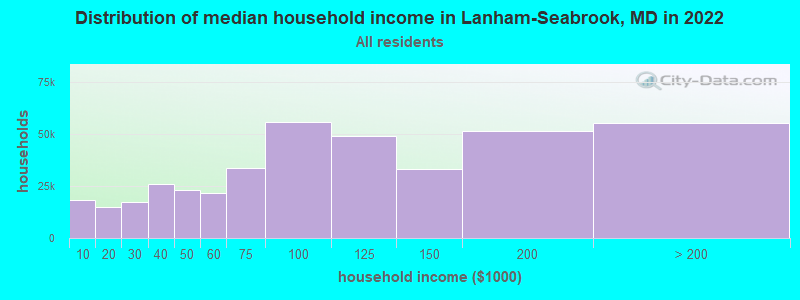
Lanham-Seabrook, MD household income distribution

- 18,366Less than $10,000
- 15,076$10,000 to $19,999
- 17,127$20,000 to $29,999
- 25,983$30,000 to $39,999
- 23,047$40,000 to $49,999
- 21,537$50,000 to $59,999
- 33,421$60,000 to $74,999
- 55,711$75,000 to $99,999
- 48,878$100,000 to $124,999
- 32,927$125,000 to $149,999
- 51,334$150,000 to $199,999
- 55,287$200,000 or more
Percentage of workers working in this county: 59.1%
Number of people working at home: 2,024 (17.9% of all workers)
Travel time to work (commute)
- Less than 5 minutes: 94
- 5 to 9 minutes: 424
- 10 to 14 minutes: 939
- 15 to 19 minutes: 834
- 20 to 24 minutes: 1,199
- 25 to 29 minutes: 504
- 30 to 34 minutes: 1,666
- 35 to 39 minutes: 325
- 40 to 44 minutes: 499
- 45 to 59 minutes: 1,202
- 60 to 89 minutes: 916
- 90 or more minutes: 495
Means of transportation to work:
- Drove a car alone: 6,486 (70.4%)
- Carpooled: 1,310 (14.2%)
- Bus or trolley bus: 243 (2.6%)
- Streetcar or trolley car: 29 (0.3%)
- Subway or elevated: 712 (7.7%)
- Railroad: 35 (0.4%)
- Taxi: 61 (0.7%)
- Motorcycle: 14 (0.2%)
- Bicycle: 10 (0.1%)
- Walked: 168 (1.8%)
- Other means: 29 (0.3%)
- Worked at home: 115 (1.2%)


- Year of entry for the foreign-born population in Lanham-Seabrook, Maryland
- 8621995 to March 2000
- 5231990 to 1994
- 4301985 to 1989
- 6061980 to 1984
- 2441975 to 1979
- 2671970 to 1974
- 1181965 to 1969
- 100Before 1965

First ancestries reported:
- Other: 10,790 (59.8%)
- Subsaharan African: 1,605 (8.9%)
- Irish: 967 (5.4%)
- German: 931 (5.2%)
- West Indian: 701 (3.9%)
- English: 603 (3.3%)
- Italian: 564 (3.1%)
- United States: 518 (2.9%)
- Polish: 209 (1.2%)
- French: 206 (1.1%)
- Russian: 123 (0.7%)
- Hungarian: 117 (0.6%)
- Scottish: 101 (0.6%)
- Scotch-Irish: 100 (0.6%)
- French Canadian: 81 (0.4%)
- Dutch: 62 (0.3%)
- Greek: 58 (0.3%)
- Czech: 53 (0.3%)
- Ukrainian: 49 (0.3%)
- Slovak: 38 (0.2%)
- Norwegian: 36 (0.2%)
- Welsh: 36 (0.2%)
- Swedish: 31 (0.2%)
- Arab: 26 (0.1%)
- Portuguese: 19 (0.1%)
- Danish: 14 (0.08%)
- Swiss: 12 (0.07%)
- Lithuanian: 8 (0.04%)
Most common places of birth for foreign-born residents (%):
| Lanham-Seabrook: | 16.6% (523) |
| Maryland: | 2.9% (15,071) |
| Lanham-Seabrook: | 6.1% (191) |
| Maryland: | 3.7% (18,988) |
| Lanham-Seabrook: | 6.0% (189) |
| Maryland: | 6.2% (32,276) |
| Lanham-Seabrook: | 6.0% (189) |
| Maryland: | 8.1% (41,818) |
| Lanham-Seabrook: | 5.3% (166) |
| Maryland: | 1.2% (6,190) |
| Lanham-Seabrook: | 5.1% (162) |
| Maryland: | 4.1% (21,007) |
| Lanham-Seabrook: | 4.6% (146) |
| Maryland: | 3.7% (19,287) |
| Lanham-Seabrook: | 4.5% (142) |
| Maryland: | 2.9% (14,807) |
| Lanham-Seabrook: | 4.5% (142) |
| Maryland: | 1.0% (5,367) |
| Lanham-Seabrook: | 4.3% (134) |
| Maryland: | 1.7% (8,678) |
| Lanham-Seabrook: | 2.6% (83) |
| Maryland: | 6.0% (31,249) |
| Lanham-Seabrook: | 2.6% (81) |
| Maryland: | 0.8% (4,212) |
| Lanham-Seabrook: | 2.5% (80) |
| Maryland: | 1.0% (5,156) |
| Lanham-Seabrook: | 2.5% (80) |
| Maryland: | 2.1% (11,050) |
| Lanham-Seabrook: | 2.4% (77) |
| Maryland: | 2.0% (10,309) |
| Lanham-Seabrook: | 2.3% (74) |
| Maryland: | 0.5% (2,804) |
| Lanham-Seabrook: | 1.6% (49) |
| Maryland: | 1.3% (6,550) |
| Lanham-Seabrook: | 1.6% (49) |
| Maryland: | 1.7% (8,723) |
| Lanham-Seabrook: | 1.6% (49) |
| Maryland: | 0.8% (4,250) |
Place of birth for U.S.-born residents:
- This state: 4,125
- Other state: 10,602
- Northeast: 1,622
- Midwest: 645
- South: 7,969
- West: 366
60% of Lanham-Seabrook residents lived in the same house 5 years ago.
Out of people who lived in different houses, 66% lived in this county.
Out of people who lived in different counties, 31% lived in Maryland.
Education attainment for males 25 years and older:
- No schooling: 15
- Nursery to 4th grade: 7
- 5th and 6th grade: 15
- 7th and 8th grade: 102
- 9th grade: 116
- 10th grade: 63
- 11th grade: 140
- 12th grade, no diploma: 292
- High school graduate (or equivalency): 1,381
- Less than 1 year of college: 369
- Some college more than 1 year, no degree: 905
- Associate degree: 211
- Bachelor's degree: 1,068
- Master's degree: 476
- Professional school degree: 74
- Doctorate degree: 142

Education attainment for females 25 years and older:
- No schooling: 77
- Nursery to 4th grade: 0
- 5th and 6th grade: 42
- 7th and 8th grade: 36
- 9th grade: 79
- 10th grade: 107
- 11th grade: 80
- 12th grade, no diploma: 303
- High school graduate (or equivalency): 1,722
- Less than 1 year of college: 376
- Some college more than 1 year, no degree: 1,097
- Associate degree: 457
- Bachelor's degree: 1,372
- Master's degree: 529
- Professional school degree: 66
- Doctorate degree: 69


Housing units in structures:
- One, detached: 4,506
- One, attached: 688
- Two: 28
- 3 or 4: 18
- 5 to 9: 163
- 10 to 19: 933
- 20 to 49: 29
- 50 or more: 92
Housing units lacking complete kitchen facilities: 0.2%

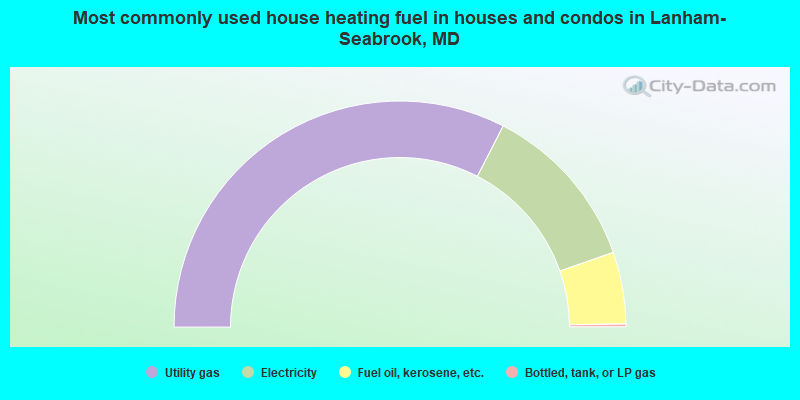
- 65.1%Utility gas
- 24.2%Electricity
- 10.3%Fuel oil, kerosene, etc.
- 0.4%Bottled, tank, or LP gas
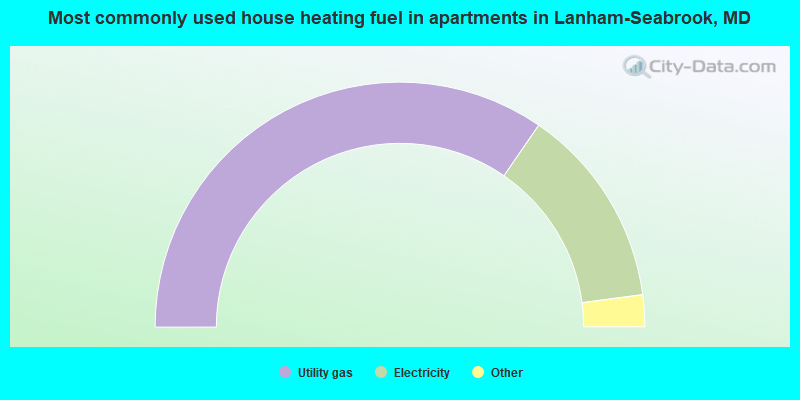
- 69.2%Utility gas
- 26.6%Electricity
- 3.7%Fuel oil, kerosene, etc.
- 0.5%Bottled, tank, or LP gas
Private vs. public school enrollment:
| Here: | 18.1% |
| Maryland: | 14.8% |
| Here: | 16.2% |
| Maryland: | 13.3% |
| Here: | 19.9% |
| Maryland: | 21.7% |


