Jump to a detailed profile or search site with Google Custom Search

Lake Wylie, SC (South Carolina) Houses and Residents

Estimated median house or condo value in 2022: $541,742 (it was $241,900 in 2000)
Lake Wylie:

$541,742
South Carolina:

$254,600
Lower value quartile - upper value quartile: $407,838 - $765,575

Mean price in 2022:

Detached houses: $573,431
Here:

$573,431
State:

$368,255

Townhouses or other attached units: $229,343
Here:

$229,343
State:

$292,023

In 5-or-more-unit structures: $217,446
Here:

$217,446
State:

$326,361

Mobile homes: $189,373
Here:

$189,373
State:

$102,531

Total population: 8,841 (Urban population: 2,930, Rural population: 218 (all nonfarm))

Houses: 5,923 (5,539 occupied: 4,294 owner occupied, 1,242 renter occupied)

% of renters here:

22%
State:

28%

Housing density: 1,704 houses/condos per square mile

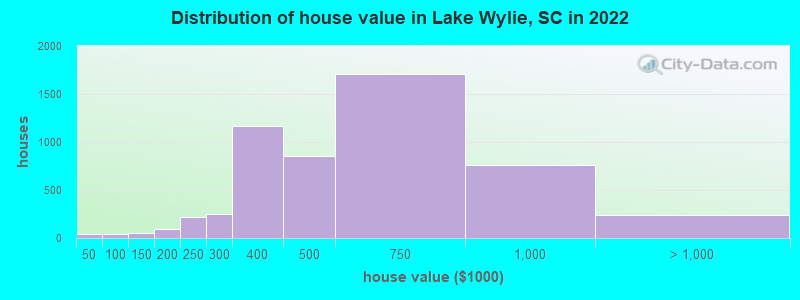
Median price asked for vacant for-sale houses and condos in 2022: $206,679.

Median contract rent in 2022: $1,463 (lower quartile is $1,321, upper quartile is $1,794)


Median rent asked for vacant for-rent units in 2022: $2,396


Median gross rent in Lake Wylie, SC in 2022: $1,568

Housing units in Lake Wylie with a mortgage: 3,370 (398 second mortgage, 17 home equity loan, 403 both second mortgage and home equity loan)
Houses without a mortgage: 89

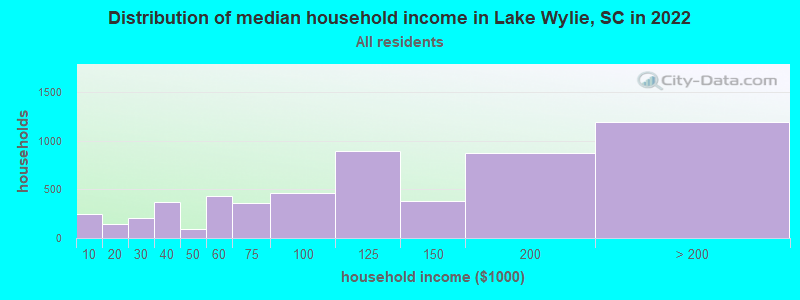
Median household income for houses/condos with a mortgage: $148,142

Median household income for apartments without a mortgage: $113,431

Median monthly housing costs: $1,611

Compare current foreclosures near Lake Wylie, SC:

Check out more offers near Lake Wylie, SC.
Powered by Foreclosure.com

Settings
X
Data:
Loading data...
Based on 2000-2022 data
Loading data...

123
Hide US histogram

Lake Wylie, South Carolina Age and Sex of Residents
Median year house/condo built: 2007

Median year apartment built: 2011

Household type by relationship:

Households: 14,954
  • Male householders: 2,582 (225 living alone), Female householders: 2,907 (678 living alone)
  • 3,128 spouses (3,094 opposite-sex spouses), 384 unmarried partners, (384 opposite-sex unmarried partners), 5,424 children (5,185 natural, 95 adopted, 143 stepchildren), 35 grandchildren, 24 brothers or sisters, 178 parents, 0 foster children, 183 other relatives, 103 non-relatives

Size of family households: 1,944 2-persons, 939 3-persons, 1,136 4-persons, 446 5-persons, 19 6-persons.

Size of nonfamily households: 913 1-person, 173 2-persons.

3,430 married couples with children.
763 single-parent households (96 men, 667 women).

93.0% of residents of Lake Wylie speak English at home.
3.1% of residents speak Spanish at home (67% speak English very well, 28% speak English well, 4% speak English not well).
2.9% of residents speak other Indo-European language at home (75% speak English very well, 25% speak English well).
0.6% of residents speak Asian or Pacific Island language at home (48% speak English very well, 33% speak English well, 18% speak English not well).
0.5% of residents speak other language at home (37% speak English very well, 63% speak English well).

Foreign born population: 913 (6.1%)
(82.1% of them are naturalized citizens)

Median number of rooms in houses and condos:
Here:

8.1
State:

6.4

Median number of rooms in apartments
Here:

4.6
State:

4.5

Owner-occupied Renter-occupied
Bedrooms in owner-occupied houses and condos in Lake Wylie, South Carolina
  • Bedrooms in owner-occupied houses and condos in Lake Wylie, South Carolina
  • 0no bedroom
  • 01 bedroom
  • 1632 bedrooms
  • 1,7723 bedrooms
  • 1,6554 bedrooms
  • 7055+ bedrooms
Bedrooms in renter-occupied apartments in Lake Wylie, South Carolina
  • Bedrooms in renter-occupied apartments in Lake Wylie, South Carolina
  • 17no bedroom
  • 1101 bedroom
  • 5262 bedrooms
  • 5603 bedrooms
  • 294 bedrooms
  • 05+ bedrooms
Owner-occupied Renter-occupied
Cars and other vehicles available in Lake Wylie in owner-occupied houses/condos
  • Cars and other vehicles available in Lake Wylie in owner-occupied houses/condos
  • 88no vehicle
  • 6681 vehicle
  • 2,2922 vehicles
  • 7133 vehicles
  • 3684 vehicles
  • 1655+ vehicles
Cars and other vehicles available in Lake Wylie in renter-occupied apartments
  • Cars and other vehicles available in Lake Wylie in renter-occupied apartments
  • 0no vehicle
  • 6071 vehicle
  • 4042 vehicles
  • 2223 vehicles
  • 94 vehicles
  • 05+ vehicles
Owner-occupied Renter-occupied
Rooms in owner-occupied houses in Lake Wylie, South Carolina
  • Rooms in owner-occupied houses in Lake Wylie, South Carolina
  • 01 room
  • 02 rooms
  • 03 rooms
  • 1844 rooms
  • 3715 rooms
  • 7436 rooms
  • 6167 rooms
  • 7358 rooms
  • 1,6459+ rooms
Rooms in renter-occupied apartments in Lake Wylie, South Carolina
  • Rooms in renter-occupied apartments in Lake Wylie, South Carolina
  • 171 room
  • 562 rooms
  • 2883 rooms
  • 2494 rooms
  • 4445 rooms
  • 956 rooms
  • 567 rooms
  • 98 rooms
  • 299+ rooms
Year house built
Median 2022 house/condo value by year built
Median house/condo value by year householder moved into unit
Breakdown of mean house values by ages of householders
Owners and renters by unit type in Lake Wylie, SC
  • Lake Wylie, SC household income distribution

  • Distribution of median household income in Lake Wylie, SC in 2022
  • 242Less than $10,000
  • 145$10,000 to $19,999
  • 209$20,000 to $29,999
  • 368$30,000 to $39,999
  • 93$40,000 to $49,999
  • 427$50,000 to $59,999
  • 355$60,000 to $74,999
  • 462$75,000 to $99,999
  • 894$100,000 to $124,999
  • 379$125,000 to $149,999
  • 869$150,000 to $199,999
  • 1,192$200,000 or more
  • Home value of owner - occupied houses in 2022 in Lake Wylie, SC

  • Distribution of house value in Lake Wylie, SC in 2022
  • 18$10,000 to $14,999
  • 19$20,000 to $24,999
  • 5$40,000 to $49,999
  • 20$50,000 to $59,999
  • 16$80,000 to $89,999
  • 42$100,000 to $124,999
  • 7$125,000 to $149,999
  • 40$150,000 to $174,999
  • 58$175,000 to $199,999
  • 215$200,000 to $249,999
  • 249$250,000 to $299,999
  • 1,165$300,000 to $399,999
  • 855$400,000 to $499,999
  • 1,712$500,000 to $749,999
  • 758$750,000 to $999,999
  • 201$1,000,000 to $1,499,999
  • 37$1,500,000 to $1,999,999
  • Rent paid by renters in 2022 in Lake Wylie, SC

  • Distribution of rent paid by renters in Lake Wylie, SC in 2022
  • 45$600 to $649
  • 70$700 to $749
  • 12$750 to $799
  • 40$900 to $999
  • 349$1,000 to $1,249
  • 290$1,250 to $1,499
  • 526$1,500 to $1,999
  • 23$2,000 to $2,499
  • 24$2,500 to $2,999
  • 36No cash rent
Time Leaving Home To Go To Work in 2022

Percentage of workers working in this county: 61.0%
Number of people working at home: 1,839 (24.1% of all workers)

Travel time (in minutes) to work in 2022

Travel time to work (commute)

  • Less than 5 minutes: 352
  • 5 to 9 minutes: 453
  • 10 to 14 minutes: 317
  • 15 to 19 minutes: 374
  • 20 to 24 minutes: 1,040
  • 25 to 29 minutes: 509
  • 30 to 34 minutes: 931
  • 35 to 39 minutes: 255
  • 40 to 44 minutes: 106
  • 45 to 59 minutes: 963
  • 60 to 89 minutes: 491
  • 90 or more minutes: 177
Means of transportation to work in 2022 - Lake Wylie

Means of transportation to work:

  • Drove a car alone: 2,196 (53.1%)
  • Carpooled: 213 (5.1%)
  • Taxi: 32 (0.8%)
  • Walked: 130 (3.1%)
  • Worked at home: 1,839 (44.4%)
Class of Workers in 2022
  • Unemployment by race in 2022
  • Unemployment rate for White non-Hispanic residents
  • 3.7%Males
  • 5.9%Females
  • Unemployment rate for two or more race residents
  • 28.9%Females
Year of entry for the foreign-born population in Lake Wylie, South Carolina
  • Year of entry for the foreign-born population in Lake Wylie, South Carolina
  • 2272010 or later
  • 3132000 to 2009
  • 1061990 to 1999
  • 101980 to 1989
  • 461970 to 1979
  • 40Before 1970
Ancestries in Lake Wylie, SC

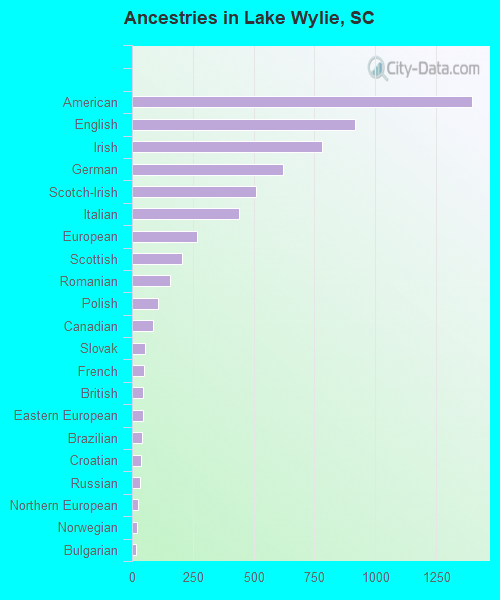
First ancestries reported:

  • American: 1,398 (17.3%)
  • English: 916 (11.3%)
  • Irish: 783 (9.7%)
  • German: 622 (7.7%)
  • Scotch-Irish: 509 (6.3%)
  • Italian: 439 (5.4%)
  • European: 267 (3.3%)
  • Scottish: 207 (2.6%)
  • Romanian: 157 (1.9%)
  • Polish: 108 (1.3%)
  • Canadian: 88 (1.1%)
  • Slovak: 55 (0.7%)
  • French: 51 (0.6%)
  • British: 45 (0.6%)
  • Eastern European: 44 (0.5%)
  • Brazilian: 41 (0.5%)
  • Croatian: 37 (0.5%)
  • Russian: 32 (0.4%)
  • Northern European: 23 (0.3%)
  • Norwegian: 20 (0.2%)
  • Bulgarian: 17 (0.2%)
  • Austrian: 6 (0.07%)
  • Greek: 5 (0.06%)

Most common places of birth for foreign-born residents (%):

Romania
Lake Wylie:

18.8% (151)
South Carolina:

0.6% (1,507)

Brazil
Lake Wylie:

13.5% (108)
South Carolina:

2.0% (5,344)

India
Lake Wylie:

8.4% (67)
South Carolina:

6.8% (18,307)

England
Lake Wylie:

7.4% (59)
South Carolina:

1.9% (5,117)

Scotland
Lake Wylie:

6.4% (51)
South Carolina:

0.4% (1,092)

Canada
Lake Wylie:

6.1% (49)
South Carolina:

3.0% (8,193)

Russia
Lake Wylie:

6.0% (48)
South Carolina:

1.3% (3,522)

United Kingdom, excluding England and Scotland
Lake Wylie:

5.2% (42)
South Carolina:

1.2% (3,296)

Nigeria
Lake Wylie:

5.0% (40)
South Carolina:

0.6% (1,652)

China, excluding Hong Kong and Taiwan
Lake Wylie:

4.4% (35)
South Carolina:

3.2% (8,721)

El Salvador
Lake Wylie:

3.1% (25)
South Carolina:

1.1% (2,998)

Netherlands
Lake Wylie:

2.5% (20)
South Carolina:

0.3% (727)

Germany
Lake Wylie:

2.2% (18)
South Carolina:

3.7% (9,982)

Colombia
Lake Wylie:

2.2% (18)
South Carolina:

4.3% (11,533)

Ecuador
Lake Wylie:

1.9% (15)
South Carolina:

0.9% (2,502)

Peru
Lake Wylie:

1.9% (15)
South Carolina:

0.5% (1,273)

Costa Rica
Lake Wylie:

1.7% (14)
South Carolina:

0.5% (1,395)

Honduras
Lake Wylie:

1.7% (14)
South Carolina:

4.8% (12,834)

Bulgaria
Lake Wylie:

1.6% (13)
South Carolina:

0.2% (566)

Place of birth for U.S.-born residents:

  • This state: 1,878
  • Other state: 12,329
  • Northeast: 3,407
  • Midwest: 2,054
  • South: 6,190
  • West: 682

88.5% of Lake Wylie residents lived in the same house 1 years ago.
   Out of people who lived in different houses, 40.6% lived in this county.
   Out of people who lived in different counties, 16.2% lived in South Carolina.


Lake Wylie:

88.5%
State average:

86.5%

Education attainment for males 25 years and older:

  • No schooling: 19
  • Nursery to 4th grade: 0
  • 5th and 6th grade: 0
  • 7th and 8th grade: 20
  • 9th grade: 8
  • 10th grade: 0
  • 11th grade: 0
  • 12th grade, no diploma: 9
  • High school graduate (or equivalency): 607
  • Less than 1 year of college: 275
  • Some college more than 1 year, no degree: 789
  • Associate degree: 695
  • Bachelor's degree: 1,641
  • Master's degree: 534
  • Professional school degree: 130
  • Doctorate degree: 24
Educational Attainment for Males

Education attainment for females 25 years and older:

  • No schooling: 10
  • Nursery to 4th grade: 0
  • 5th and 6th grade: 0
  • 7th and 8th grade: 0
  • 9th grade: 19
  • 10th grade: 11
  • 11th grade: 41
  • 12th grade, no diploma: 9
  • High school graduate (or equivalency): 842
  • Less than 1 year of college: 191
  • Some college more than 1 year, no degree: 749
  • Associate degree: 562
  • Bachelor's degree: 1,563
  • Master's degree: 937
  • Professional school degree: 33
  • Doctorate degree: 0
Educational Attainment for Females
Lake Wylie marital status for males
Lake Wylie marital status for females

Housing units in structures:

  • One, detached: 4,314
  • One, attached: 445
  • 3 or 4: 72
  • 5 to 9: 289
  • 10 to 19: 394
  • 20 to 49: 292
  • Mobile homes: 113
Housing units lacking complete plumbing facilities in 2022: 0.5%

Housing units lacking complete kitchen facilities in 2022: 0.5%

House/condo owner moved in on average 5 years ago

Renter moved in on average 0 years ago

Year householders moved into residence in Lake Wylie
Houses and condos Apartments
Most commonly used house heating fuel in houses and condos in Lake Wylie, SC
  • 56.4%Utility gas
  • 36.8%Electricity
  • 5.1%Bottled, tank, or LP gas
  • 0.8%Wood
  • 0.5%Solar energy
  • 0.4%Other fuel
Most commonly used house heating fuel in apartments in Lake Wylie, SC
  • 71.1%Electricity
  • 25.1%Utility gas
  • 3.7%Bottled, tank, or LP gas

Private vs. public school enrollment:

Students in private schools in grades 1 to 8 (elementary and middle school): 85
Here:

4.6%
South Carolina:

14.4%

Students in private schools in grades 9 to 12 (high school): 67
Here:

7.2%
South Carolina:

11.1%

Students in private undergraduate colleges: 156
Here:

45.5%
South Carolina:

21.9%
School Enrollment by Level of School for Male Students
School Enrollment by Level of School for Female Students
Age and Sex of Sensory-Disabled Noninstitutionalized Residents
Age and Sex of Physically-Disabled Noninstitutionalized Residents
Age and Sex of Mentally-Disabled Noninstitutionalized Residents
Age and Sex of Self-Care Disabled Noninstitutionalized Residents
Age and Sex of Go-Outside-Home Disabled Noninstitutionalized Residents
Age and Sex of Noninstitutionalized Residents with Employment Disability