Lake Magdalene, FL (Florida) Houses and Residents
| Lake Magdalene: | $381,705 |
| Florida: | $354,100 |
Mean price in 2022:
Detached houses: $554,384
Here: $554,384 State: $500,941 Townhouses or other attached units: $245,245
Here: $245,245 State: $370,869 In 3-to-4-unit structures: $178,797
Here: $178,797 State: $309,944 In 5-or-more-unit structures: $159,346
Here: $159,346 State: $447,145 Mobile homes: $48,675
Here: $48,675 State: $113,202
Total population: 28,509 (All urban)
Houses: 14,296 (13,337 occupied: 9,489 owner occupied, 3,904 renter occupied)
| % of renters here: | 29% |
| State: | 33% |
Housing density: 1,352 houses/condos per square mile
Median price asked for vacant for-sale houses and condos in 2022: $223,935.
Median contract rent in 2022: $1,229 (lower quartile is $1,039, upper quartile is $1,418)
Median rent asked for vacant for-rent units in 2022: $2,106
Median gross rent in Lake Magdalene, FL in 2022: $1,317
Housing units in Lake Magdalene with a mortgage: 5,654 (568 second mortgage, 58 home equity loan, 481 both second mortgage and home equity loan)
Houses without a mortgage: 107
Median household income for houses/condos with a mortgage: $101,734
Median household income for apartments without a mortgage: $75,065
Median monthly housing costs: $1,280
Compare current foreclosures near Lake Magdalene, FL:
| Photo | Address | Area | Beds / Baths | Price | Details |
|---|---|---|---|---|---|

|
#1
Cactus Needle Ln
Wesley Chapel, FL 33544
|
1,576 sq. feet
|
2 baths 3 beds |
$295,000
|
show details |

|
#2
Blue Magnolia Rd
Brandon, FL 33510
|
1,231 sq. feet
|
2 baths 2 beds |
$200,000
|
show details |

|
#3
Blazing Trail Way
Land O Lakes, FL 34639
|
2,486 sq. feet
|
3 baths 4 beds |
$409,900
|
show details |

|
#4
Oakridge Dr
Palm Harbor, FL 34685
|
2,344 sq. feet
|
3 baths 4 beds |
$710,000
|
show details |

|
#5
Bass St
Tampa, FL 33617
|
1,130 sq. feet
|
2 baths 3 beds |
show details | |

|
#6
Grasmere Dr
Land O Lakes, FL 34637
|
2,568 sq. feet
|
3 baths 4 beds |
show details | |

|
#7
E Giddens Ave
Tampa, FL 33610
|
1,210 sq. feet
|
2 baths 2 beds |
show details | |

|
#8
Freeport Rd
Riverview, FL 33578
|
2,172 sq. feet
|
2 baths 3 beds |
show details | |

|
#9
King Alfred Dr
Tampa, FL 33610
|
1,043 sq. feet
|
1 baths 3 beds |
show details | |

|
#10
Timberlane West Dr
Tampa, FL 33615
|
1,441 sq. feet
|
2 baths 3 beds |
show details |
| Photo | Address | Area | Beds / Baths | Price | Details |
|---|---|---|---|---|---|

|
#11
Temple Park Dr
Tampa, FL 33637
|
1,234 sq. feet
|
2 baths 3 beds |
show details | |

|
#12
Marsanne Pl
Riverview, FL 33578
|
3,293 sq. feet
|
3 baths 5 beds |
show details | |

|
#13
Dennison Dr
Tampa, FL 33619
|
1,716 sq. feet
|
2 baths 4 beds |
show details | |

|
#14
Swenson Ter
Lutz, FL 33549
|
1,816 sq. feet
|
2 baths 3 beds |
show details | |

|
#15
Julie Ln
Brandon, FL 33511
|
1,903 sq. feet
|
2 baths 2 beds |
show details | |

|
#16
Truman Dr
Seffner, FL 33584
|
1,243 sq. feet
|
2 baths 3 beds |
show details | |

|
#17
N Mulberry St
Tampa, FL 33612
|
1,708 sq. feet
|
2 baths 5 beds |
show details | |

|
#18
Winners Cir
Odessa, FL 33556
|
3,662 sq. feet
|
3 baths 5 beds |
show details | |

|
#19
Carol Dr
Wesley Chapel, FL 33543
|
1,860 sq. feet
|
2 baths 4 beds |
show details | |

|
#20
Lucerne Ave
Tampa, FL 33606
|
5,157 sq. feet
|
4 baths 4 beds |
show details |
| Photo | Address | Area | Beds / Baths | Price | Details |
|---|---|---|---|---|---|

|
#21
Cypress Haven Dr
Tampa, FL 33647
|
3,444 sq. feet
|
4 baths 5 beds |
show details | |

|
#22
S Swoope St
Tampa, FL 33616
|
1,036 sq. feet
|
2 baths 4 beds |
show details | |

|
#23
N 12th St
Tampa, FL 33604
|
1,160 sq. feet
|
1 baths 3 beds |
show details | |

|
#24
N 21st St
Tampa, FL 33605
|
1,250 sq. feet
|
2 baths 3 beds |
show details | |

|
#25
Corvette Dr
Tampa, FL 33624
|
1,404 sq. feet
|
1 baths 2 beds |
show details | |

|
#26
Luce Dr N
Clearwater, FL 33761
|
2,413 sq. feet
|
4 baths 4 beds |
show details | |

|
#27
Galewood Cir
Tampa, FL 33615
|
1,445 sq. feet
|
1 baths 2 beds |
show details | |

|
#28
Dew Bloom Rd
Valrico, FL 33594
|
1,318 sq. feet
|
2 baths 3 beds |
show details | |

|
#29
Harbor Hill Dr
Safety Harbor, FL 34695
|
1,227 sq. feet
|
1 baths 2 beds |
show details | |

|
#30
Tughill Dr
Tampa, FL 33624
|
2,124 sq. feet
|
2 baths 4 beds |
show details |
| Photo | Address | Area | Beds / Baths | Price | Details |
|---|---|---|---|---|---|

|
#31
Lancer Dr
Tampa, FL 33618
|
1,452 sq. feet
|
2 baths 3 beds |
show details | |

|
#32
Hillpoint Way
Brandon, FL 33510
|
1,671 sq. feet
|
2 baths 4 beds |
show details | |

|
#33
W Patterson St
Tampa, FL 33615
|
1,373 sq. feet
|
1 baths 1 beds |
show details | |

|
#34
N 53rd St
Tampa, FL 33619
|
1,200 sq. feet
|
2 baths 3 beds |
show details | |

|
#35
Driesler Cir
Tampa, FL 33634
|
1,000 sq. feet
|
1 baths 3 beds |
show details | |

|
#36
E 23rd Ave
Tampa, FL 33605
|
1,372 sq. feet
|
1 baths 3 beds |
show details | |

|
#37
Manassas Rd
Tampa, FL 33635
|
1,551 sq. feet
|
2 baths 3 beds |
show details | |

|
#38
Monte Rio St
New Port Richey, FL 34655
|
2,103 sq. feet
|
2 baths 3 beds |
show details | |

|
#39
N Jefferson St
Tampa, FL 33602
|
1,464 sq. feet
|
2 baths 4 beds |
show details | |

|
#40
Beachdrop Pl
Tampa, FL 33647
|
1,782 sq. feet
|
2 baths 4 beds |
show details |
| Photo | Address | Area | Beds / Baths | Price | Details |
|---|---|---|---|---|---|

|
#41
Ashfield Ct
Tampa, FL 33615
|
1,248 sq. feet
|
2 baths 3 beds |
show details | |

|
#42
E 10th Ave
Tampa, FL 33605
|
1,254 sq. feet
|
2 baths 3 beds |
show details | |

|
#43
Riverboat Dr
Tampa, FL 33637
|
1,496 sq. feet
|
2 baths 4 beds |
show details | |

|
#44
W Saint Conrad St
Tampa, FL 33607
|
1,152 sq. feet
|
1 baths 2 beds |
show details | |

|
#45
Queen Brooks Ct
Tampa, FL 33637
|
1,262 sq. feet
|
2 baths 3 beds |
show details | |

|
#46
Richmond Place Dr Apt 1211
Tampa, FL 33647
|
1,083 sq. feet
|
2 baths 2 beds |
show details | |

|
#47
N 36th St
Tampa, FL 33610
|
884 sq. feet
|
1 baths 2 beds |
show details | |

|
#48
Carlsdale Dr
Riverview, FL 33578
|
1,387 sq. feet
|
2 baths 3 beds |
show details | |

|
#49
Bridgeton Dr
Tampa, FL 33626
|
2,123 sq. feet
|
2 baths 4 beds |
show details | |

|
Check over 1 million property listings on Foreclosure.com!
|
browse all offers | |||


 | 120-150s houses? (43 replies) |
| The Tampa Housing Bubble 2.0 Thread (206 replies) |
| Least Brutal Commute? (16 replies) |
| moving soon need opinions on apartment rentals (2 replies) |
| house with mature trees (78 replies) |
| Low Rent in Safe Area (27 replies) |

Median year apartment built: 1983
Household type by relationship:
Households: 32,507- Male householders: 6,588 (1,922 living alone), Female householders: 6,671 (2,124 living alone)
6,094 spouses (6,004 opposite-sex spouses), 1,177 unmarried partners, (1,105 opposite-sex unmarried partners), 8,501 children (8,137 natural, 163 adopted, 199 stepchildren), 260 grandchildren, 615 brothers or sisters, 771 parents, 19 foster children, 316 other relatives, 905 non-relatives
- In group quarters: 584
Size of family households: 3,962 2-persons, 2,120 3-persons, 1,578 4-persons, 292 5-persons, 365 6-persons, 131 7-or-more-persons.
Size of nonfamily households: 3,893 1-person, 882 2-persons, 71 3-persons, 24 4-persons.
4,253 married couples with children.
1,863 single-parent households (574 men, 1,289 women).
75.1% of residents of Lake Magdalene speak English at home.
18.5% of residents speak Spanish at home (56% speak English very well, 20% speak English well, 14% speak English not well, 10% don't speak English at all).
3.2% of residents speak other Indo-European language at home (72% speak English very well, 19% speak English well, 10% speak English not well).
2.8% of residents speak Asian or Pacific Island language at home (57% speak English very well, 20% speak English well, 16% speak English not well, 7% don't speak English at all).
0.2% of residents speak other language at home (76% speak English very well, 24% speak English well).
Foreign born population: 5,737 (17.6%)
(57.9% of them are naturalized citizens)
| Here: | 6.5 |
| State: | 5.9 |
| Here: | 3.7 |
| State: | 4.2 |

- Bedrooms in owner-occupied houses and condos in Lake Magdalene, Florida
- 70no bedroom
- 1601 bedroom
- 1,7412 bedrooms
- 4,1513 bedrooms
- 2,8654 bedrooms
- 5025+ bedrooms

- Bedrooms in renter-occupied apartments in Lake Magdalene, Florida
- 459no bedroom
- 1,1951 bedroom
- 1,5902 bedrooms
- 4273 bedrooms
- 2044 bedrooms
- 295+ bedrooms

- Cars and other vehicles available in Lake Magdalene in owner-occupied houses/condos
- 239no vehicle
- 2,7171 vehicle
- 4,9012 vehicles
- 1,2193 vehicles
- 2674 vehicles
- 1465+ vehicles

- Cars and other vehicles available in Lake Magdalene in renter-occupied apartments
- 499no vehicle
- 1,9951 vehicle
- 1,1042 vehicles
- 2823 vehicles
- 244 vehicles
- 05+ vehicles

- Rooms in owner-occupied houses in Lake Magdalene, Florida
- 601 room
- 592 rooms
- 3053 rooms
- 1,0664 rooms
- 1,6095 rooms
- 1,6346 rooms
- 1,7647 rooms
- 1,3258 rooms
- 1,6669+ rooms

- Rooms in renter-occupied apartments in Lake Magdalene, Florida
- 4441 room
- 3412 rooms
- 8563 rooms
- 1,2304 rooms
- 4635 rooms
- 2836 rooms
- 1507 rooms
- 688 rooms
- 699+ rooms


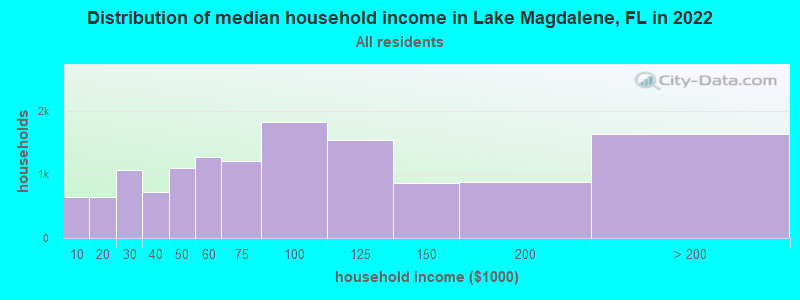
Lake Magdalene, FL household income distribution

- 641Less than $10,000
- 645$10,000 to $19,999
- 1,065$20,000 to $29,999
- 723$30,000 to $39,999
- 1,094$40,000 to $49,999
- 1,274$50,000 to $59,999
- 1,213$60,000 to $74,999
- 1,822$75,000 to $99,999
- 1,533$100,000 to $124,999
- 870$125,000 to $149,999
- 872$150,000 to $199,999
- 1,635$200,000 or more
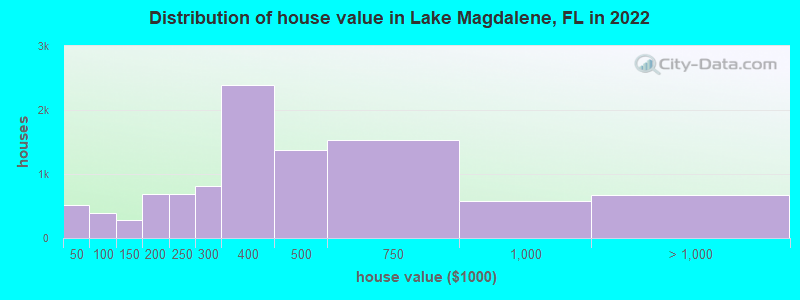
Home value of owner - occupied houses in 2022 in Lake Magdalene, FL
-
- 214Less than $10,000
- 45$10,000 to $14,999
- 10$15,000 to $19,999
- 24$20,000 to $24,999
- 61$25,000 to $29,999
- 26$30,000 to $34,999
- 22$35,000 to $39,999
- 117$40,000 to $49,999
- 24$50,000 to $59,999
- 64$60,000 to $69,999
- 79$70,000 to $79,999
- 64$80,000 to $89,999
- 36$90,000 to $99,999
- 144$100,000 to $124,999
- 134$125,000 to $149,999
- 460$150,000 to $174,999
- 230$175,000 to $199,999
- 692$200,000 to $249,999
- 810$250,000 to $299,999
- 2,386$300,000 to $399,999
- 1,372$400,000 to $499,999
- 1,537$500,000 to $749,999
- 578$750,000 to $999,999
- 254$1,000,000 to $1,499,999
- 190$1,500,000 to $1,999,999
- 230$2,000,000 or more
Rent paid by renters in 2022 in Lake Magdalene, FL
-
- 9$100 to $149
- 12$150 to $199
- 5$250 to $299
- 7$450 to $499
- 13$500 to $549
- 16$550 to $599
- 31$600 to $649
- 17$650 to $699
- 62$700 to $749
- 44$750 to $799
- 206$800 to $899
- 402$900 to $999
- 1,370$1,000 to $1,249
- 540$1,250 to $1,499
- 386$1,500 to $1,999
- 50$2,500 to $2,999
- 10$3,000 to $3,499
- 55$3,500 or more
- 128No cash rent


Percentage of workers working in this county: 89.0%
Number of people working at home: 3,190 (19.4% of all workers)
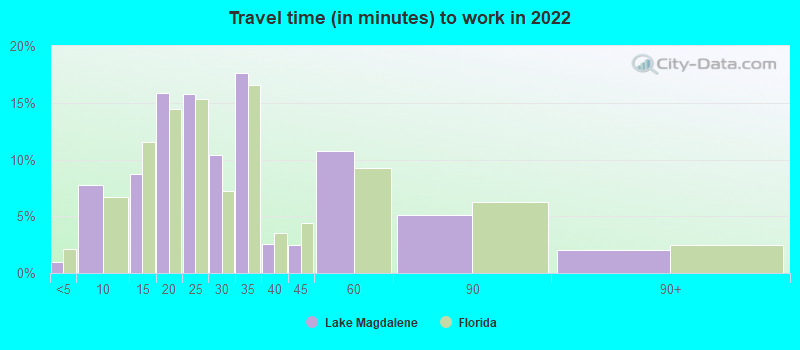
Travel time to work (commute)
- Less than 5 minutes: 303
- 5 to 9 minutes: 672
- 10 to 14 minutes: 1,036
- 15 to 19 minutes: 1,602
- 20 to 24 minutes: 2,360
- 25 to 29 minutes: 1,064
- 30 to 34 minutes: 2,352
- 35 to 39 minutes: 761
- 40 to 44 minutes: 743
- 45 to 59 minutes: 1,304
- 60 to 89 minutes: 685
- 90 or more minutes: 131
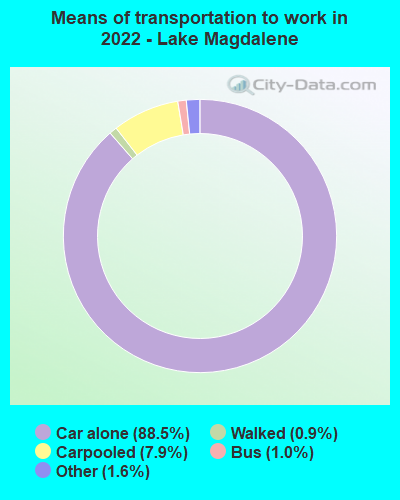
Means of transportation to work:
- Drove a car alone: 7,730 (65.7%)
- Carpooled: 787 (6.7%)
- Bus: 62 (0.5%)
- Taxi: 163 (1.4%)
- Walked: 77 (0.7%)
- Worked at home: 3,190 (27.1%)

- Unemployment by race in 2022
- Unemployment rate for White non-Hispanic residents
- 4.4%Males
- 1.4%Females
- Unemployment rate for Black residents
- 1.1%Males
- 2.9%Females
- Unemployment rate for Asian residents
- 9.8%Males
- Unemployment rate for other race residents
- 1.0%Males
- 14.1%Females
- Unemployment rate for two or more race residents
- 2.1%Males
- 1.2%Females
- Unemployment rate for Hispanic or Latino residents
- 0.8%Males
- 3.0%Females

- Year of entry for the foreign-born population in Lake Magdalene, Florida
- 2,5462010 or later
- 1,0412000 to 2009
- 8721990 to 1999
- 5711980 to 1989
- 5481970 to 1979
- 724Before 1970

First ancestries reported:
- English: 1,584 (8.7%)
- Italian: 1,391 (7.7%)
- American: 1,328 (7.3%)
- Irish: 1,166 (6.4%)
- German: 1,071 (5.9%)
- Polish: 270 (1.5%)
- Turkish: 248 (1.4%)
- Eastern European: 229 (1.3%)
- European: 167 (0.9%)
- Scottish: 136 (0.7%)
- Swedish: 112 (0.6%)
- British: 99 (0.5%)
- Scotch-Irish: 83 (0.5%)
- Haitian: 80 (0.4%)
- Brazilian: 80 (0.4%)
- Jamaican: 79 (0.4%)
- Dutch: 71 (0.4%)
- French: 65 (0.4%)
- U.S. Virgin Islander: 49 (0.3%)
- Greek: 43 (0.2%)
- Norwegian: 43 (0.2%)
- Basque: 38 (0.2%)
- Canadian: 33 (0.2%)
- Bahamian: 32 (0.2%)
- Barbadian: 32 (0.2%)
- Lebanese: 27 (0.1%)
- French Canadian: 27 (0.1%)
- Ukrainian: 27 (0.1%)
- Russian: 23 (0.1%)
- Slavic: 21 (0.1%)
- Portuguese: 19 (0.1%)
- Moroccan: 19 (0.1%)
- Croatian: 18 (0.10%)
- Latvian: 15 (0.08%)
- Czech: 15 (0.08%)
- Hungarian: 13 (0.07%)
- Egyptian: 12 (0.07%)
- Northern European: 11 (0.06%)
- Iranian: 9 (0.05%)
- Romanian: 9 (0.05%)
- Swiss: 9 (0.05%)
- Austrian: 7 (0.04%)
- Welsh: 7 (0.04%)
- Finnish: 5 (0.03%)
- Danish: 5 (0.03%)
- Czechoslovakian: 2 (0.01%)
Most common places of birth for foreign-born residents (%):
| Lake Magdalene: | 21.4% (1,177) |
| Florida: | 22.0% (1,006,576) |
| Lake Magdalene: | 6.8% (374) |
| Florida: | 5.7% (262,042) |
| Lake Magdalene: | 6.4% (354) |
| Florida: | 6.5% (298,669) |
| Lake Magdalene: | 5.8% (321) |
| Florida: | 2.3% (107,160) |
| Lake Magdalene: | 4.5% (247) |
| Florida: | 5.6% (257,152) |
| Lake Magdalene: | 4.5% (246) |
| Florida: | 0.2% (10,969) |
| Lake Magdalene: | 4.3% (236) |
| Florida: | 3.0% (137,727) |
| Lake Magdalene: | 3.4% (188) |
| Florida: | 1.3% (60,604) |
| Lake Magdalene: | 3.3% (184) |
| Florida: | 2.1% (96,693) |
| Lake Magdalene: | 2.9% (161) |
| Florida: | 2.1% (94,349) |
| Lake Magdalene: | 2.1% (118) |
| Florida: | 5.0% (227,319) |
| Lake Magdalene: | 2.1% (118) |
| Florida: | 0.5% (22,972) |
| Lake Magdalene: | 2.1% (116) |
| Florida: | 2.7% (122,906) |
| Lake Magdalene: | 2.1% (115) |
| Florida: | 2.4% (109,132) |
| Lake Magdalene: | 2.0% (109) |
| Florida: | 1.2% (54,272) |
| Lake Magdalene: | 1.7% (96) |
| Florida: | 0.2% (11,243) |
| Lake Magdalene: | 1.7% (92) |
| Florida: | 2.3% (105,066) |
Place of birth for U.S.-born residents:
- This state: 13,562
- Other state: 12,034
- Northeast: 4,700
- Midwest: 3,214
- South: 3,345
- West: 727
91.1% of Lake Magdalene residents lived in the same house 1 years ago.
Out of people who lived in different houses, 40.7% lived in this county.
Out of people who lived in different counties, 49.1% lived in Florida.
| Lake Magdalene: | 91.1% |
| State average: | 86.3% |
Education attainment for males 25 years and older:
- No schooling: 124
- Nursery to 4th grade: 26
- 5th and 6th grade: 20
- 7th and 8th grade: 5
- 9th grade: 136
- 10th grade: 196
- 11th grade: 25
- 12th grade, no diploma: 226
- High school graduate (or equivalency): 2,835
- Less than 1 year of college: 900
- Some college more than 1 year, no degree: 1,104
- Associate degree: 1,659
- Bachelor's degree: 2,676
- Master's degree: 932
- Professional school degree: 605
- Doctorate degree: 184

Education attainment for females 25 years and older:
- No schooling: 93
- Nursery to 4th grade: 5
- 5th and 6th grade: 77
- 7th and 8th grade: 19
- 9th grade: 57
- 10th grade: 103
- 11th grade: 157
- 12th grade, no diploma: 238
- High school graduate (or equivalency): 3,362
- Less than 1 year of college: 633
- Some college more than 1 year, no degree: 1,214
- Associate degree: 1,245
- Bachelor's degree: 3,186
- Master's degree: 1,593
- Professional school degree: 202
- Doctorate degree: 209


Housing units in structures:
- One, detached: 8,751
- One, attached: 1,051
- Two: 44
- 3 or 4: 837
- 5 to 9: 928
- 10 to 19: 878
- 20 to 49: 430
- 50 or more: 535
- Mobile homes: 772
- Boats, RVs, vans, etc.: 66
Housing units lacking complete kitchen facilities in 2022: 2.4%
House/condo owner moved in on average 10 years ago
Renter moved in on average 3 years ago

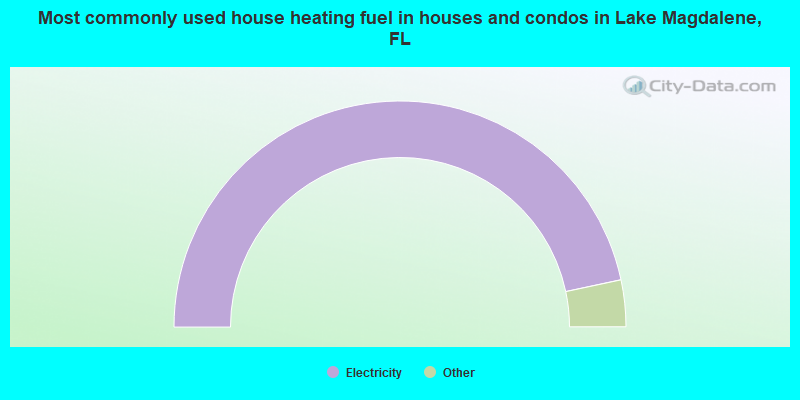
- 93.3%Electricity
- 3.6%Utility gas
- 1.1%No fuel used
- 1.1%Bottled, tank, or LP gas
- 0.9%Solar energy
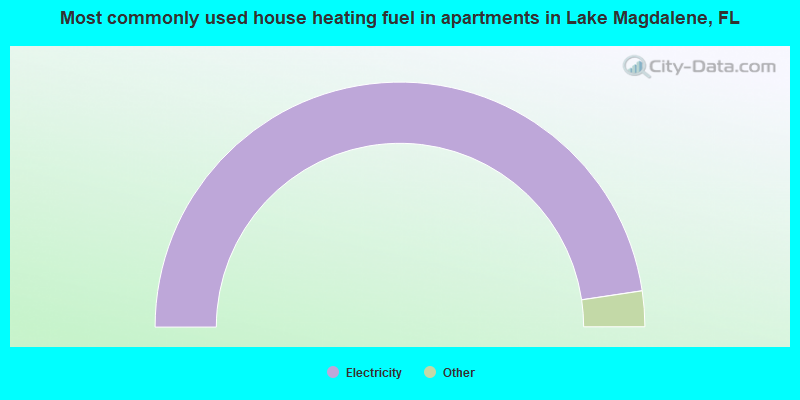
- 95.3%Electricity
- 3.3%Utility gas
- 1.2%No fuel used
- 0.1%Solar energy
Private vs. public school enrollment:
| Here: | 16.5% |
| Florida: | 15.8% |
| Here: | 23.5% |
| Florida: | 12.9% |
| Here: | 10.7% |
| Florida: | 23.6% |


