Jump to a detailed profile or search site with Google Custom Search

La Riviera, CA (California) Houses and Residents

Estimated median house or condo value in 2022: $448,952 (it was $129,800 in 2000)
La Riviera:

$448,952
California:

$715,900
Lower value quartile - upper value quartile: $366,009 - $545,554

Mean price in 2022:

Detached houses: $423,742
Here:

$423,742
State:

$988,808

Townhouses or other attached units: $235,066
Here:

$235,066
State:

$838,546

In 3-to-4-unit structures: $146,642
Here:

$146,642
State:

$824,253

Total population: 10,802 (Urban population: 10,273, Rural population: 0)

Houses: 4,842 (4,600 occupied: 2,727 owner occupied, 1,863 renter occupied)

% of renters here:

41%
State:

44%

Housing density: 2,663 houses/condos per square mile

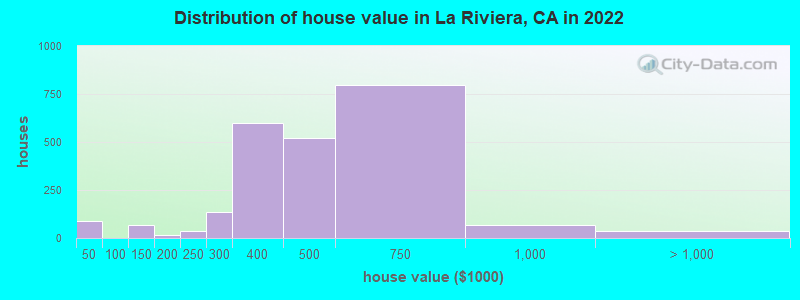
Median price asked for vacant for-sale houses and condos in 2022: $796,938.

Median contract rent in 2022: $1,626 (lower quartile is $1,380, upper quartile is $1,880)


Median rent asked for vacant for-rent units in 2022: $5,025


Median gross rent in La Riviera, CA in 2022: $1,764

Housing units in La Riviera with a mortgage: 1,850 (161 second mortgage, 0 home equity loan, 109 both second mortgage and home equity loan)
Houses without a mortgage: 0

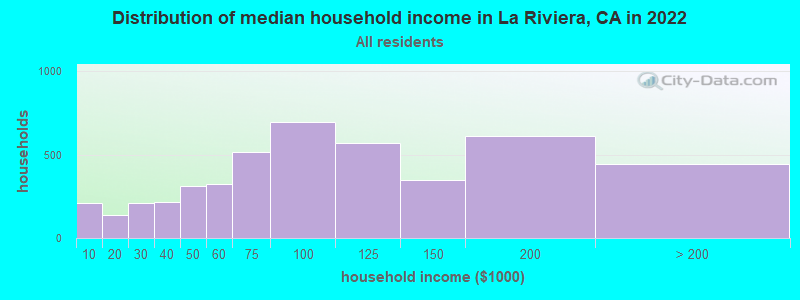
Median household income for houses/condos with a mortgage: $118,768

Median household income for apartments without a mortgage: $85,162

Median monthly housing costs: $1,650

Compare current foreclosures near La Riviera, CA:

Check out more offers near La Riviera, CA.
Powered by Foreclosure.com

Settings
X
Data:
Loading data...
Based on 2000-2022 data
Loading data...

123
Hide US histogram

La Riviera, California Age and Sex of Residents
Median year house/condo built: 1974

Median year apartment built: 1976

Household type by relationship:

Households: 11,688
  • Male householders: 2,200 (485 living alone), Female householders: 2,333 (623 living alone)
  • 1,841 spouses (1,841 opposite-sex spouses), 606 unmarried partners, (496 opposite-sex unmarried partners), 2,980 children (2,800 natural, 59 adopted, 120 stepchildren), 109 grandchildren, 191 brothers or sisters, 173 parents, 0 foster children, 194 other relatives, 953 non-relatives
  • In group quarters: 102

Size of family households: 1,267 2-persons, 736 3-persons, 454 4-persons, 114 5-persons, 138 6-persons, 24 7-or-more-persons.

Size of nonfamily households: 1,162 1-person, 483 2-persons, 79 3-persons, 94 4-persons, 3 6-persons.

1,566 married couples with children.
630 single-parent households (312 men, 318 women).

75.9% of residents of La Riviera speak English at home.
8.8% of residents speak Spanish at home (74% speak English very well, 13% speak English well, 6% speak English not well, 7% don't speak English at all).
5.1% of residents speak other Indo-European language at home (53% speak English very well, 31% speak English well, 10% speak English not well, 6% don't speak English at all).
6.5% of residents speak Asian or Pacific Island language at home (61% speak English very well, 17% speak English well, 12% speak English not well, 10% don't speak English at all).
2.5% of residents speak other language at home (82% speak English very well, 5% speak English well, 14% speak English not well).

Foreign born population: 1,626 (13.9%)
(64.9% of them are naturalized citizens)

Median number of rooms in houses and condos:
Here:

5.8
State:

6.0

Median number of rooms in apartments
Here:

4.3
State:

3.9

Owner-occupied Renter-occupied
Bedrooms in owner-occupied houses and condos in La Riviera, California
  • Bedrooms in owner-occupied houses and condos in La Riviera, California
  • 0no bedroom
  • 101 bedroom
  • 1562 bedrooms
  • 1,6173 bedrooms
  • 8784 bedrooms
  • 665+ bedrooms
Bedrooms in renter-occupied apartments in La Riviera, California
  • Bedrooms in renter-occupied apartments in La Riviera, California
  • 27no bedroom
  • 4541 bedroom
  • 5492 bedrooms
  • 5823 bedrooms
  • 2524 bedrooms
  • 05+ bedrooms
Owner-occupied Renter-occupied
Cars and other vehicles available in La Riviera in owner-occupied houses/condos
  • Cars and other vehicles available in La Riviera in owner-occupied houses/condos
  • 11no vehicle
  • 7931 vehicle
  • 1,4592 vehicles
  • 3373 vehicles
  • 914 vehicles
  • 365+ vehicles
Cars and other vehicles available in La Riviera in renter-occupied apartments
  • Cars and other vehicles available in La Riviera in renter-occupied apartments
  • 136no vehicle
  • 6801 vehicle
  • 6712 vehicles
  • 2273 vehicles
  • 1324 vehicles
  • 185+ vehicles
Owner-occupied Renter-occupied
Rooms in owner-occupied houses in La Riviera, California
  • Rooms in owner-occupied houses in La Riviera, California
  • 01 room
  • 102 rooms
  • 163 rooms
  • 2144 rooms
  • 8365 rooms
  • 8746 rooms
  • 4407 rooms
  • 2238 rooms
  • 1149+ rooms
Rooms in renter-occupied apartments in La Riviera, California
  • Rooms in renter-occupied apartments in La Riviera, California
  • 271 room
  • 1962 rooms
  • 2973 rooms
  • 4664 rooms
  • 3485 rooms
  • 2806 rooms
  • 1687 rooms
  • 488 rooms
  • 349+ rooms
Year house built
Median 2022 house/condo value by year built
Median house/condo value by year householder moved into unit
Breakdown of mean house values by ages of householders
Owners and renters by unit type in La Riviera, CA
  • La Riviera, CA household income distribution

  • Distribution of median household income in La Riviera, CA in 2022
  • 208Less than $10,000
  • 141$10,000 to $19,999
  • 210$20,000 to $29,999
  • 217$30,000 to $39,999
  • 310$40,000 to $49,999
  • 324$50,000 to $59,999
  • 519$60,000 to $74,999
  • 696$75,000 to $99,999
  • 568$100,000 to $124,999
  • 347$125,000 to $149,999
  • 612$150,000 to $199,999
  • 444$200,000 or more
  • Home value of owner - occupied houses in 2022 in La Riviera, CA

  • Distribution of house value in La Riviera, CA in 2022
  • 61Less than $10,000
  • 12$25,000 to $29,999
  • 15$30,000 to $34,999
  • 60$100,000 to $124,999
  • 5$125,000 to $149,999
  • 6$150,000 to $174,999
  • 8$175,000 to $199,999
  • 35$200,000 to $249,999
  • 136$250,000 to $299,999
  • 596$300,000 to $399,999
  • 521$400,000 to $499,999
  • 795$500,000 to $749,999
  • 66$750,000 to $999,999
  • 6$1,000,000 to $1,499,999
  • 6$1,500,000 to $1,999,999
  • 21$2,000,000 or more
  • Rent paid by renters in 2022 in La Riviera, CA

  • Distribution of rent paid by renters in La Riviera, CA in 2022
  • 8$100 to $149
  • 39$700 to $749
  • 11$800 to $899
  • 61$900 to $999
  • 146$1,000 to $1,249
  • 490$1,250 to $1,499
  • 888$1,500 to $1,999
  • 182$2,000 to $2,499
  • 55No cash rent
Time Leaving Home To Go To Work in 2022

Percentage of workers working in this county: 86.3%
Number of people working at home: 1,444 (22.1% of all workers)

Travel time (in minutes) to work in 2022

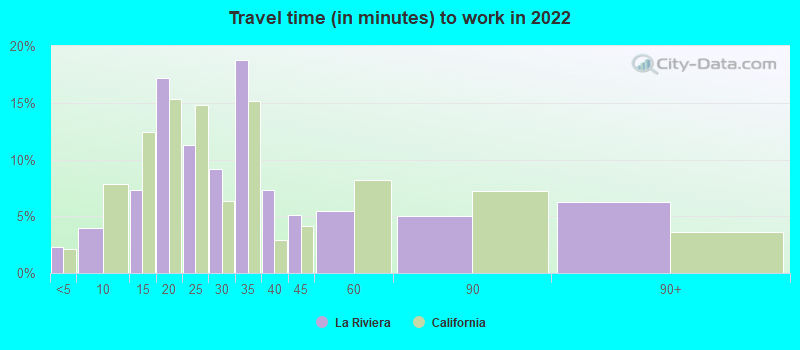
Travel time to work (commute)

  • Less than 5 minutes: 24
  • 5 to 9 minutes: 214
  • 10 to 14 minutes: 599
  • 15 to 19 minutes: 1,253
  • 20 to 24 minutes: 1,227
  • 25 to 29 minutes: 373
  • 30 to 34 minutes: 670
  • 35 to 39 minutes: 90
  • 40 to 44 minutes: 64
  • 45 to 59 minutes: 181
  • 60 to 89 minutes: 168
  • 90 or more minutes: 308
Means of transportation to work in 2022 - La Riviera

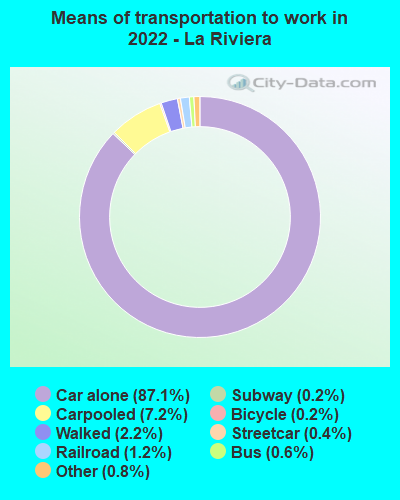
Means of transportation to work:

  • Drove a car alone: 4,432 (68.4%)
  • Carpooled: 378 (5.8%)
  • Bus: 16 (0.2%)
  • Subway or elevated rail: 12 (0.2%)
  • Long-distance train or commuter rail: 6 (0.1%)
  • Light rail, streetcar or trolley: 37 (0.6%)
  • Taxi: 52 (0.8%)
  • Bicycle: 8 (0.1%)
  • Walked: 127 (2.0%)
  • Worked at home: 1,444 (22.3%)
Class of Workers in 2022
  • Unemployment by race in 2022
  • Unemployment rate for White non-Hispanic residents
  • 5.7%Males
  • 1.8%Females
  • Unemployment rate for Black residents
  • 2.9%Males
  • 7.3%Females
  • Unemployment rate for other race residents
  • 0.7%Males
  • 4.1%Females
  • Unemployment rate for Hispanic or Latino residents
  • 0.8%Males
  • 2.9%Females
Year of entry for the foreign-born population in La Riviera, California
  • Year of entry for the foreign-born population in La Riviera, California
  • 4912010 or later
  • 2052000 to 2009
  • 3931990 to 1999
  • 3201980 to 1989
  • 2831970 to 1979
  • 301Before 1970
Ancestries in La Riviera, CA

First ancestries reported:

  • American: 351 (6.5%)
  • German: 296 (5.5%)
  • English: 181 (3.3%)
  • Irish: 179 (3.3%)
  • European: 135 (2.5%)
  • Russian: 92 (1.7%)
  • Italian: 76 (1.4%)
  • Afghan: 69 (1.3%)
  • Moroccan: 69 (1.3%)
  • Norwegian: 68 (1.3%)
  • African: 54 (1.0%)
  • Scottish: 53 (1.0%)
  • Ukrainian: 34 (0.6%)
  • Portuguese: 30 (0.6%)
  • French: 29 (0.5%)
  • Belgian: 28 (0.5%)
  • Nigerian: 28 (0.5%)
  • Arab: 26 (0.5%)
  • British: 25 (0.5%)
  • Scotch-Irish: 18 (0.3%)
  • Northern European: 17 (0.3%)
  • Assyrian: 16 (0.3%)
  • Swedish: 16 (0.3%)
  • Hungarian: 15 (0.3%)
  • Polish: 14 (0.3%)
  • Finnish: 13 (0.2%)
  • Ethiopian: 12 (0.2%)
  • Jordanian: 10 (0.2%)
  • Cajun: 9 (0.2%)
  • Danish: 8 (0.1%)
  • Iranian: 8 (0.1%)
  • Eastern European: 7 (0.1%)
  • French Canadian: 6 (0.1%)
  • Austrian: 3 (0.06%)
  • Serbian: 3 (0.06%)

Most common places of birth for foreign-born residents (%):

Mexico
La Riviera:

13.2% (208)
California:

37.2% (3,881,193)

Afghanistan
La Riviera:

9.6% (151)
California:

0.5% (53,260)

El Salvador
La Riviera:

6.0% (95)
California:

4.2% (440,287)

Korea
La Riviera:

5.8% (91)
California:

3.0% (315,248)

China, excluding Hong Kong and Taiwan
La Riviera:

5.4% (86)
California:

6.6% (684,672)

Guatemala
La Riviera:

5.1% (80)
California:

2.8% (290,436)

Taiwan
La Riviera:

4.9% (78)
California:

1.7% (176,274)

Vietnam
La Riviera:

4.2% (67)
California:

4.9% (512,335)

Philippines
La Riviera:

3.7% (58)
California:

7.8% (818,297)

Ethiopia
La Riviera:

2.7% (43)
California:

0.2% (24,635)

Russia
La Riviera:

2.7% (43)
California:

0.7% (71,932)

Morocco
La Riviera:

2.5% (39)
California:

0.1% (6,612)

India
La Riviera:

2.5% (39)
California:

5.2% (539,184)

Fiji
La Riviera:

2.5% (39)
California:

0.3% (33,937)

Cuba
La Riviera:

2.4% (38)
California:

0.3% (30,441)

Cameroon
La Riviera:

2.2% (34)
California:

0.0% (3,174)

Oceania, n.e.c.
La Riviera:

2.0% (31)
California:

0.2% (18,925)

Nigeria
La Riviera:

1.8% (28)
California:

0.3% (35,557)

Germany
La Riviera:

1.8% (28)
California:

0.7% (73,304)

Ukraine
La Riviera:

1.6% (26)
California:

0.6% (60,761)

Senegal
La Riviera:

1.6% (25)
California:

0.0% (1,615)

Thailand
La Riviera:

1.5% (24)
California:

0.6% (65,335)

Place of birth for U.S.-born residents:

  • This state: 8,077
  • Other state: 1,841
  • Northeast: 319
  • Midwest: 482
  • South: 621
  • West: 419

77.6% of La Riviera residents lived in the same house 1 years ago.
   Out of people who lived in different houses, 40.8% lived in this county.
   Out of people who lived in different counties, 76.2% lived in California.


La Riviera:

77.6%
State average:

88.9%

Education attainment for males 25 years and older:

  • No schooling: 132
  • Nursery to 4th grade: 0
  • 5th and 6th grade: 15
  • 7th and 8th grade: 0
  • 9th grade: 16
  • 10th grade: 22
  • 11th grade: 27
  • 12th grade, no diploma: 111
  • High school graduate (or equivalency): 1,041
  • Less than 1 year of college: 323
  • Some college more than 1 year, no degree: 907
  • Associate degree: 285
  • Bachelor's degree: 892
  • Master's degree: 339
  • Professional school degree: 88
  • Doctorate degree: 39
Educational Attainment for Males

Education attainment for females 25 years and older:

  • No schooling: 109
  • Nursery to 4th grade: 0
  • 5th and 6th grade: 8
  • 7th and 8th grade: 13
  • 9th grade: 7
  • 10th grade: 33
  • 11th grade: 23
  • 12th grade, no diploma: 26
  • High school graduate (or equivalency): 846
  • Less than 1 year of college: 238
  • Some college more than 1 year, no degree: 515
  • Associate degree: 570
  • Bachelor's degree: 1,027
  • Master's degree: 330
  • Professional school degree: 86
  • Doctorate degree: 90
Educational Attainment for Females
La Riviera marital status for males
La Riviera marital status for females

Housing units in structures:

  • One, detached: 3,098
  • One, attached: 594
  • Two: 38
  • 3 or 4: 365
  • 5 to 9: 166
  • 10 to 19: 79
  • 20 to 49: 58
  • 50 or more: 434
  • Mobile homes: 7
Housing units lacking complete kitchen facilities in 2022: 2.8%

House/condo owner moved in on average 13 years ago

Renter moved in on average 1 years ago

Year householders moved into residence in La Riviera
Houses and condos Apartments
Most commonly used house heating fuel in houses and condos in La Riviera, CA
  • 82.3%Utility gas
  • 15.9%Electricity
  • 1.2%Bottled, tank, or LP gas
  • 0.6%Solar energy
Most commonly used house heating fuel in apartments in La Riviera, CA
  • 54.7%Electricity
  • 43.0%Utility gas
  • 1.9%No fuel used
  • 0.5%Bottled, tank, or LP gas

Private vs. public school enrollment:

Students in private schools in grades 1 to 8 (elementary and middle school): 144
Here:

11.1%
California:

10.5%

Students in private schools in grades 9 to 12 (high school): 61
Here:

16.6%
California:

8.5%

Students in private undergraduate colleges: 74
Here:

7.1%
California:

15.9%
School Enrollment by Level of School for Male Students
School Enrollment by Level of School for Female Students
Age and Sex of Sensory-Disabled Noninstitutionalized Residents
Age and Sex of Physically-Disabled Noninstitutionalized Residents
Age and Sex of Mentally-Disabled Noninstitutionalized Residents
Age and Sex of Self-Care Disabled Noninstitutionalized Residents
Age and Sex of Go-Outside-Home Disabled Noninstitutionalized Residents
Age and Sex of Noninstitutionalized Residents with Employment Disability