La Grande, OR (Oregon) Houses and Residents
| La Grande: | $257,190 |
| Oregon: | $475,600 |
Total population: 13,026 (Urban population: 12,187 (all inside urban clusters), Rural population: 66 (all nonfarm))
Houses: 5,790 (5,383 occupied: 2,874 owner occupied, 2,533 renter occupied)
| % of renters here: | 47% |
| State: | 37% |
Housing density: 1,331 houses/condos per square mile
Median price asked for vacant for-sale houses and condos in 2022: $285,523.
Median contract rent in 2022: $766 (lower quartile is $567, upper quartile is $999)
Median rent asked for vacant for-rent units in 2022: $868
Median gross rent in La Grande, OR in 2022: $908
Housing units in La Grande with a mortgage: 1,676 (146 second mortgage, 6 home equity loan, 132 both second mortgage and home equity loan)
Houses without a mortgage: 28
Median household income for houses/condos with a mortgage: $80,991
Median household income for apartments without a mortgage: $64,079
Median monthly housing costs: $933
Compare current foreclosures near La Grande, OR:
| Photo | Address | Area | Beds / Baths | Price | Details |
|---|---|---|---|---|---|

|
#1
22nd St
La Grande, OR 97850
|
2,043 sq. feet
|
2 baths 3 beds |
show details | |

|
#2
Lane Ave
La Grande, OR 97850
|
1,396 sq. feet
|
1 baths 5 beds |
show details | |

|
#3
E N Ave
La Grande, OR 97850
|
1,104 sq. feet
|
1 baths 2 beds |
show details | |

|
#4
N Umatilla St
La Grande, OR 97850
|
1,248 sq. feet
|
2 baths 3 beds |
show details | |

|
#5
2nd St
La Grande, OR 97850
|
1,647 sq. feet
|
1 baths 2 beds |
show details | |

|
#6
Chestnut St Apt 218
La Grande, OR 97850
|
- sq. feet
|
- baths - beds |
show details | |

|
#7
26th St Unit 11
La Grande, OR 97850
|
- sq. feet
|
- baths - beds |
show details | |

|
#8
16th St
La Grande, OR 97850
|
- sq. feet
|
- baths - beds |
show details | |

|
#9
E Q Ave Apt 2
La Grande, OR 97850
|
- sq. feet
|
- baths - beds |
show details | |

|
#10
22nd St
La Grande, OR 97850
|
- sq. feet
|
- baths - beds |
show details |
| Photo | Address | Area | Beds / Baths | Price | Details |
|---|---|---|---|---|---|

|
#11
Aries Ln
La Grande, OR 97850
|
- sq. feet
|
- baths - beds |
show details | |

|
#12
Wallowa Lake Highway, Building C
La Grande, OR 97850
|
- sq. feet
|
- baths - beds |
show details | |

|
#13
Jefferson Ave
La Grande, OR 97850
|
- sq. feet
|
- baths - beds |
show details | |

|
#14
Grays Corner Rd
Cove, OR 97824
|
1,400 sq. feet
|
2 baths 3 beds |
show details | |

|
#15
Hunter Rd
Summerville, OR 97876
|
2,030 sq. feet
|
1 baths 4 beds |
show details | |

|
#16
Jasper St
Cove, OR 97824
|
1,512 sq. feet
|
2 baths 3 beds |
show details | |

|
#17
N Main St Unit 4
Union, OR 97883
|
- sq. feet
|
- baths - beds |
show details | |

|
#18
S 4th St
Union, OR 97883
|
- sq. feet
|
- baths - beds |
show details | |

|
Check over 1 million property listings on Foreclosure.com!
|
browse all offers | |||


 | La Grande OR low income apartments (6 replies) |
| The Homeless - something MUST be done (84 replies) |
| Are there any ranch homes in cool climates in Oregon for under 250k? (29 replies) |
| Hermiston vs. La Grande? (22 replies) |
| Parents Moving to La Grande (6 replies) |
| Pro and Cons on Klamath Falls (195 replies) |

Median year apartment built: 1972
Household type by relationship:
Households: 13,130- Male householders: 2,442 (604 living alone), Female householders: 2,837 (953 living alone)
2,028 spouses (2,028 opposite-sex spouses), 583 unmarried partners, (537 opposite-sex unmarried partners), 3,129 children (2,801 natural, 80 adopted, 248 stepchildren), 387 grandchildren, 142 brothers or sisters, 82 parents, 6 foster children, 225 other relatives, 758 non-relatives
- In group quarters: 506
Size of family households: 1,499 2-persons, 678 3-persons, 345 4-persons, 318 5-persons, 136 6-persons, 101 7-or-more-persons.
Size of nonfamily households: 1,669 1-person, 392 2-persons, 197 3-persons, 48 4-persons.
1,544 married couples with children.
986 single-parent households (159 men, 827 women).
93.6% of residents of La Grande speak English at home.
2.3% of residents speak Spanish at home (73% speak English very well, 23% speak English well, 4% speak English not well).
1.2% of residents speak other Indo-European language at home (85% speak English very well, 5% speak English well, 10% speak English not well).
2.5% of residents speak Asian or Pacific Island language at home (59% speak English very well, 27% speak English well, 14% speak English not well).
0.1% of residents speak other language at home (100% speak English very well).
Foreign born population: 479 (3.6%)
(28.6% of them are naturalized citizens)
| Here: | 6.6 |
| State: | 6.2 |
| Here: | 3.9 |
| State: | 4.0 |

- Bedrooms in owner-occupied houses and condos in La Grande, Oregon
- 0no bedroom
- 961 bedroom
- 5452 bedrooms
- 1,3473 bedrooms
- 6804 bedrooms
- 2075+ bedrooms

- Bedrooms in renter-occupied apartments in La Grande, Oregon
- 198no bedroom
- 6341 bedroom
- 9362 bedrooms
- 6573 bedrooms
- 824 bedrooms
- 275+ bedrooms

- Cars and other vehicles available in La Grande in owner-occupied houses/condos
- 154no vehicle
- 5591 vehicle
- 1,3892 vehicles
- 5173 vehicles
- 1454 vehicles
- 1125+ vehicles

- Cars and other vehicles available in La Grande in renter-occupied apartments
- 441no vehicle
- 1,0241 vehicle
- 6362 vehicles
- 2783 vehicles
- 1244 vehicles
- 315+ vehicles

- Rooms in owner-occupied houses in La Grande, Oregon
- 01 room
- 102 rooms
- 713 rooms
- 2694 rooms
- 4625 rooms
- 5546 rooms
- 6107 rooms
- 2778 rooms
- 6219+ rooms

- Rooms in renter-occupied apartments in La Grande, Oregon
- 1611 room
- 2252 rooms
- 3893 rooms
- 9344 rooms
- 2945 rooms
- 1726 rooms
- 1377 rooms
- 988 rooms
- 1259+ rooms


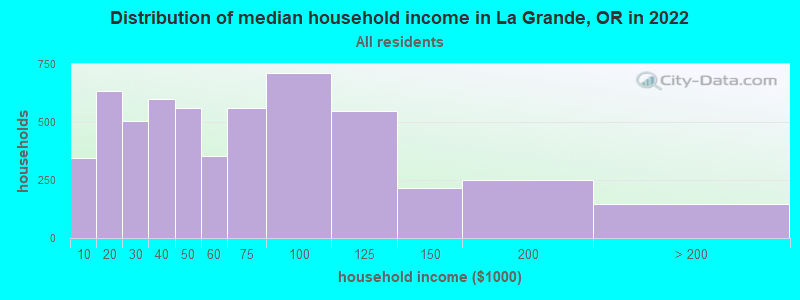
La Grande, OR household income distribution

- 345Less than $10,000
- 635$10,000 to $19,999
- 505$20,000 to $29,999
- 597$30,000 to $39,999
- 562$40,000 to $49,999
- 354$50,000 to $59,999
- 561$60,000 to $74,999
- 710$75,000 to $99,999
- 549$100,000 to $124,999
- 216$125,000 to $149,999
- 251$150,000 to $199,999
- 147$200,000 or more
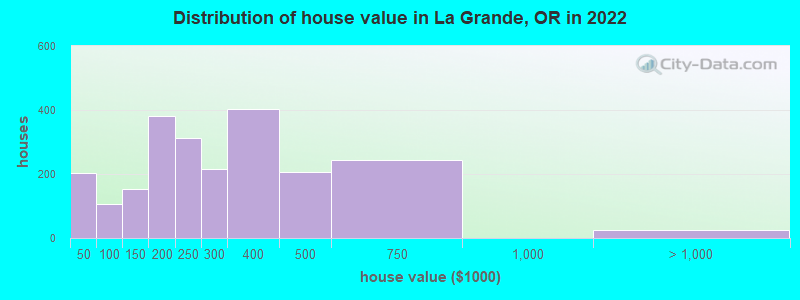
Home value of owner - occupied houses in 2022 in La Grande, OR
-
- 102Less than $10,000
- 12$10,000 to $14,999
- 25$15,000 to $19,999
- 5$20,000 to $24,999
- 44$25,000 to $29,999
- 6$30,000 to $34,999
- 4$40,000 to $49,999
- 27$50,000 to $59,999
- 39$60,000 to $69,999
- 26$70,000 to $79,999
- 7$90,000 to $99,999
- 57$100,000 to $124,999
- 93$125,000 to $149,999
- 192$150,000 to $174,999
- 189$175,000 to $199,999
- 312$200,000 to $249,999
- 216$250,000 to $299,999
- 401$300,000 to $399,999
- 206$400,000 to $499,999
- 245$500,000 to $749,999
- 17$1,000,000 to $1,499,999
- 9$2,000,000 or more
Rent paid by renters in 2022 in La Grande, OR
-
- 80Less than $100
- 6$100 to $149
- 66$150 to $199
- 63$200 to $249
- 5$250 to $299
- 38$300 to $349
- 20$350 to $399
- 74$400 to $449
- 97$450 to $499
- 150$500 to $549
- 90$550 to $599
- 100$600 to $649
- 220$650 to $699
- 131$700 to $749
- 210$750 to $799
- 247$800 to $899
- 204$900 to $999
- 296$1,000 to $1,249
- 195$1,250 to $1,499
- 72$1,500 to $1,999
- 55$2,000 to $2,499
- 80No cash rent


Percentage of workers working in this county: 98.1%
Number of people working at home: 547 (9.5% of all workers)
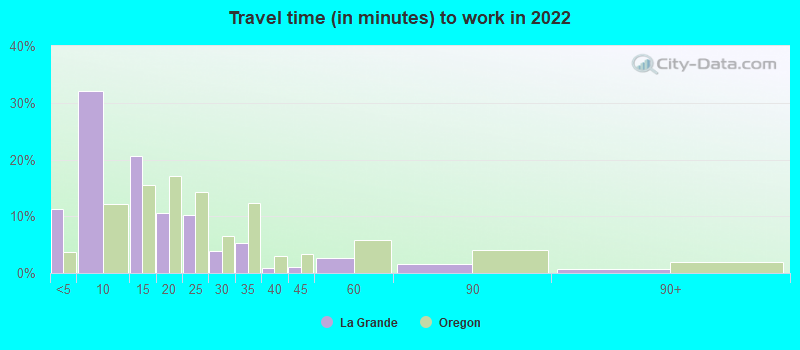
Travel time to work (commute)
- Less than 5 minutes: 678
- 5 to 9 minutes: 1,867
- 10 to 14 minutes: 1,487
- 15 to 19 minutes: 400
- 20 to 24 minutes: 187
- 25 to 29 minutes: 54
- 30 to 34 minutes: 142
- 35 to 39 minutes: 30
- 40 to 44 minutes: 44
- 45 to 59 minutes: 82
- 60 to 89 minutes: 65
- 90 or more minutes: 81
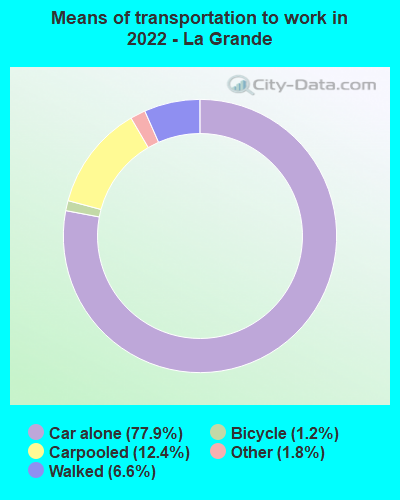
Means of transportation to work:
- Drove a car alone: 5,154 (70.3%)
- Carpooled: 833 (11.4%)
- Taxi: 133 (1.8%)
- Bicycle: 67 (0.9%)
- Walked: 488 (6.7%)
- Worked at home: 547 (7.5%)

- Unemployment by race in 2022
- Unemployment rate for White non-Hispanic residents
- 7.4%Males
- 4.1%Females
- Unemployment rate for Black residents
- 64.2%Males
- Unemployment rate for American Indian and Alaska Native residents
- 71.5%Females
- Unemployment rate for Asian residents
- 1.6%Females
- Unemployment rate for two or more race residents
- 3.2%Males
- Unemployment rate for Hispanic or Latino residents
- 6.7%Males
- 4.8%Females

- Year of entry for the foreign-born population in La Grande, Oregon
- 2372010 or later
- 1682000 to 2009
- 51990 to 1999
- 1181980 to 1989
- 151970 to 1979
- 45Before 1970

First ancestries reported:
- German: 1,081 (19.1%)
- American: 764 (13.5%)
- English: 632 (11.2%)
- Irish: 274 (4.8%)
- European: 155 (2.7%)
- Norwegian: 140 (2.5%)
- Italian: 87 (1.5%)
- Scotch-Irish: 77 (1.4%)
- Scandinavian: 49 (0.9%)
- French: 42 (0.7%)
- Czech: 37 (0.7%)
- British: 30 (0.5%)
- Dutch: 28 (0.5%)
- Swedish: 25 (0.4%)
- Basque: 20 (0.4%)
- Scottish: 19 (0.3%)
- Ukrainian: 19 (0.3%)
- Polish: 16 (0.3%)
- French Canadian: 14 (0.2%)
- Welsh: 13 (0.2%)
- Ethiopian: 12 (0.2%)
- Cajun: 11 (0.2%)
- Portuguese: 9 (0.2%)
- Northern European: 7 (0.1%)
- Romanian: 7 (0.1%)
- Eastern European: 5 (0.09%)
- Armenian: 4 (0.07%)
- Russian: 4 (0.07%)
- African: 1 (0.02%)
Most common places of birth for foreign-born residents (%):
| La Grande: | 45.7% (219) |
| Oregon: | 0.5% (1,921) |
| La Grande: | 16.1% (77) |
| Oregon: | 1.7% (7,103) |
| La Grande: | 11.9% (57) |
| Oregon: | 5.2% (21,429) |
| La Grande: | 7.1% (34) |
| Oregon: | 0.2% (700) |
| La Grande: | 5.2% (25) |
| Oregon: | 0.6% (2,667) |
| La Grande: | 4.4% (21) |
| Oregon: | 0.2% (625) |
| La Grande: | 4.0% (19) |
| Oregon: | 0.3% (1,276) |
| La Grande: | 3.3% (16) |
| Oregon: | 0.7% (2,761) |
| La Grande: | 3.1% (15) |
| Oregon: | 0.2% (839) |
| La Grande: | 2.7% (13) |
| Oregon: | 0.5% (2,055) |
| La Grande: | 2.5% (12) |
| Oregon: | 0.9% (3,555) |
| La Grande: | 2.5% (12) |
| Oregon: | 0.7% (2,927) |
| La Grande: | 2.1% (10) |
| Oregon: | 1.5% (6,259) |
| La Grande: | 1.9% (9) |
| Oregon: | 3.5% (14,530) |
Place of birth for U.S.-born residents:
- This state: 7,257
- Other state: 5,238
- Northeast: 269
- Midwest: 662
- South: 611
- West: 3,712
83.6% of La Grande residents lived in the same house 1 years ago.
Out of people who lived in different houses, 36.2% lived in this county.
Out of people who lived in different counties, 61.0% lived in Oregon.
| La Grande: | 83.6% |
| State average: | 85.5% |
Education attainment for males 25 years and older:
- No schooling: 45
- Nursery to 4th grade: 1
- 5th and 6th grade: 0
- 7th and 8th grade: 53
- 9th grade: 14
- 10th grade: 40
- 11th grade: 24
- 12th grade, no diploma: 46
- High school graduate (or equivalency): 1,418
- Less than 1 year of college: 480
- Some college more than 1 year, no degree: 722
- Associate degree: 208
- Bachelor's degree: 639
- Master's degree: 102
- Professional school degree: 8
- Doctorate degree: 100

Education attainment for females 25 years and older:
- No schooling: 27
- Nursery to 4th grade: 0
- 5th and 6th grade: 9
- 7th and 8th grade: 6
- 9th grade: 30
- 10th grade: 52
- 11th grade: 35
- 12th grade, no diploma: 80
- High school graduate (or equivalency): 1,399
- Less than 1 year of college: 413
- Some college more than 1 year, no degree: 736
- Associate degree: 364
- Bachelor's degree: 768
- Master's degree: 175
- Professional school degree: 62
- Doctorate degree: 49


Housing units in structures:
- One, detached: 3,458
- One, attached: 195
- Two: 231
- 3 or 4: 226
- 5 to 9: 291
- 10 to 19: 191
- 20 to 49: 337
- 50 or more: 282
- Mobile homes: 576
Median worth of mobile homes: $80,738
Housing units lacking complete kitchen facilities in 2022: 3.2%
House/condo owner moved in on average 14 years ago
Renter moved in on average 1 years ago

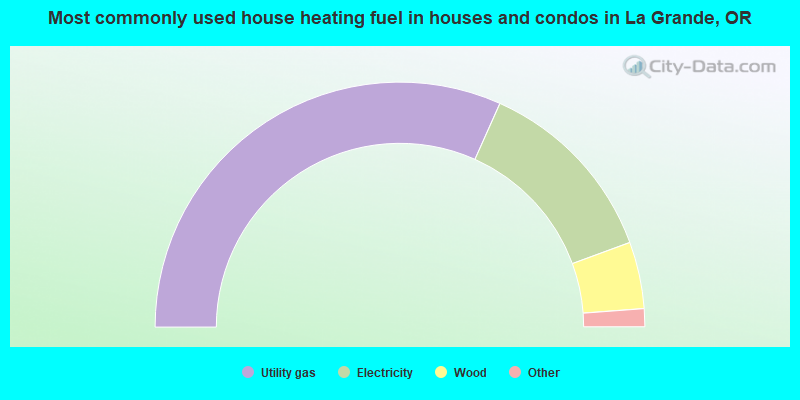
- 63.4%Utility gas
- 25.4%Electricity
- 8.8%Wood
- 0.5%Bottled, tank, or LP gas
- 0.5%Coal or coke
- 0.4%No fuel used
- 0.4%Solar energy
- 0.3%Fuel oil, kerosene, etc.
- 0.3%Other fuel
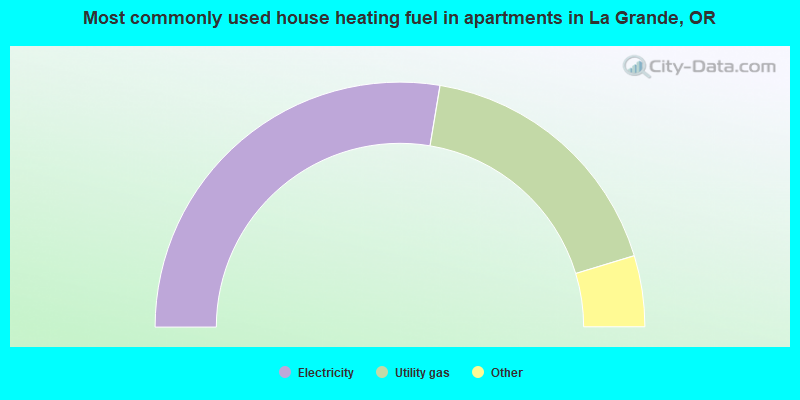
- 55.3%Electricity
- 35.4%Utility gas
- 3.4%Wood
- 2.4%No fuel used
- 2.0%Bottled, tank, or LP gas
- 1.1%Other fuel
- 0.4%Fuel oil, kerosene, etc.
Private vs. public school enrollment:
| Here: | 28.9% |
| Oregon: | 13.7% |
| Here: | 2.0% |
| Oregon: | 8.8% |
| Here: | 7.3% |
| Oregon: | 17.7% |


