Housing density: 489 houses/condos per square mile
Median price asked for vacant for-sale houses and condos in 2022 in this county: $275,451.
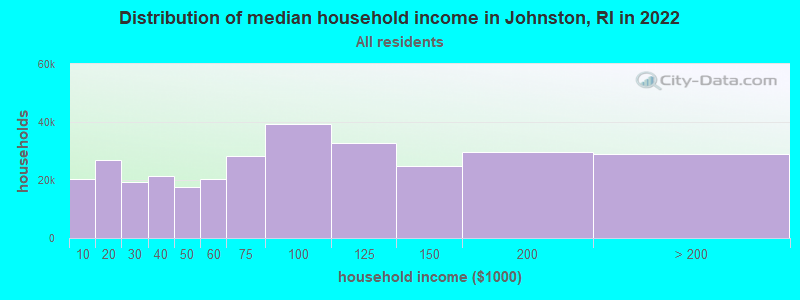
Median contract rent in 2022: $1,183 (lower quartile is $653, upper quartile is $1,613)
Median rent asked for vacant for-rent units in 2022: $1,358
Median gross rent in Johnston, RI in 2022: $1,345
Housing units in Johnston with a mortgage: 4,830 (520 second mortgage, 664 home equity loan, 40 both second mortgage and home equity loan) Houses without a mortgage: 2,283
In family households: 482,061 (90,167 male householders, 59,524 female householders)
98,652 spouses, 176,915 children (166,353 natural, 3,940 adopted, 6,622 stepchildren), 11,252 grandchildren, 7,716 brothers or sisters, 7,800 parents, foster children, 8,986 other relatives, 16,700 non-relatives
In nonfamily households: 116,821 (42,422 male householders (31,930 living alone)), 49,604 female householders (41,173 living alone)), 24,795 nonrelatives
In group quarters: 27,785 (9,688 institutionalized population)
87,776 married couples with children.
48,327 single-parent households (7,463 men, 40,864 women).
89.1% of residents of Johnston speak English at home.
1.8% of residents speak Spanish at home (54% speak English very well, 31% speak English well, 14% speak English not well, 1% don't speak English at all).
7.8% of residents speak other Indo-European language at home (69% speak English very well, 18% speak English well, 11% speak English not well, 2% don't speak English at all).
0.9% of residents speak Asian or Pacific Island language at home (52% speak English very well, 33% speak English well, 14% speak English not well).
0.4% of residents speak other language at home (52% speak English very well, 39% speak English well, 9% speak English not well).
Foreign born population: 1,839 (6.2%)
(69.9% of them are naturalized citizens)
Year of entry for the foreign-born population in Johnston, Rhode Island
1131995 to March 2000
1851990 to 1994
1031985 to 1989
961980 to 1984
1491975 to 1979
1841970 to 1974
1311965 to 1969
392Before 1965
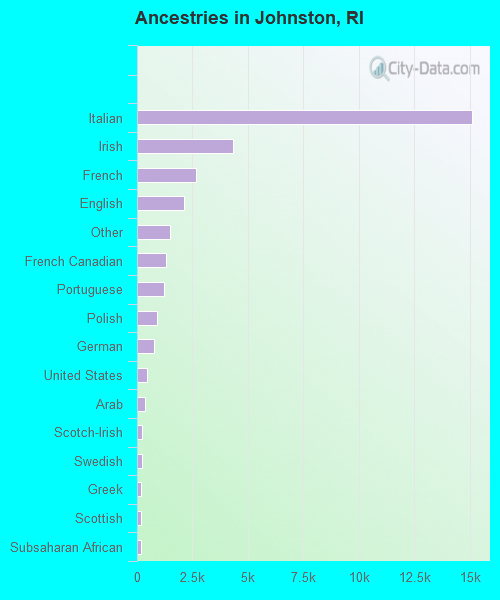
First ancestries reported:
Italian: 15,114 (46.7%)
Irish: 4,342 (13.4%)
French: 2,681 (8.3%)
English: 2,118 (6.5%)
Other: 1,488 (4.6%)
French Canadian: 1,317 (4.1%)
Portuguese: 1,206 (3.7%)
Polish: 916 (2.8%)
German: 755 (2.3%)
United States: 472 (1.5%)
Arab: 350 (1.1%)
Scotch-Irish: 235 (0.7%)
Swedish: 209 (0.6%)
Greek: 200 (0.6%)
Scottish: 188 (0.6%)
Subsaharan African: 178 (0.6%)
Dutch: 134 (0.4%)
Lithuanian: 114 (0.4%)
Russian: 92 (0.3%)
Ukrainian: 79 (0.2%)
Norwegian: 64 (0.2%)
Welsh: 33 (0.1%)
Slovak: 21 (0.06%)
Czech: 11 (0.03%)
Swiss: 10 (0.03%)
Danish: 8 (0.02%)
Hungarian: 7 (0.02%)
Most common places of birth for foreign-born residents (%):
Italy
Johnston:
28.2% (381)
Rhode Island:
3.8% (4,502)
Hong Kong
Johnston:
5.4% (73)
Rhode Island:
0.4% (475)
Other Western Africa
Johnston:
5.4% (73)
Rhode Island:
7.0% (8,389)
Canada
Johnston:
4.8% (65)
Rhode Island:
3.4% (4,015)
Portugal
Johnston:
4.6% (62)
Rhode Island:
17.6% (21,016)
Greece
Johnston:
3.9% (53)
Rhode Island:
0.9% (1,014)
Guatemala
Johnston:
3.8% (52)
Rhode Island:
7.6% (9,049)
Pakistan
Johnston:
3.8% (52)
Rhode Island:
0.2% (256)
China, excluding Hong Kong and Taiwan
Johnston:
3.8% (51)
Rhode Island:
1.6% (1,954)
Mexico
Johnston:
3.0% (40)
Rhode Island:
2.1% (2,510)
Poland
Johnston:
2.8% (38)
Rhode Island:
1.2% (1,473)
Nigeria
Johnston:
2.8% (38)
Rhode Island:
1.1% (1,344)
Colombia
Johnston:
2.4% (32)
Rhode Island:
5.4% (6,496)
Other Eastern Europe
Johnston:
2.3% (31)
Rhode Island:
0.7% (789)
Ecuador
Johnston:
2.2% (30)
Rhode Island:
0.4% (474)
Korea
Johnston:
2.2% (30)
Rhode Island:
1.2% (1,404)
United Kingdom
Johnston:
2.1% (29)
Rhode Island:
2.6% (3,120)
Syria
Johnston:
2.1% (29)
Rhode Island:
0.4% (510)
Dominican Republic
Johnston:
2.1% (29)
Rhode Island:
13.7% (16,382)
Bolivia
Johnston:
1.9% (26)
Rhode Island:
0.8% (951)
Germany
Johnston:
1.8% (25)
Rhode Island:
1.7% (1,982)
Place of birth for U.S.-born residents:
This state: 23,699
Other state: 2,978
Northeast: 2,095
Midwest: 300
South: 332
West: 251
67% of Johnston residents lived in the same house 5 years ago. Out of people who lived in different houses, 83% lived in this county. Out of people who lived in different counties, 39% lived in Rhode Island.
Education attainment for males 25 years and older:
No schooling: 35
Nursery to 4th grade: 38
5th and 6th grade: 94
7th and 8th grade: 391
9th grade: 455
10th grade: 410
11th grade: 246
12th grade, no diploma: 382
High school graduate (or equivalency): 2,955
Less than 1 year of college: 695
Some college more than 1 year, no degree: 996
Associate degree: 800
Bachelor's degree: 1,317
Master's degree: 348
Professional school degree: 108
Doctorate degree: 34
Education attainment for females 25 years and older:
No schooling: 94
Nursery to 4th grade: 16
5th and 6th grade: 85
7th and 8th grade: 512
9th grade: 507
10th grade: 424
11th grade: 485
12th grade, no diploma: 347
High school graduate (or equivalency): 4,081
Less than 1 year of college: 701
Some college more than 1 year, no degree: 1,123
Associate degree: 1,020
Bachelor's degree: 1,207
Master's degree: 507
Professional school degree: 123
Doctorate degree: 43
Housing units in structures:
One, detached: 7,943
One, attached: 311
Two: 1,106
3 or 4: 520
5 to 9: 241
10 to 19: 398
20 to 49: 421
50 or more: 595
Mobile homes: 23
Boats, RVs, vans, etc.: 9
Median worth of mobile homes: $344,744
Housing units lacking complete plumbing facilities: 0.2%
Housing units lacking complete kitchen facilities: 1.7%