Jersey City, NJ (New Jersey) Houses and Residents
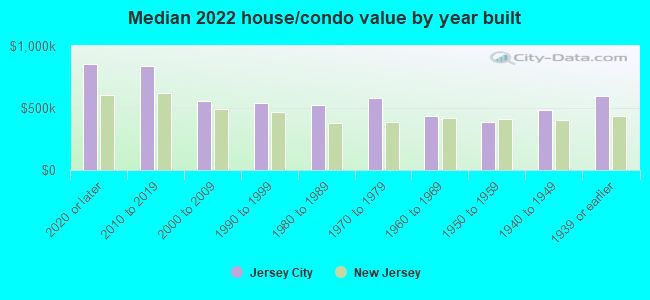
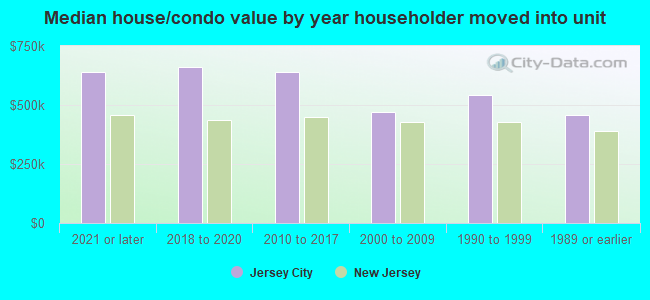
| Jersey City: | $559,700 |
| New Jersey: | $428,900 |
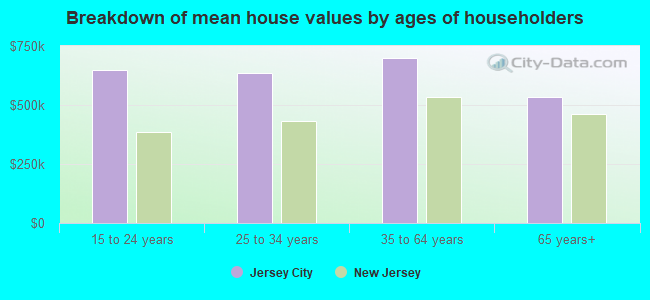
Mean price in 2022:
Detached houses: $732,576
Here: $732,576 State: $537,591 Townhouses or other attached units: $695,567
Here: $695,567 State: $381,113 In 2-unit structures: $571,976
Here: $571,976 State: $444,476 In 3-to-4-unit structures: $581,467
Here: $581,467 State: $457,463 In 5-or-more-unit structures: $666,445
Here: $666,445 State: $368,745
Total population: 262,146 (Urban population: 240,055, Rural population: 0)
Houses: 135,927 (130,213 occupied: 38,827 owner occupied, 91,386 renter occupied)
| % of renters here: | 70% |
| State: | 35% |
Housing density: 9,113 houses/condos per square mile
Median price asked for vacant for-sale houses and condos in 2022: $1,310,841.
Median contract rent in 2022: $1,738 (lower quartile is $1,153, upper quartile is over $2,000)
Median rent asked for vacant for-rent units in 2022: $1,361
Median gross rent in Jersey City, NJ in 2022: $1,832
Housing units in Jersey City with a mortgage: 26,947 (2,534 second mortgage, 213 home equity loan, 1,802 both second mortgage and home equity loan)
Houses without a mortgage: 313
Median household income for houses/condos with a mortgage: $150,228
Median household income for apartments without a mortgage: $100,964
Median monthly housing costs: $1,905
Compare current foreclosures in Jersey City, NJ:
| Photo | Address | Area | Beds / Baths | Price | Details |
|---|---|---|---|---|---|

|
#1
Grant Ave
Jersey City, NJ 07305
|
3,900 sq. feet
|
4 baths 6 beds |
show details | |

|
#2
Clinton Ave
Jersey City, NJ 07304
|
2,253 sq. feet
|
2 baths 4 beds |
show details | |

|
#3
Woodlawn Ave
Jersey City, NJ 07305
|
1,556 sq. feet
|
1 baths 4 beds |
show details | |

|
#4
Garfield Ave
Jersey City, NJ 07305
|
2,496 sq. feet
|
2 baths 4 beds |
show details | |

|
#5
Forrest St
Jersey City, NJ 07304
|
2,032 sq. feet
|
3 baths 5 beds |
show details | |

|
#6
John F Kennedy Blvd
Jersey City, NJ 07306
|
852 sq. feet
|
1 baths 1 beds |
show details | |

|
#7
Harrison Ave Apt B1
Jersey City, NJ 07304
|
399 sq. feet
|
1 baths 1 beds |
show details | |

|
#8
Neptune Ave
Jersey City, NJ 07305
|
2,196 sq. feet
|
3 baths 6 beds |
show details | |

|
#9
Linden Ave
Jersey City, NJ 07305
|
2,980 sq. feet
|
3 baths 4 beds |
show details | |

|
#10
Oak St
Jersey City, NJ 07304
|
3,198 sq. feet
|
- baths 6 beds |
show details |
| Photo | Address | Area | Beds / Baths | Price | Details |
|---|---|---|---|---|---|

|
#11
15th St # 32
Jersey City, NJ 07310
|
598 sq. feet
|
1 baths 2 beds |
show details | |

|
#12
8th St
Jersey City, NJ 07302
|
1,665 sq. feet
|
- baths 5 beds |
show details | |

|
#13
Randolph Ave
Jersey City, NJ 07305
|
1,936 sq. feet
|
- baths 6 beds |
show details | |

|
#14
Tellicherry Ct # A1
Jersey City, NJ 07305
|
1,866 sq. feet
|
- baths 3 beds |
show details | |

|
#15
Kennedy Blvd
Jersey City, NJ 07305
|
- sq. feet
|
- baths - beds |
show details | |

|
#16
Lee F2
Jersey City, NJ 07305
|
2,146 sq. feet
|
- baths - beds |
show details | |

|
#17
Shearwater Ct E Apt 2d
Jersey City, NJ 07305
|
- sq. feet
|
- baths - beds |
show details | |

|
#18
Glenwood Ave Apt 1h
Jersey City, NJ 07306
|
624 sq. feet
|
- baths - beds |
show details | |

|
#19
Romaine Ave
Jersey City, NJ 07306
|
930 sq. feet
|
- baths - beds |
show details | |

|
#20
A Arlington Ave
Jersey City, NJ 07305
|
- sq. feet
|
- baths - beds |
show details |
| Photo | Address | Area | Beds / Baths | Price | Details |
|---|---|---|---|---|---|

|
#21
Palisade Ave Apt 1b
Jersey City, NJ 07307
|
- sq. feet
|
- baths - beds |
show details | |

|
#22
Glenwood Ave
Jersey City, NJ 07306
|
- sq. feet
|
- baths - beds |
show details | |

|
#23
Martin Luther King Jr Dr
Jersey City, NJ 07304
|
- sq. feet
|
- baths - beds |
show details | |

|
#24
W Shearwater Ct
Jersey City, NJ 07097
|
- sq. feet
|
- baths - beds |
show details | |

|
#25
Hutton St
Jersey City, NJ 07307
|
- sq. feet
|
- baths - beds |
show details | |

|
#26
River Dr S Apt 2406
Jersey City, NJ 07310
|
- sq. feet
|
- baths - beds |
show details | |

|
#27
8th St Apt 2r
Jersey City, NJ 07302
|
- sq. feet
|
- baths - beds |
show details | |

|
#28
Huron Ave Apt 4f
Jersey City, NJ 07306
|
- sq. feet
|
- baths - beds |
show details | |

|
#29
Forrest St
Jersey City, NJ 07304
|
- sq. feet
|
- baths - beds |
show details | |

|
#30
Harrison Ave Apt B-1
Jersey City, NJ 07304
|
- sq. feet
|
- baths - beds |
show details |
| Photo | Address | Area | Beds / Baths | Price | Details |
|---|---|---|---|---|---|

|
#31
Bryan Pl
Jersey City, NJ 07306
|
- sq. feet
|
- baths - beds |
show details | |

|
#32
Columbia Ave
Jersey City, NJ 07307
|
- sq. feet
|
- baths - beds |
show details | |

|
#33
Duncan Ave Apt 1r
Jersey City, NJ 07306
|
- sq. feet
|
- baths - beds |
show details | |

|
#34
Garfield Ave Apt 1f
Jersey City, NJ 07305
|
- sq. feet
|
- baths - beds |
show details | |

|
#35
Cator Ave Apt 3f
Jersey City, NJ 07305
|
719 sq. feet
|
- baths - beds |
show details | |

|
#36
Huron Ave Apt 8-B
Jersey City, NJ 07306
|
459 sq. feet
|
- baths - beds |
show details | |

|
#37
Stegman St
Jersey City, NJ 07305
|
- sq. feet
|
- baths - beds |
show details | |

|
#38
Wallis Ave
Jersey City, NJ 07306
|
- sq. feet
|
- baths - beds |
show details | |

|
#39
Jersey Ave
Jersey City, NJ 07302
|
- sq. feet
|
- baths - beds |
show details | |

|
#40
Kensington Ave Apt 5
Jersey City, NJ 07304
|
- sq. feet
|
- baths - beds |
show details |
| Photo | Address | Area | Beds / Baths | Price | Details |
|---|---|---|---|---|---|

|
#41
Kennedy Blvd
Jersey City, NJ 07305
|
- sq. feet
|
- baths - beds |
show details | |

|
#42
Chapel Ave # 6
Jersey City, NJ 07305
|
- sq. feet
|
- baths - beds |
show details | |

|
#43
Hudson Ct
Jersey City, NJ 07305
|
- sq. feet
|
- baths - beds |
show details | |

|
#44
10th St Apt 2-H
Jersey City, NJ 07302
|
850 sq. feet
|
- baths - beds |
show details | |

|
#45
Henry St Apt 11-B
Jersey City, NJ 07306
|
1,440 sq. feet
|
- baths - beds |
show details | |

|
#46
Cornelison Ave
Jersey City, NJ 07304
|
- sq. feet
|
- baths - beds |
show details | |

|
#47
Newark Ave
Jersey City, NJ 07306
|
- sq. feet
|
- baths - beds |
show details | |

|
#48
Martin Luther King Jr 133
Jersey City, NJ 07305
|
- sq. feet
|
- baths - beds |
show details | |

|
#49
Griffith S E
Jersey City, NJ 07097
|
- sq. feet
|
- baths - beds |
show details | |

|
Check over 1 million property listings on Foreclosure.com!
|
browse all offers | |||


Median year apartment built: 1979
Household type by relationship:
Households: 286,661- Male householders: 69,004 (23,089 living alone), Female householders: 61,209 (22,538 living alone)
43,347 spouses (42,849 opposite-sex spouses), 13,453 unmarried partners, (12,685 opposite-sex unmarried partners), 63,663 children (61,613 natural, 738 adopted, 1,312 stepchildren), 7,428 grandchildren, 4,539 brothers or sisters, 6,399 parents, 0 foster children, 5,432 other relatives, 9,846 non-relatives
- In group quarters: 2,341
Size of family households: 30,157 2-persons, 20,099 3-persons, 9,243 4-persons, 4,366 5-persons, 2,280 6-persons, 1,737 7-or-more-persons.
Size of nonfamily households: 45,627 1-person, 13,386 2-persons, 2,960 3-persons, 166 4-persons, 132 5-persons, 60 7-or-more-persons.
27,616 married couples with children.
15,075 single-parent households (2,547 men, 12,528 women).
50.4% of residents of Jersey City speak English at home.
19.6% of residents speak Spanish at home (58% speak English very well, 19% speak English well, 16% speak English not well, 7% don't speak English at all).
14.1% of residents speak other Indo-European language at home (82% speak English very well, 11% speak English well, 5% speak English not well, 2% don't speak English at all).
11.6% of residents speak Asian or Pacific Island language at home (65% speak English very well, 27% speak English well, 7% speak English not well, 1% don't speak English at all).
4.3% of residents speak other language at home (67% speak English very well, 19% speak English well, 14% speak English not well).
Foreign born population: 113,619 (39.6%)
(47.4% of them are naturalized citizens)
| Here: | 4.8 |
| State: | 6.8 |
| Here: | 3.4 |
| State: | 3.9 |
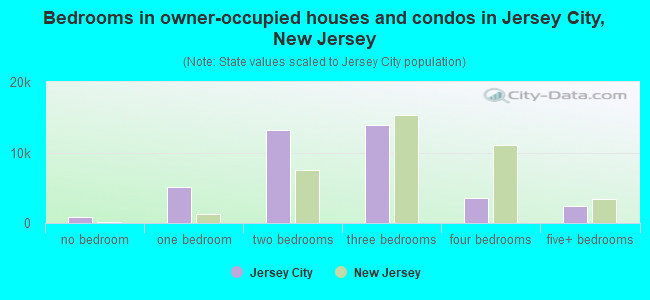
- Bedrooms in owner-occupied houses and condos in Jersey City, New Jersey
- 850no bedroom
- 5,1281 bedroom
- 13,1532 bedrooms
- 13,8333 bedrooms
- 3,4834 bedrooms
- 2,3805+ bedrooms
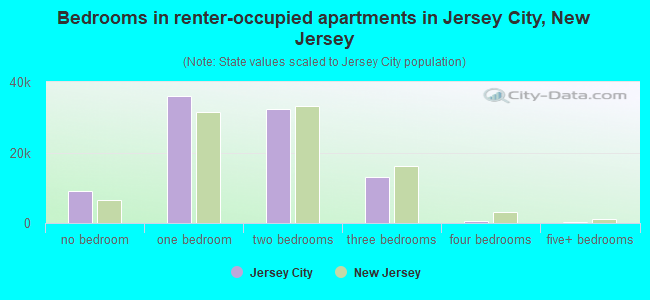
- Bedrooms in renter-occupied apartments in Jersey City, New Jersey
- 9,140no bedroom
- 35,9681 bedroom
- 32,2682 bedrooms
- 12,9753 bedrooms
- 6764 bedrooms
- 3595+ bedrooms
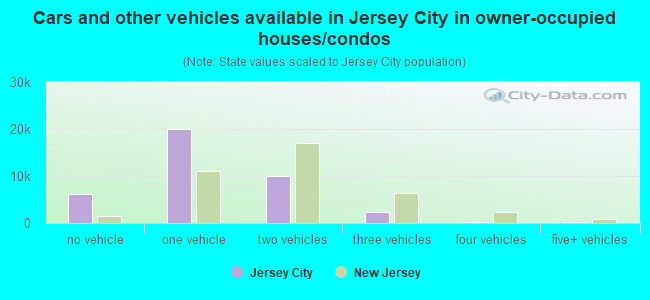
- Cars and other vehicles available in Jersey City in owner-occupied houses/condos
- 6,099no vehicle
- 20,0911 vehicle
- 9,9482 vehicles
- 2,3443 vehicles
- 1864 vehicles
- 1595+ vehicles
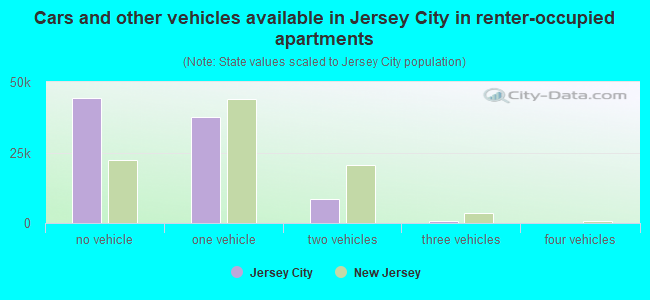
- Cars and other vehicles available in Jersey City in renter-occupied apartments
- 44,325no vehicle
- 37,7291 vehicle
- 8,4602 vehicles
- 8203 vehicles
- 04 vehicles
- 525+ vehicles
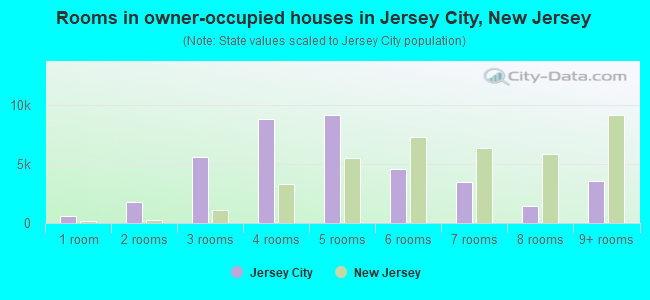
- Rooms in owner-occupied houses in Jersey City, New Jersey
- 6101 room
- 1,7322 rooms
- 5,5383 rooms
- 8,7994 rooms
- 9,1185 rooms
- 4,5426 rooms
- 3,4767 rooms
- 1,4758 rooms
- 3,5379+ rooms
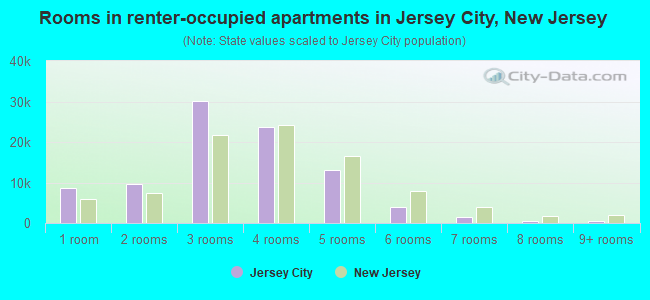
- Rooms in renter-occupied apartments in Jersey City, New Jersey
- 8,6281 room
- 9,7112 rooms
- 30,1853 rooms
- 23,5854 rooms
- 13,1125 rooms
- 3,8876 rooms
- 1,4207 rooms
- 3768 rooms
- 4829+ rooms
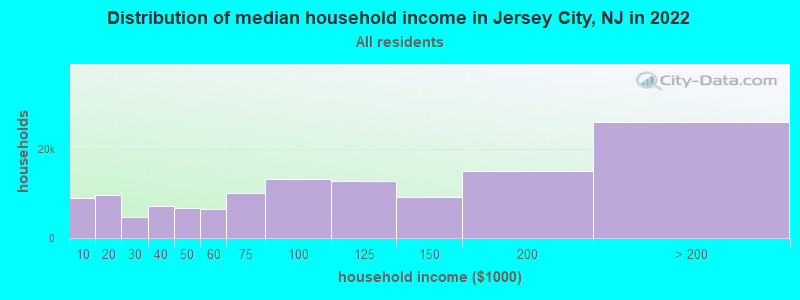
Jersey City, NJ household income distribution

- 9,056Less than $10,000
- 9,702$10,000 to $19,999
- 4,670$20,000 to $29,999
- 7,113$30,000 to $39,999
- 6,718$40,000 to $49,999
- 6,493$50,000 to $59,999
- 10,182$60,000 to $74,999
- 13,247$75,000 to $99,999
- 12,745$100,000 to $124,999
- 9,219$125,000 to $149,999
- 15,089$150,000 to $199,999
- 25,979$200,000 or more
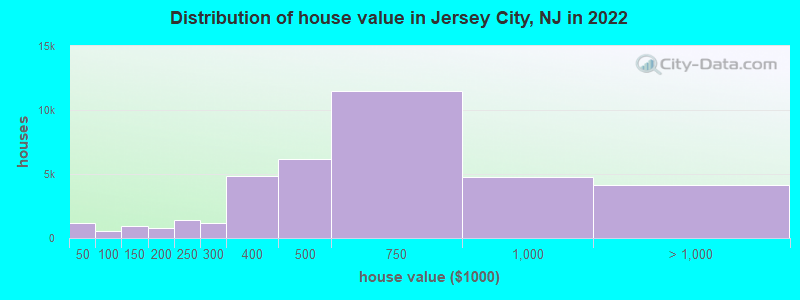
Home value of owner - occupied houses in 2022 in Jersey City, NJ
-
- 711Less than $10,000
- 155$10,000 to $14,999
- 9$15,000 to $19,999
- 10$20,000 to $24,999
- 54$25,000 to $29,999
- 153$30,000 to $34,999
- 26$35,000 to $39,999
- 67$40,000 to $49,999
- 107$50,000 to $59,999
- 24$60,000 to $69,999
- 97$70,000 to $79,999
- 145$80,000 to $89,999
- 87$90,000 to $99,999
- 716$100,000 to $124,999
- 209$125,000 to $149,999
- 395$150,000 to $174,999
- 402$175,000 to $199,999
- 1,428$200,000 to $249,999
- 1,154$250,000 to $299,999
- 4,817$300,000 to $399,999
- 6,134$400,000 to $499,999
- 11,450$500,000 to $749,999
- 4,787$750,000 to $999,999
- 2,413$1,000,000 to $1,499,999
- 886$1,500,000 to $1,999,999
- 869$2,000,000 or more
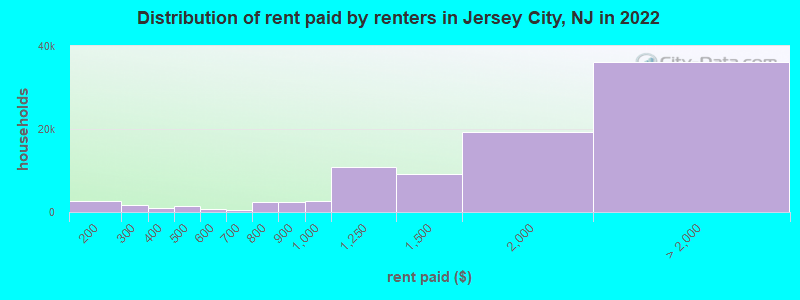
Rent paid by renters in 2022 in Jersey City, NJ
-
- 147Less than $100
- 717$100 to $149
- 2,014$150 to $199
- 474$200 to $249
- 1,170$250 to $299
- 684$300 to $349
- 266$350 to $399
- 713$400 to $449
- 821$450 to $499
- 258$500 to $549
- 542$550 to $599
- 518$600 to $649
- 65$650 to $699
- 1,812$700 to $749
- 633$750 to $799
- 2,499$800 to $899
- 2,570$900 to $999
- 10,916$1,000 to $1,249
- 9,146$1,250 to $1,499
- 19,356$1,500 to $1,999
- 10,945$2,000 to $2,499
- 9,062$2,500 to $2,999
- 6,342$3,000 to $3,499
- 8,695$3,500 or more
- 1,021No cash rent
Percentage of workers working in this county: 56.9%
Number of people working at home: 40,498 (24.9% of all workers)
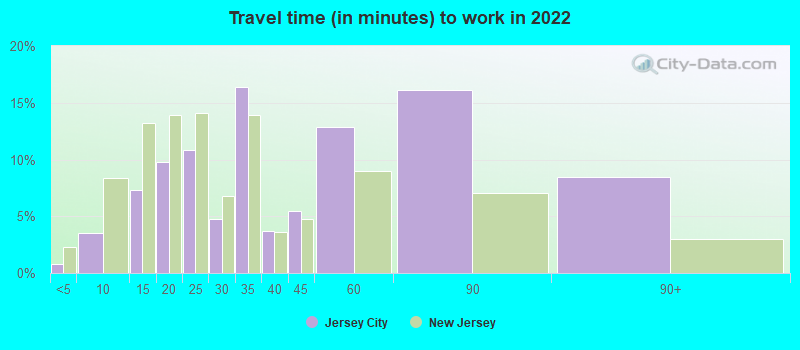
Travel time to work (commute)
- Less than 5 minutes: 649
- 5 to 9 minutes: 3,414
- 10 to 14 minutes: 6,748
- 15 to 19 minutes: 11,910
- 20 to 24 minutes: 13,907
- 25 to 29 minutes: 6,725
- 30 to 34 minutes: 19,600
- 35 to 39 minutes: 4,368
- 40 to 44 minutes: 11,048
- 45 to 59 minutes: 23,779
- 60 to 89 minutes: 14,486
- 90 or more minutes: 5,604
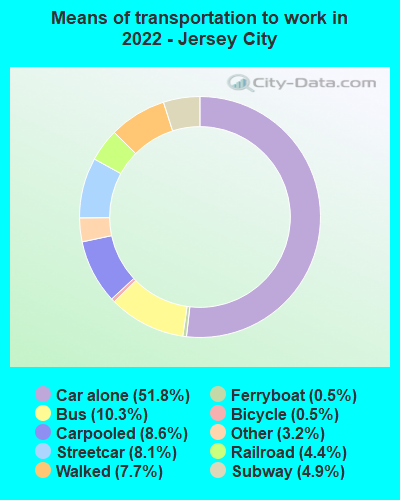
Means of transportation to work:
- Drove a car alone: 55,670 (37.6%)
- Carpooled: 9,278 (6.3%)
- Bus: 11,075 (7.5%)
- Subway or elevated rail: 8,664 (5.9%)
- Long-distance train or commuter rail: 5,297 (3.6%)
- Light rail, streetcar or trolley: 4,726 (3.2%)
- Ferryboat: 558 (0.4%)
- Taxi: 3,392 (2.3%)
- Bicycle: 589 (0.4%)
- Walked: 8,319 (5.6%)
- Worked at home: 40,498 (27.4%)
- Unemployment by race in 2022
- Unemployment rate for White non-Hispanic residents
- 2.1%Males
- 3.1%Females
- Unemployment rate for Black residents
- 5.0%Males
- 5.4%Females
- Unemployment rate for American Indian and Alaska Native residents
- 5.6%Males
- 36.1%Females
- Unemployment rate for Asian residents
- 1.0%Males
- 2.9%Females
- Unemployment rate for other race residents
- 9.7%Males
- 6.2%Females
- Unemployment rate for two or more race residents
- 4.1%Males
- 3.0%Females
- Unemployment rate for Hispanic or Latino residents
- 6.8%Males
- 5.5%Females
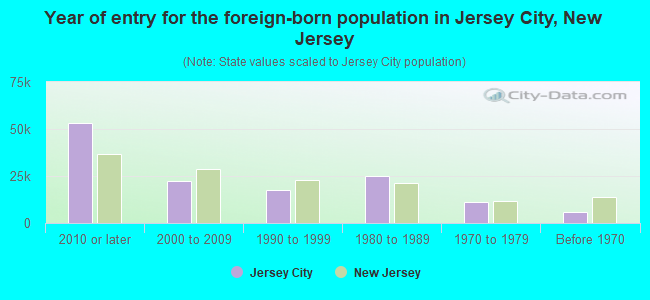
- Year of entry for the foreign-born population in Jersey City, New Jersey
- 53,0652010 or later
- 22,3752000 to 2009
- 17,3941990 to 1999
- 24,7731980 to 1989
- 11,1701970 to 1979
- 5,912Before 1970
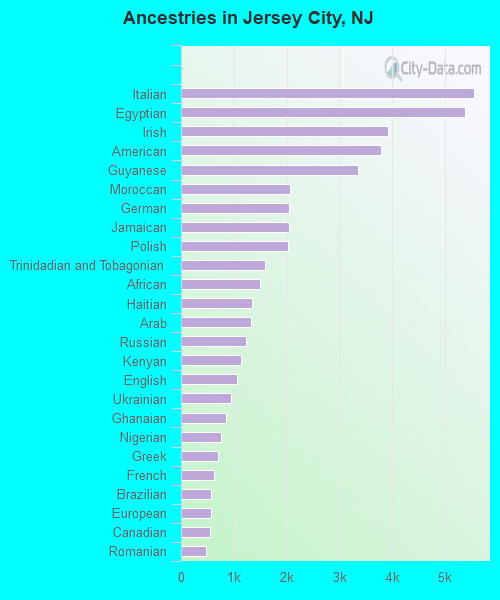
First ancestries reported:
- Italian: 5,558 (2.8%)
- Egyptian: 5,378 (2.7%)
- Irish: 3,927 (2.0%)
- American: 3,791 (1.9%)
- Guyanese: 3,352 (1.7%)
- Moroccan: 2,067 (1.1%)
- German: 2,050 (1.0%)
- Jamaican: 2,045 (1.0%)
- Polish: 2,030 (1.0%)
- Trinidadian and Tobagonian: 1,594 (0.8%)
- African: 1,502 (0.8%)
- Haitian: 1,337 (0.7%)
- Arab: 1,325 (0.7%)
- Russian: 1,234 (0.6%)
- Kenyan: 1,145 (0.6%)
- English: 1,060 (0.5%)
- Ukrainian: 943 (0.5%)
- Ghanaian: 859 (0.4%)
- Nigerian: 761 (0.4%)
- Greek: 698 (0.4%)
- French: 623 (0.3%)
- Brazilian: 577 (0.3%)
- European: 573 (0.3%)
- Canadian: 548 (0.3%)
- Romanian: 474 (0.2%)
- Lebanese: 472 (0.2%)
- British West Indian: 410 (0.2%)
- Hungarian: 343 (0.2%)
- British: 311 (0.2%)
- Turkish: 301 (0.2%)
- Portuguese: 298 (0.2%)
- West Indian: 271 (0.1%)
- Ethiopian: 271 (0.1%)
- Eastern European: 258 (0.1%)
- Iranian: 243 (0.1%)
- Australian: 226 (0.1%)
- Bulgarian: 185 (0.09%)
- Barbadian: 179 (0.09%)
- Albanian: 171 (0.09%)
- Dutch: 159 (0.08%)
- Scottish: 154 (0.08%)
- Palestinian: 146 (0.07%)
- Lithuanian: 143 (0.07%)
- Scotch-Irish: 114 (0.06%)
- Swedish: 111 (0.06%)
- Slavic: 104 (0.05%)
- Austrian: 102 (0.05%)
- Liberian: 98 (0.05%)
- Norwegian: 91 (0.05%)
- Danish: 70 (0.04%)
- Israeli: 58 (0.03%)
- Zimbabwean: 57 (0.03%)
- Croatian: 57 (0.03%)
- Sierra Leonean: 55 (0.03%)
- Senegalese: 54 (0.03%)
- Finnish: 52 (0.03%)
- Yugoslavian: 51 (0.03%)
- Sudanese: 49 (0.02%)
- Czech: 44 (0.02%)
- Belgian: 38 (0.02%)
- Serbian: 38 (0.02%)
- Bahamian: 37 (0.02%)
- South African: 35 (0.02%)
- Afghan: 35 (0.02%)
- French Canadian: 33 (0.02%)
- Cypriot: 25 (0.01%)
- Macedonian: 24 (0.01%)
- U.S. Virgin Islander: 21 (0.01%)
- Swiss: 20 (0.01%)
- Northern European: 19 (0.01%)
- Slovak: 19 (0.01%)
- Slovene: 15 (0.01%)
- Latvian: 11 (0.01%)
Most common places of birth for foreign-born residents (%):
| Jersey City: | 22.0% (26,512) |
| New Jersey: | 12.8% (274,609) |
| Jersey City: | 10.2% (12,251) |
| New Jersey: | 9.7% (209,055) |
| Jersey City: | 9.0% (10,866) |
| New Jersey: | 4.0% (85,934) |
| Jersey City: | 6.8% (8,226) |
| New Jersey: | 3.7% (78,969) |
| Jersey City: | 4.3% (5,151) |
| New Jersey: | 1.6% (33,678) |
| Jersey City: | 3.0% (3,571) |
| New Jersey: | 1.2% (26,173) |
| Jersey City: | 2.7% (3,248) |
| New Jersey: | 4.4% (95,275) |
| Jersey City: | 2.2% (2,626) |
| New Jersey: | 1.3% (27,580) |
| Jersey City: | 1.7% (2,105) |
| New Jersey: | 1.7% (37,335) |
| Jersey City: | 1.7% (2,072) |
| New Jersey: | 0.7% (15,533) |
| Jersey City: | 1.7% (2,011) |
| New Jersey: | 0.3% (5,621) |
| Jersey City: | 1.6% (1,952) |
| New Jersey: | 4.2% (90,817) |
| Jersey City: | 1.6% (1,886) |
| New Jersey: | 3.3% (70,512) |
Place of birth for U.S.-born residents:
- This state: 98,873
- Other state: 63,289
- Northeast: 43,039
- Midwest: 4,934
- South: 11,134
- West: 4,182
88.0% of Jersey City residents lived in the same house 1 years ago.
Out of people who lived in different houses, 33.7% lived in this county.
Out of people who lived in different counties, 22.1% lived in New Jersey.
| Jersey City: | 88.0% |
| State average: | 90.4% |
Education attainment for males 25 years and older:
- No schooling: 2,101
- Nursery to 4th grade: 619
- 5th and 6th grade: 698
- 7th and 8th grade: 751
- 9th grade: 892
- 10th grade: 610
- 11th grade: 1,480
- 12th grade, no diploma: 2,106
- High school graduate (or equivalency): 18,518
- Less than 1 year of college: 4,609
- Some college more than 1 year, no degree: 10,248
- Associate degree: 4,698
- Bachelor's degree: 30,392
- Master's degree: 22,396
- Professional school degree: 3,643
- Doctorate degree: 1,870

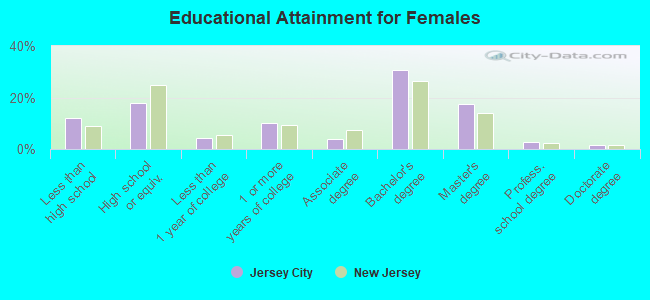
Education attainment for females 25 years and older:
- No schooling: 2,981
- Nursery to 4th grade: 682
- 5th and 6th grade: 1,488
- 7th and 8th grade: 1,948
- 9th grade: 461
- 10th grade: 505
- 11th grade: 1,693
- 12th grade, no diploma: 3,185
- High school graduate (or equivalency): 19,440
- Less than 1 year of college: 4,515
- Some college more than 1 year, no degree: 11,188
- Associate degree: 4,207
- Bachelor's degree: 33,227
- Master's degree: 18,914
- Professional school degree: 2,946
- Doctorate degree: 1,524


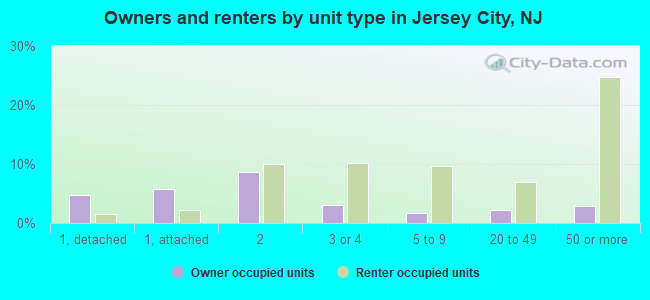
Housing units in structures:
- One, detached: 8,522
- One, attached: 10,676
- Two: 25,830
- 3 or 4: 18,066
- 5 to 9: 15,382
- 10 to 19: 7,531
- 20 to 49: 12,026
- 50 or more: 37,894
Housing units lacking complete kitchen facilities in 2022: 1.6%
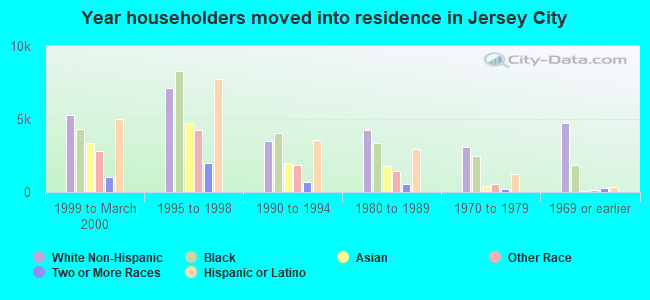
House/condo owner moved in on average 12 years ago
Renter moved in on average 3 years ago
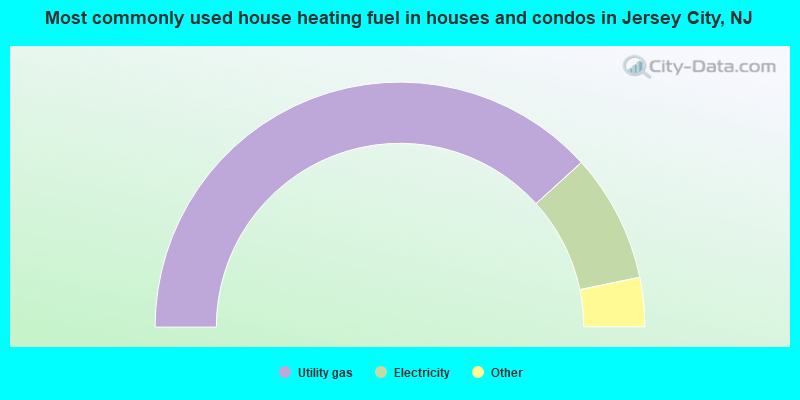
- 76.5%Utility gas
- 16.9%Electricity
- 2.6%Bottled, tank, or LP gas
- 1.9%Fuel oil, kerosene, etc.
- 1.4%No fuel used
- 0.3%Other fuel
- 0.3%Solar energy
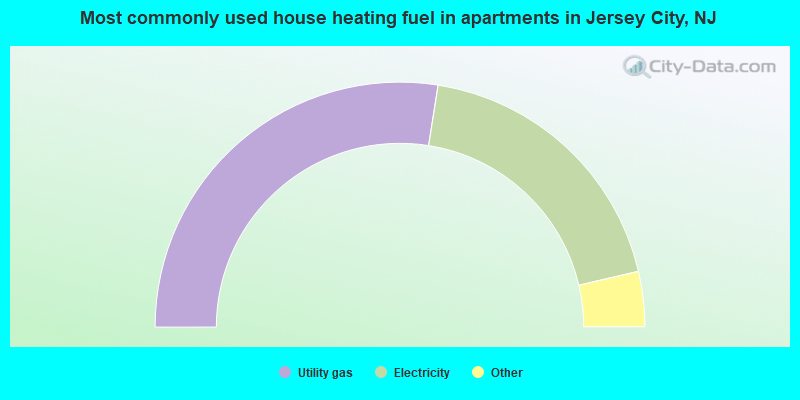
- 55.0%Utility gas
- 37.7%Electricity
- 3.1%No fuel used
- 2.1%Bottled, tank, or LP gas
- 1.2%Fuel oil, kerosene, etc.
- 0.8%Other fuel
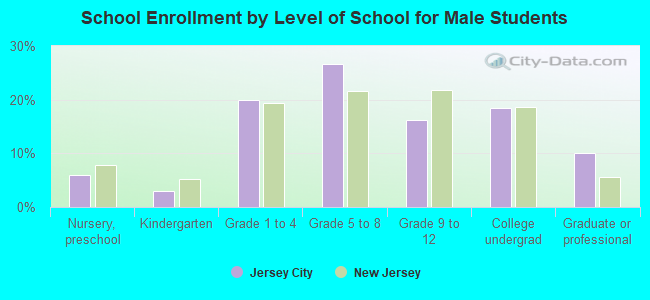
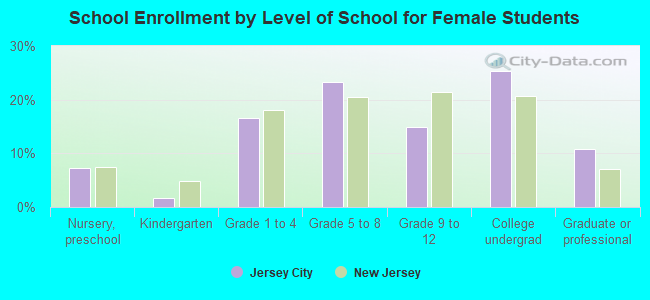
Private vs. public school enrollment:
| Here: | 9.6% |
| New Jersey: | 12.3% |
| Here: | 9.8% |
| New Jersey: | 13.1% |
| Here: | 36.5% |
| New Jersey: | 33.2% |