Isla Vista, CA (California) Houses and Residents
| Isla Vista: | $1,123,197 |
| California: | $715,900 |
Mean price in 2022:
Detached houses: $1,184,739
Here: $1,184,739 State: $988,808 Townhouses or other attached units: $657,170
Here: $657,170 State: $838,546
Total population: 23,096 (Urban population: 18,381, Rural population: 0)
Houses: 5,298 (4,825 occupied: 68 owner occupied, 4,784 renter occupied)
| % of renters here: | 99% |
| State: | 44% |
Housing density: 2,494 houses/condos per square mile
Median price asked for vacant for-sale houses and condos in 2022 in this county: $300,986.
Median contract rent in 2022: $1,830 (lower quartile is $1,472, upper quartile is over $2,000)
Median rent asked for vacant for-rent units in 2022: $2,626
Median gross rent in Isla Vista, CA in 2022: $1,861
Housing units in Isla Vista with a mortgage: 34 (13 second mortgage, 0 home equity loan, 13 both second mortgage and home equity loan)
Houses without a mortgage: 0
Compare current foreclosures near Isla Vista, CA:
| Photo | Address | Area | Beds / Baths | Price | Details |
|---|---|---|---|---|---|

|
#1
Mesa School Ln
Santa Barbara, CA 93109
|
1,432 sq. feet
|
1 baths 3 beds |
show details | |

|
#2
Modoc Rd
Santa Barbara, CA 93110
|
1,010 sq. feet
|
2 baths 2 beds |
show details | |

|
#3
La Plata
Santa Barbara, CA 93109
|
1,418 sq. feet
|
3 baths 3 beds |
show details | |

|
#4
Castillo St
Santa Barbara, CA 93101
|
1,424 sq. feet
|
2 baths 3 beds |
show details | |

|
#5
San Andres St
Santa Barbara, CA 93101
|
620 sq. feet
|
2 baths 3 beds |
show details | |

|
#6
Donze Ave
Santa Barbara, CA 93101
|
1,059 sq. feet
|
2 baths 2 beds |
show details | |

|
#7
Burtis St
Santa Barbara, CA 93111
|
1,352 sq. feet
|
2 baths 4 beds |
show details | |

|
#8
Las Tunas Rd
Santa Barbara, CA 93103
|
5,190 sq. feet
|
6 baths 4 beds |
show details | |

|
#9
Cadiz Ct
Santa Barbara, CA 93111
|
1,974 sq. feet
|
2 baths 4 beds |
show details | |

|
#10
La Vista Rd
Santa Barbara, CA 93110
|
6,008 sq. feet
|
6 baths 3 beds |
show details |
| Photo | Address | Area | Beds / Baths | Price | Details |
|---|---|---|---|---|---|

|
#11
La Jolla Dr
Santa Barbara, CA 93109
|
1,212 sq. feet
|
2 baths 3 beds |
show details | |

|
#12
Camino Alto
Santa Barbara, CA 93103
|
3,321 sq. feet
|
4 baths 3 beds |
show details | |

|
#13
Cardinal Ave
Goleta, CA 93117
|
1,688 sq. feet
|
2 baths 3 beds |
show details | |

|
#14
Vega Dr
Goleta, CA 93117
|
1,468 sq. feet
|
3 baths 4 beds |
show details | |

|
#15
Padova Dr
Goleta, CA 93117
|
1,665 sq. feet
|
2 baths 4 beds |
show details | |

|
#16
Guava Ave
Goleta, CA 93117
|
2,251 sq. feet
|
4 baths 5 beds |
show details | |

|
#17
Ancona Ave
Goleta, CA 93117
|
1,475 sq. feet
|
3 baths 3 beds |
show details | |

|
#18
San Carpino Dr
Goleta, CA 93117
|
1,482 sq. feet
|
2 baths 4 beds |
show details | |

|
#19
Calle Rinconada
Santa Barbara, CA 93105
|
1,109 sq. feet
|
1 baths 3 beds |
show details | |

|
#20
Coyote Cir
Santa Barbara, CA 93108
|
4,441 sq. feet
|
5 baths 5 beds |
show details |
| Photo | Address | Area | Beds / Baths | Price | Details |
|---|---|---|---|---|---|

|
#21
Por La Mar Cir
Santa Barbara, CA 93103
|
700 sq. feet
|
1 baths 1 beds |
show details | |

|
#22
La Salle Rd
Goleta, CA 93117
|
1,707 sq. feet
|
3 baths 2 beds |
show details | |

|
#23
San Ysidro Rd
Santa Barbara, CA 93108
|
2,436 sq. feet
|
1 baths 2 beds |
show details | |

|
#24
Malaga Cir
Santa Barbara, CA 93110
|
1,739 sq. feet
|
3 baths 2 beds |
show details | |

|
#25
Saint Ann Dr
Santa Barbara, CA 93109
|
1,944 sq. feet
|
2 baths 4 beds |
show details | |

|
#26
Murrell Rd
Santa Barbara, CA 93109
|
1,383 sq. feet
|
2 baths 2 beds |
show details | |

|
#27
San Rafael Ave
Santa Barbara, CA 93109
|
1,068 sq. feet
|
1 baths 3 beds |
show details | |

|
#28
Santa Rosa Ln
Santa Barbara, CA 93108
|
- sq. feet
|
1 baths 2 beds |
show details | |

|
#29
Del Oro Ave
Santa Barbara, CA 93109
|
- sq. feet
|
3 baths 5 beds |
show details | |

|
#30
El Rodeo Rd
Santa Barbara, CA 93110
|
3,264 sq. feet
|
3 baths 3 beds |
show details |
| Photo | Address | Area | Beds / Baths | Price | Details |
|---|---|---|---|---|---|

|
#31
Valdivia Dr
Santa Barbara, CA 93110
|
1,402 sq. feet
|
2 baths 4 beds |
show details | |

|
#32
Valdivia Dr
Santa Barbara, CA 93110
|
1,403 sq. feet
|
2 baths 4 beds |
show details | |

|
#33
Rhoads Ave
Santa Barbara, CA 93111
|
1,967 sq. feet
|
3 baths 4 beds |
show details | |

|
#34
Casitas Rd
Santa Barbara, CA 93103
|
1,295 sq. feet
|
2 baths 3 beds |
show details | |

|
#35
Orange Ave
Goleta, CA 93117
|
1,637 sq. feet
|
2 baths 4 beds |
show details | |

|
#36
Santa Ynez Ct
Santa Barbara, CA 93103
|
1,844 sq. feet
|
2 baths 3 beds |
show details | |

|
#37
Anacapa St
Santa Barbara, CA 93105
|
- sq. feet
|
3 baths 3 beds |
show details | |

|
#38
Dolores Dr
Santa Barbara, CA 93109
|
- sq. feet
|
2 baths 4 beds |
show details | |

|
#39
Calle Palo Colorado
Santa Barbara, CA 93105
|
- sq. feet
|
2 baths 3 beds |
show details | |

|
#40
W Islay St
Santa Barbara, CA 93101
|
- sq. feet
|
1 baths 2 beds |
show details |
| Photo | Address | Area | Beds / Baths | Price | Details |
|---|---|---|---|---|---|

|
#41
Calle Rosales
Santa Barbara, CA 93105
|
- sq. feet
|
2 baths 3 beds |
show details | |

|
#42
Kenwood Rd
Santa Barbara, CA 93109
|
- sq. feet
|
2 baths 3 beds |
show details | |

|
#43
Elizabeth St
Santa Barbara, CA 93103
|
- sq. feet
|
1 baths 2 beds |
show details | |

|
#44
Del Oro Ave
Santa Barbara, CA 93109
|
- sq. feet
|
3 baths 5 beds |
show details | |

|
#45
Baldwin Rd
Santa Barbara, CA 93105
|
- sq. feet
|
1 baths 2 beds |
show details | |

|
#46
Calle Linares
Santa Barbara, CA 93109
|
- sq. feet
|
4 baths 4 beds |
show details | |

|
#47
Calle Linares
Santa Barbara, CA 93109
|
- sq. feet
|
4 baths 4 beds |
show details | |

|
#48
Painted Cave Rd
Santa Barbara, CA 93105
|
- sq. feet
|
2 baths 2 beds |
show details | |

|
#49
Madrona Dr
Santa Barbara, CA 93105
|
- sq. feet
|
1 baths 2 beds |
show details | |

|
Check over 1 million property listings on Foreclosure.com!
|
browse all offers | |||


 | Highgrove, CA's future and gentrification??? (56 replies) |
| Moving to Santa Barbara. Advise on rent and stuff (12 replies) |
| Santa barbara today? (2 replies) |
| I love Santa Barbara (12 replies) |
| San Francisco vs Santa Barbara (job offer in both) (36 replies) |
| What to see in Southern California? (10 replies) |

Median year apartment built: 1975
Household type by relationship:
Households: 14,676- Male householders: 2,622 (986 living alone), Female householders: 2,124 (326 living alone)
191 spouses (182 opposite-sex spouses), 209 unmarried partners, (192 opposite-sex unmarried partners), 331 children (293 natural, 0 adopted, 38 stepchildren), 0 grandchildren, 138 brothers or sisters, 8 parents, 0 foster children, 54 other relatives, 7,483 non-relatives
- In group quarters: 1,510
Size of family households: 193 2-persons, 84 3-persons, 108 4-persons, 6 5-persons, 7 7-or-more-persons.
Size of nonfamily households: 1,318 1-person, 1,568 2-persons, 571 3-persons, 1,175 4-persons, 121 5-persons, 222 6-persons, 178 7-or-more-persons.
98 married couples with children.
135 single-parent households (74 men, 61 women).
72.6% of residents of Isla Vista speak English at home.
11.1% of residents speak Spanish at home (88% speak English very well, 5% speak English well, 7% speak English not well).
4.8% of residents speak other Indo-European language at home (94% speak English very well, 1% speak English well, 5% speak English not well).
10.4% of residents speak Asian or Pacific Island language at home (76% speak English very well, 18% speak English well, 6% speak English not well).
1.1% of residents speak other language at home (78% speak English very well, 8% speak English well, 14% speak English not well).
Foreign born population: 1,908 (13.0%)
(18.8% of them are naturalized citizens)
| Here: | 5.6 |
| State: | 6.0 |
| Here: | 3.2 |
| State: | 3.9 |

- Bedrooms in owner-occupied houses and condos in Isla Vista, California
- 23no bedroom
- 01 bedroom
- 82 bedrooms
- 03 bedrooms
- 374 bedrooms
- 05+ bedrooms

- Bedrooms in renter-occupied apartments in Isla Vista, California
- 600no bedroom
- 1,8371 bedroom
- 1,4752 bedrooms
- 5893 bedrooms
- 1554 bedrooms
- 1285+ bedrooms

- Cars and other vehicles available in Isla Vista in owner-occupied houses/condos
- 0no vehicle
- 421 vehicle
- 162 vehicles
- 03 vehicles
- 04 vehicles
- 105+ vehicles

- Cars and other vehicles available in Isla Vista in renter-occupied apartments
- 830no vehicle
- 2,0551 vehicle
- 9342 vehicles
- 3893 vehicles
- 3014 vehicles
- 2755+ vehicles

- Rooms in owner-occupied houses in Isla Vista, California
- 231 room
- 02 rooms
- 03 rooms
- 04 rooms
- 85 rooms
- 186 rooms
- 87 rooms
- 108 rooms
- 09+ rooms

- Rooms in renter-occupied apartments in Isla Vista, California
- 5371 room
- 8162 rooms
- 1,3123 rooms
- 1,2444 rooms
- 3745 rooms
- 3306 rooms
- 967 rooms
- 408 rooms
- 369+ rooms


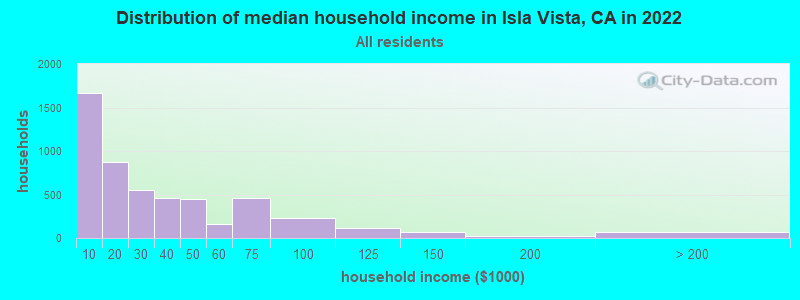
Isla Vista, CA household income distribution

- 1,664Less than $10,000
- 876$10,000 to $19,999
- 552$20,000 to $29,999
- 457$30,000 to $39,999
- 447$40,000 to $49,999
- 160$50,000 to $59,999
- 462$60,000 to $74,999
- 235$75,000 to $99,999
- 112$100,000 to $124,999
- 70$125,000 to $149,999
- 18$150,000 to $199,999
- 65$200,000 or more
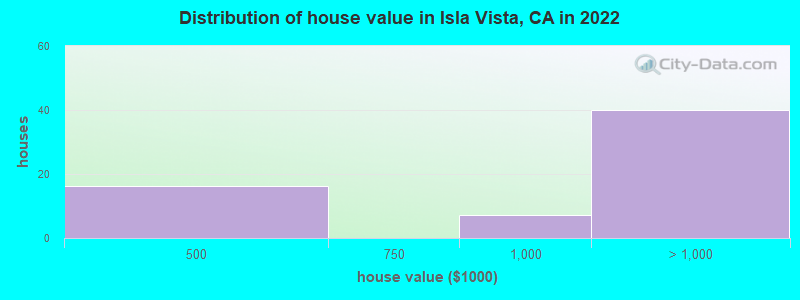
Home value of owner - occupied houses in 2022 in Isla Vista, CA
-
- 16$400,000 to $499,999
- 7$750,000 to $999,999
- 6$1,000,000 to $1,499,999
- 32$1,500,000 to $1,999,999
Rent paid by renters in 2022 in Isla Vista, CA
-
- 6Less than $100
- 5$150 to $199
- 43$200 to $249
- 22$650 to $699
- 12$700 to $749
- 86$750 to $799
- 69$800 to $899
- 187$900 to $999
- 495$1,000 to $1,249
- 357$1,250 to $1,499
- 1,857$1,500 to $1,999
- 621$2,000 to $2,499
- 202$2,500 to $2,999
- 354$3,000 to $3,499
- 663$3,500 or more
- 16No cash rent


Percentage of workers working in this county: 96.1%
Number of people working at home: 587 (8.9% of all workers)
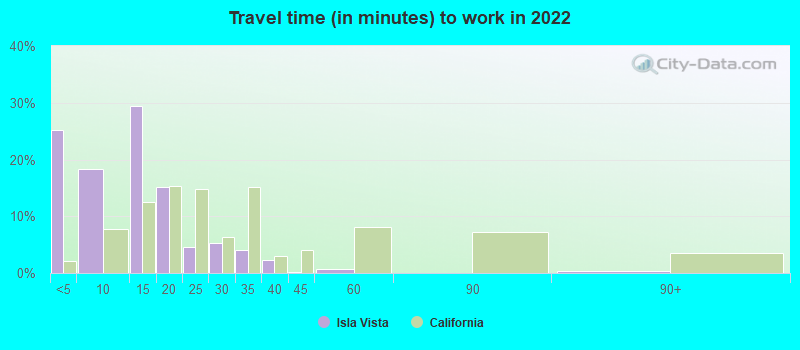
Travel time to work (commute)
- Less than 5 minutes: 472
- 5 to 9 minutes: 812
- 10 to 14 minutes: 1,959
- 15 to 19 minutes: 1,410
- 20 to 24 minutes: 469
- 25 to 29 minutes: 398
- 30 to 34 minutes: 285
- 35 to 39 minutes: 51
- 40 to 44 minutes: 63
- 45 to 59 minutes: 22
- 60 to 89 minutes: 102
- 90 or more minutes: 44
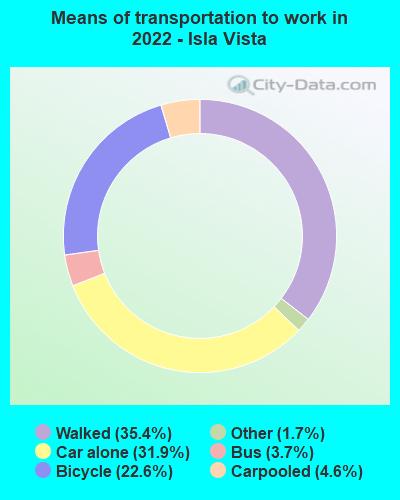
Means of transportation to work:
- Drove a car alone: 510 (23.5%)
- Carpooled: 68 (3.1%)
- Bus: 64 (2.9%)
- Taxi: 43 (2.0%)
- Bicycle: 423 (19.5%)
- Walked: 862 (39.7%)
- Worked at home: 587 (27.0%)

- Unemployment by race in 2022
- Unemployment rate for White non-Hispanic residents
- 6.8%Males
- 24.9%Females
- Unemployment rate for Black residents
- 34.9%Females
- Unemployment rate for Asian residents
- 4.9%Males
- 4.1%Females
- Unemployment rate for other race residents
- 14.6%Males
- 2.7%Females
- Unemployment rate for two or more race residents
- 6.0%Males
- 37.5%Females
- Unemployment rate for Hispanic or Latino residents
- 9.2%Males
- 9.7%Females

- Year of entry for the foreign-born population in Isla Vista, California
- 1,1852010 or later
- 5652000 to 2009
- 2101990 to 1999
- 1,3471980 to 1989
- 1181970 to 1979
- 66Before 1970

First ancestries reported:
- English: 436 (6.4%)
- Italian: 345 (5.0%)
- European: 258 (3.8%)
- American: 218 (3.2%)
- German: 184 (2.7%)
- Swedish: 182 (2.7%)
- Irish: 162 (2.4%)
- Iranian: 141 (2.1%)
- Armenian: 113 (1.7%)
- Norwegian: 104 (1.5%)
- Dutch: 79 (1.2%)
- Ethiopian: 78 (1.1%)
- Egyptian: 64 (0.9%)
- British: 52 (0.8%)
- Polish: 49 (0.7%)
- Australian: 37 (0.5%)
- Serbian: 37 (0.5%)
- Canadian: 35 (0.5%)
- French: 33 (0.5%)
- Swiss: 33 (0.5%)
- Yugoslavian: 32 (0.5%)
- Russian: 31 (0.5%)
- Northern European: 29 (0.4%)
- Portuguese: 27 (0.4%)
- Danish: 21 (0.3%)
- Scottish: 21 (0.3%)
- Greek: 16 (0.2%)
- Czech: 12 (0.2%)
- Lebanese: 11 (0.2%)
- Israeli: 10 (0.1%)
- Latvian: 7 (0.1%)
- Scandinavian: 5 (0.07%)
- Syrian: 2 (0.03%)
- Brazilian: 2 (0.03%)
- Slavic: 2 (0.03%)
Most common places of birth for foreign-born residents (%):
| Isla Vista: | 28.2% (567) |
| California: | 6.6% (684,672) |
| Isla Vista: | 14.1% (283) |
| California: | 37.2% (3,881,193) |
| Isla Vista: | 7.2% (145) |
| California: | 7.8% (818,297) |
| Isla Vista: | 6.4% (129) |
| California: | 3.0% (315,248) |
| Isla Vista: | 3.7% (74) |
| California: | 5.2% (539,184) |
| Isla Vista: | 3.5% (71) |
| California: | 1.0% (103,575) |
| Isla Vista: | 3.1% (63) |
| California: | 0.3% (31,439) |
| Isla Vista: | 2.5% (50) |
| California: | 4.2% (440,287) |
| Isla Vista: | 2.4% (48) |
| California: | 0.6% (57,953) |
| Isla Vista: | 2.2% (45) |
| California: | 1.7% (176,274) |
| Isla Vista: | 2.1% (42) |
| California: | 0.4% (42,718) |
| Isla Vista: | 2.0% (40) |
| California: | 0.3% (33,960) |
| Isla Vista: | 1.9% (39) |
| California: | 0.2% (15,939) |
| Isla Vista: | 1.9% (39) |
| California: | 0.8% (78,847) |
| Isla Vista: | 1.9% (38) |
| California: | 0.2% (18,366) |
| Isla Vista: | 1.8% (37) |
| California: | 2.8% (290,436) |
| Isla Vista: | 1.8% (36) |
| California: | 0.0% (3,677) |
| Isla Vista: | 1.6% (32) |
| California: | 0.3% (33,029) |
Place of birth for U.S.-born residents:
- This state: 10,401
- Other state: 2,232
- Northeast: 414
- Midwest: 555
- South: 542
- West: 750
25.3% of Isla Vista residents lived in the same house 1 years ago.
Out of people who lived in different houses, 35.4% lived in this county.
Out of people who lived in different counties, 92.6% lived in California.
| Isla Vista: | 25.3% |
| State average: | 88.9% |
Education attainment for males 25 years and older:
- No schooling: 13
- Nursery to 4th grade: 7
- 5th and 6th grade: 0
- 7th and 8th grade: 8
- 9th grade: 23
- 10th grade: 5
- 11th grade: 0
- 12th grade, no diploma: 46
- High school graduate (or equivalency): 224
- Less than 1 year of college: 81
- Some college more than 1 year, no degree: 217
- Associate degree: 56
- Bachelor's degree: 248
- Master's degree: 166
- Professional school degree: 31
- Doctorate degree: 85

Education attainment for females 25 years and older:
- No schooling: 8
- Nursery to 4th grade: 0
- 5th and 6th grade: 12
- 7th and 8th grade: 0
- 9th grade: 3
- 10th grade: 0
- 11th grade: 0
- 12th grade, no diploma: 69
- High school graduate (or equivalency): 18
- Less than 1 year of college: 36
- Some college more than 1 year, no degree: 88
- Associate degree: 8
- Bachelor's degree: 157
- Master's degree: 123
- Professional school degree: 8
- Doctorate degree: 31


Housing units in structures:
- One, detached: 286
- One, attached: 182
- Two: 565
- 3 or 4: 604
- 5 to 9: 953
- 10 to 19: 835
- 20 to 49: 609
- 50 or more: 1,259
Housing units lacking complete kitchen facilities in 2022: 6.6%
House/condo owner moved in on average 10 years ago
Renter moved in on average 0 years ago

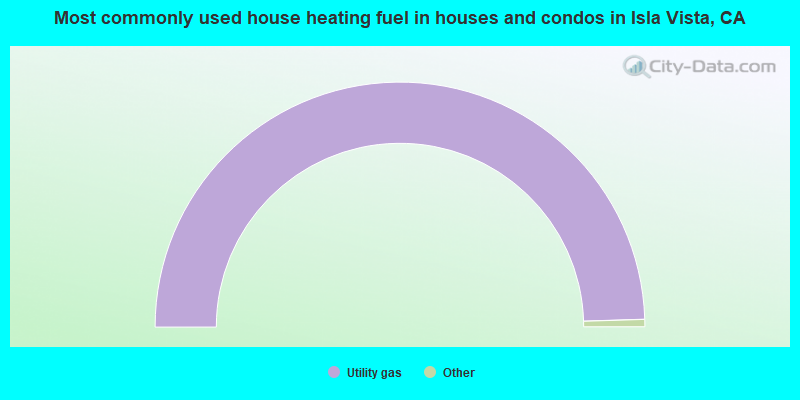
- 100.0%Utility gas
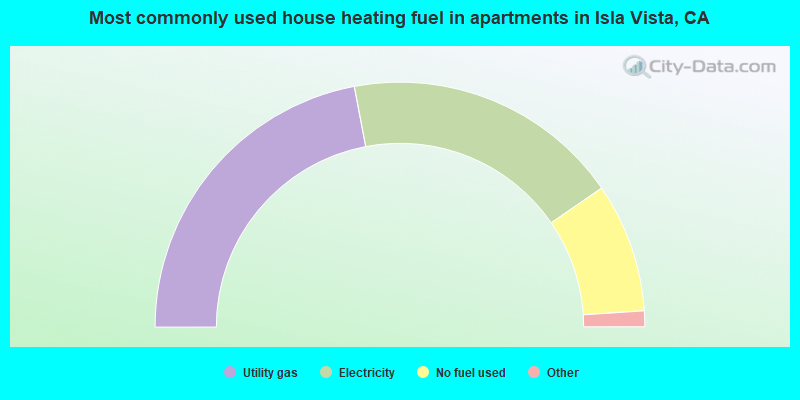
- 44.1%Utility gas
- 36.8%Electricity
- 17.1%No fuel used
- 1.4%Bottled, tank, or LP gas
- 0.4%Other fuel
- 0.3%Fuel oil, kerosene, etc.
Private vs. public school enrollment:
| Here: | 10.7% |
| California: | 10.5% |
| Here: | 0.0% |
| California: | 8.5% |
| Here: | 1.6% |
| California: | 15.9% |


