Jump to a detailed profile or search site with Google Custom Search

Huntsville, AL (Alabama) Houses and Residents

Estimated median house or condo value in 2022: $294,700 (it was $95,600 in 2000)
Huntsville:

$294,700
Alabama:

$200,900
Lower value quartile - upper value quartile: $185,100 - $442,700

Mean price in 2022:

Detached houses: $373,670
Here:

$373,670
State:

$273,076

Townhouses or other attached units: $237,598
Here:

$237,598
State:

$222,857

In 3-to-4-unit structures: $148,927
Here:

$148,927
State:

$194,388

In 5-or-more-unit structures: $180,177
Here:

$180,177
State:

$307,073

Mobile homes: $32,038
Here:

$32,038
State:

$77,780

Total population: 188,226 (Urban population: 152,143, Rural population: 5,756 (all nonfarm))

Houses: 104,492 (95,683 occupied: 55,182 owner occupied, 40,501 renter occupied)

% of renters here:

42%
State:

30%

Housing density: 600 houses/condos per square mile

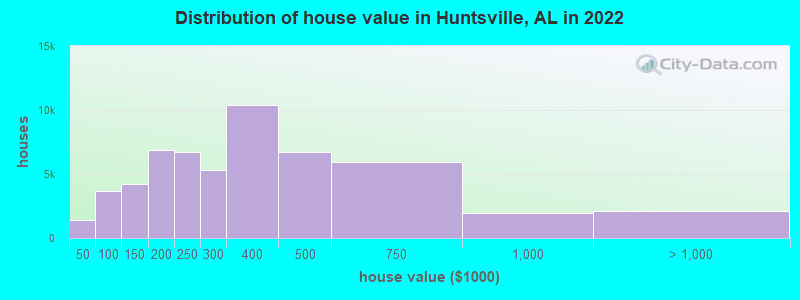
Median price asked for vacant for-sale houses and condos in 2022: $178,626.

Median contract rent in 2022: $885 (lower quartile is $678, upper quartile is $1,225)


Median rent asked for vacant for-rent units in 2022: $2,558


Median gross rent in Huntsville, AL in 2022: $1,074

Housing units in Huntsville with a mortgage: 34,956 (3,351 second mortgage, 0 home equity loan, 3,150 both second mortgage and home equity loan)
Houses without a mortgage: 1,322

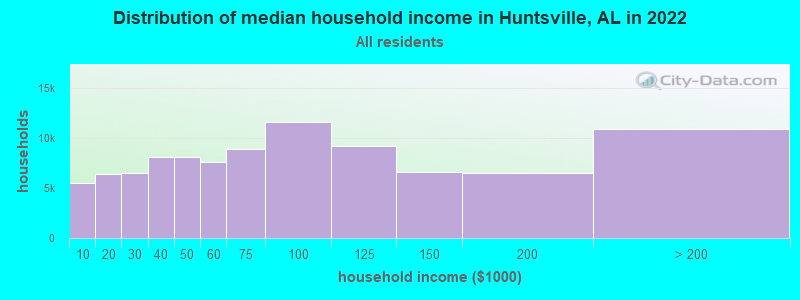
Median household income for houses/condos with a mortgage: $105,362

Median household income for apartments without a mortgage: $76,854

Median monthly housing costs: $1,044

Compare current foreclosures in Huntsville, AL:

Check out more offers in Huntsville, AL.
Powered by Foreclosure.com

Settings
X
Data:
Loading data...
Based on 2000-2022 data
Loading data...

123
Hide US histogram

Latest news about housing in Huntsville, AL collected exclusively by city-data.com from local newspapers, TV, and radio stations

Huntsville, Alabama Age and Sex of Residents
Median year house/condo built: 1985

Median year apartment built: 1986

Household type by relationship:

Households: 222,363
  • Male householders: 50,121 (16,584 living alone), Female householders: 45,562 (18,239 living alone)
  • 38,230 spouses (37,763 opposite-sex spouses), 6,114 unmarried partners, (5,625 opposite-sex unmarried partners), 54,439 children (49,714 natural, 1,453 adopted, 3,272 stepchildren), 2,858 grandchildren, 3,086 brothers or sisters, 1,926 parents, 0 foster children, 2,839 other relatives, 7,271 non-relatives
  • In group quarters: 9,917

Size of family households: 27,482 2-persons, 12,184 3-persons, 8,518 4-persons, 3,537 5-persons, 1,200 6-persons, 432 7-or-more-persons.

Size of nonfamily households: 34,823 1-person, 6,518 2-persons, 706 3-persons, 201 4-persons, 59 5-persons, 23 7-or-more-persons.

26,947 married couples with children.
13,006 single-parent households (3,453 men, 9,553 women).

91.6% of residents of Huntsville speak English at home.
4.7% of residents speak Spanish at home (58% speak English very well, 23% speak English well, 16% speak English not well, 3% don't speak English at all).
1.9% of residents speak other Indo-European language at home (72% speak English very well, 24% speak English well, 2% speak English not well, 1% don't speak English at all).
1.3% of residents speak Asian or Pacific Island language at home (42% speak English very well, 44% speak English well, 12% speak English not well, 1% don't speak English at all).
0.7% of residents speak other language at home (81% speak English very well, 17% speak English well, 2% speak English not well).

Foreign born population: 12,400 (5.6%)
(48.4% of them are naturalized citizens)

Median number of rooms in houses and condos:
Here:

7.2
State:

6.5

Median number of rooms in apartments
Here:

4.4
State:

4.7

Owner-occupied Renter-occupied
Bedrooms in owner-occupied houses and condos in Huntsville, Alabama
  • Bedrooms in owner-occupied houses and condos in Huntsville, Alabama
  • 0no bedroom
  • 5621 bedroom
  • 4,0492 bedrooms
  • 26,5693 bedrooms
  • 18,0994 bedrooms
  • 5,9035+ bedrooms
Bedrooms in renter-occupied apartments in Huntsville, Alabama
  • Bedrooms in renter-occupied apartments in Huntsville, Alabama
  • 2,265no bedroom
  • 10,2361 bedroom
  • 14,4782 bedrooms
  • 10,9763 bedrooms
  • 2,4244 bedrooms
  • 1225+ bedrooms
Owner-occupied Renter-occupied
Cars and other vehicles available in Huntsville in owner-occupied houses/condos
  • Cars and other vehicles available in Huntsville in owner-occupied houses/condos
  • 1,318no vehicle
  • 15,9331 vehicle
  • 23,7972 vehicles
  • 10,3883 vehicles
  • 2,9994 vehicles
  • 7475+ vehicles
Cars and other vehicles available in Huntsville in renter-occupied apartments
  • Cars and other vehicles available in Huntsville in renter-occupied apartments
  • 3,115no vehicle
  • 23,0741 vehicle
  • 11,0282 vehicles
  • 2,1413 vehicles
  • 5224 vehicles
  • 6215+ vehicles
Owner-occupied Renter-occupied
Rooms in owner-occupied houses in Huntsville, Alabama
  • Rooms in owner-occupied houses in Huntsville, Alabama
  • 01 room
  • 482 rooms
  • 5773 rooms
  • 2,5494 rooms
  • 8,4845 rooms
  • 10,1336 rooms
  • 8,9217 rooms
  • 8,7508 rooms
  • 15,7209+ rooms
Rooms in renter-occupied apartments in Huntsville, Alabama
  • Rooms in renter-occupied apartments in Huntsville, Alabama
  • 2,2091 room
  • 3,5862 rooms
  • 5,9543 rooms
  • 9,4824 rooms
  • 8,8005 rooms
  • 5,7996 rooms
  • 2,7847 rooms
  • 1,0498 rooms
  • 8389+ rooms
Year house built
Median 2022 house/condo value by year built
Median house/condo value by year householder moved into unit
Breakdown of mean house values by ages of householders
Owners and renters by unit type in Huntsville, AL
  • Huntsville, AL household income distribution

  • Distribution of median household income in Huntsville, AL in 2022
  • 5,529Less than $10,000
  • 6,357$10,000 to $19,999
  • 6,501$20,000 to $29,999
  • 8,053$30,000 to $39,999
  • 8,106$40,000 to $49,999
  • 7,566$50,000 to $59,999
  • 8,909$60,000 to $74,999
  • 11,586$75,000 to $99,999
  • 9,163$100,000 to $124,999
  • 6,615$125,000 to $149,999
  • 6,451$150,000 to $199,999
  • 10,847$200,000 or more
  • Home value of owner - occupied houses in 2022 in Huntsville, AL

  • Distribution of house value in Huntsville, AL in 2022
  • 724Less than $10,000
  • 143$10,000 to $14,999
  • 114$15,000 to $19,999
  • 45$20,000 to $24,999
  • 108$25,000 to $29,999
  • 132$30,000 to $34,999
  • 119$40,000 to $49,999
  • 168$50,000 to $59,999
  • 553$60,000 to $69,999
  • 1,247$70,000 to $79,999
  • 150$80,000 to $89,999
  • 1,442$90,000 to $99,999
  • 2,568$100,000 to $124,999
  • 1,683$125,000 to $149,999
  • 3,046$150,000 to $174,999
  • 3,862$175,000 to $199,999
  • 6,754$200,000 to $249,999
  • 5,299$250,000 to $299,999
  • 10,370$300,000 to $399,999
  • 6,694$400,000 to $499,999
  • 5,900$500,000 to $749,999
  • 1,983$750,000 to $999,999
  • 1,320$1,000,000 to $1,499,999
  • 393$1,500,000 to $1,999,999
  • 365$2,000,000 or more
  • Rent paid by renters in 2022 in Huntsville, AL

  • Distribution of rent paid by renters in Huntsville, AL in 2022
  • 122$100 to $149
  • 414$150 to $199
  • 59$200 to $249
  • 371$250 to $299
  • 126$300 to $349
  • 1,110$350 to $399
  • 349$400 to $449
  • 804$450 to $499
  • 2,292$500 to $549
  • 1,940$550 to $599
  • 1,197$600 to $649
  • 1,710$650 to $699
  • 1,933$700 to $749
  • 1,977$750 to $799
  • 5,996$800 to $899
  • 3,086$900 to $999
  • 6,388$1,000 to $1,249
  • 5,140$1,250 to $1,499
  • 3,525$1,500 to $1,999
  • 44$2,000 to $2,499
  • 126$2,500 to $2,999
  • 174$3,000 to $3,499
  • 97$3,500 or more
  • 1,521No cash rent
Time Leaving Home To Go To Work in 2022

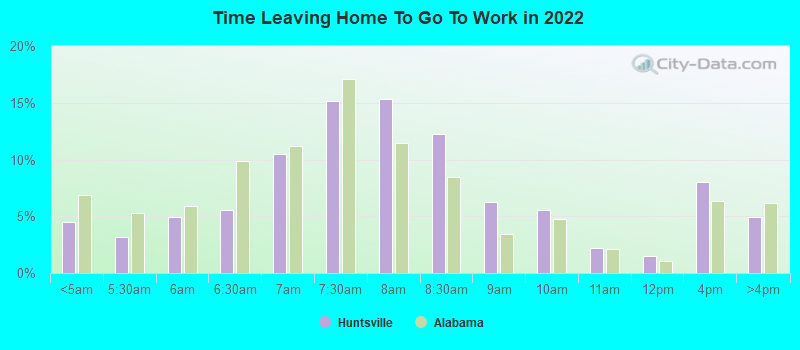
Percentage of workers working in this county: 90.2%
Number of people working at home: 15,121 (13.4% of all workers)

Travel time (in minutes) to work in 2022

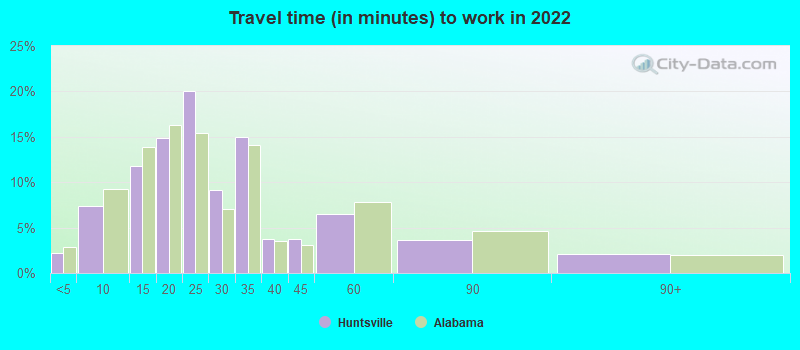
Travel time to work (commute)

  • Less than 5 minutes: 3,101
  • 5 to 9 minutes: 11,329
  • 10 to 14 minutes: 16,455
  • 15 to 19 minutes: 17,476
  • 20 to 24 minutes: 23,622
  • 25 to 29 minutes: 7,154
  • 30 to 34 minutes: 10,492
  • 35 to 39 minutes: 2,132
  • 40 to 44 minutes: 1,332
  • 45 to 59 minutes: 1,855
  • 60 to 89 minutes: 1,431
  • 90 or more minutes: 1,293
Means of transportation to work in 2022 - Huntsville

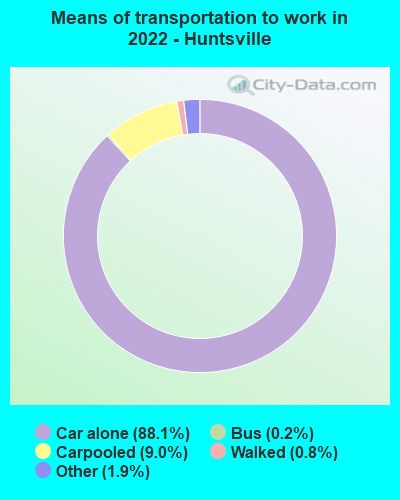
Means of transportation to work:

  • Drove a car alone: 146,318 (80.7%)
  • Carpooled: 15,019 (8.3%)
  • Bus: 409 (0.2%)
  • Taxi: 3,088 (1.7%)
  • Walked: 1,323 (0.7%)
  • Worked at home: 15,121 (8.3%)
Class of Workers in 2022
  • Unemployment by race in 2022
  • Unemployment rate for White non-Hispanic residents
  • 3.0%Males
  • 5.4%Females
  • Unemployment rate for Black residents
  • 4.5%Males
  • 4.5%Females
  • Unemployment rate for American Indian and Alaska Native residents
  • 35.7%Males
  • Unemployment rate for Asian residents
  • 0.6%Males
  • 1.3%Females
  • Unemployment rate for other race residents
  • 0.5%Males
  • 7.5%Females
  • Unemployment rate for two or more race residents
  • 3.0%Males
  • 2.5%Females
  • Unemployment rate for Hispanic or Latino residents
  • 2.7%Males
  • 3.2%Females
Year of entry for the foreign-born population in Huntsville, Alabama
  • Year of entry for the foreign-born population in Huntsville, Alabama
  • 6,0982010 or later
  • 3,0602000 to 2009
  • 2,2861990 to 1999
  • 1,4311980 to 1989
  • 1,0981970 to 1979
  • 1,529Before 1970
Ancestries in Huntsville, AL

First ancestries reported:

  • English: 16,360 (13.5%)
  • American: 13,646 (11.3%)
  • Irish: 6,610 (5.5%)
  • German: 6,400 (5.3%)
  • European: 3,115 (2.6%)
  • Italian: 1,990 (1.6%)
  • Scottish: 1,919 (1.6%)
  • Scotch-Irish: 1,569 (1.3%)
  • Jamaican: 1,313 (1.1%)
  • African: 1,163 (1.0%)
  • Polish: 1,016 (0.8%)
  • Nigerian: 928 (0.8%)
  • French: 872 (0.7%)
  • Dutch: 538 (0.4%)
  • British: 452 (0.4%)
  • West Indian: 380 (0.3%)
  • Norwegian: 364 (0.3%)
  • Bermudan: 356 (0.3%)
  • French Canadian: 266 (0.2%)
  • Ukrainian: 250 (0.2%)
  • Iranian: 205 (0.2%)
  • Swedish: 190 (0.2%)
  • Finnish: 174 (0.1%)
  • Eastern European: 169 (0.1%)
  • Welsh: 157 (0.1%)
  • Czech: 145 (0.1%)
  • Scandinavian: 143 (0.1%)
  • Northern European: 135 (0.1%)
  • Greek: 116 (0.10%)
  • Trinidadian and Tobagonian: 114 (0.09%)
  • Czechoslovakian: 110 (0.09%)
  • Haitian: 105 (0.09%)
  • Romanian: 103 (0.08%)
  • Pennsylvania German: 100 (0.08%)
  • Kenyan: 98 (0.08%)
  • Austrian: 91 (0.08%)
  • Croatian: 72 (0.06%)
  • Slovak: 64 (0.05%)
  • Guyanese: 58 (0.05%)
  • Lebanese: 53 (0.04%)
  • Russian: 52 (0.04%)
  • Belgian: 51 (0.04%)
  • Cajun: 47 (0.04%)
  • Barbadian: 42 (0.03%)
  • Turkish: 39 (0.03%)
  • Bahamian: 38 (0.03%)
  • Canadian: 37 (0.03%)
  • Albanian: 36 (0.03%)
  • Portuguese: 35 (0.03%)
  • Hungarian: 33 (0.03%)
  • Armenian: 30 (0.02%)
  • Danish: 30 (0.02%)
  • Slavic: 29 (0.02%)
  • Sudanese: 28 (0.02%)
  • Syrian: 27 (0.02%)
  • Brazilian: 24 (0.02%)
  • Ethiopian: 16 (0.01%)
  • Serbian: 12 (0.01%)
  • South African: 12 (0.01%)
  • Luxembourger: 12 (0.01%)
  • Swiss: 10 (0.01%)
  • Arab: 8 (0.01%)
  • Icelander: 8 (0.01%)

Most common places of birth for foreign-born residents (%):

Mexico
Huntsville:

19.6% (2,674)
Alabama:

26.4% (46,832)

Guatemala
Huntsville:

5.3% (722)
Alabama:

8.6% (15,159)

Nigeria
Huntsville:

4.9% (669)
Alabama:

1.1% (1,979)

Germany
Huntsville:

4.6% (627)
Alabama:

3.9% (6,831)

India
Huntsville:

4.6% (621)
Alabama:

5.5% (9,672)

Jamaica
Huntsville:

4.1% (566)
Alabama:

1.3% (2,382)

China, excluding Hong Kong and Taiwan
Huntsville:

3.5% (477)
Alabama:

4.6% (8,075)

Korea
Huntsville:

3.0% (412)
Alabama:

5.2% (9,293)

Dominican Republic
Huntsville:

2.9% (389)
Alabama:

0.7% (1,182)

Canada
Huntsville:

2.5% (344)
Alabama:

2.3% (4,000)

Taiwan
Huntsville:

2.3% (313)
Alabama:

0.7% (1,221)

Vietnam
Huntsville:

2.3% (310)
Alabama:

3.6% (6,414)

Other Northern America
Huntsville:

2.0% (276)
Alabama:

0.3% (457)

Colombia
Huntsville:

2.0% (271)
Alabama:

1.1% (2,005)

Pakistan
Huntsville:

1.8% (252)
Alabama:

1.1% (2,005)

Japan
Huntsville:

1.8% (251)
Alabama:

1.3% (2,391)

Iran
Huntsville:

1.7% (232)
Alabama:

0.5% (927)

Honduras
Huntsville:

1.6% (212)
Alabama:

1.9% (3,447)

Place of birth for U.S.-born residents:

  • This state: 115,934
  • Other state: 89,997
  • Northeast: 9,105
  • Midwest: 19,634
  • South: 49,335
  • West: 11,923

80.6% of Huntsville residents lived in the same house 1 years ago.
   Out of people who lived in different houses, 34.0% lived in this county.
   Out of people who lived in different counties, 45.8% lived in Alabama.


Huntsville:

80.6%
State average:

87.6%

Education attainment for males 25 years and older:

  • No schooling: 925
  • Nursery to 4th grade: 37
  • 5th and 6th grade: 148
  • 7th and 8th grade: 509
  • 9th grade: 371
  • 10th grade: 1,290
  • 11th grade: 1,617
  • 12th grade, no diploma: 1,377
  • High school graduate (or equivalency): 12,204
  • Less than 1 year of college: 3,588
  • Some college more than 1 year, no degree: 10,685
  • Associate degree: 3,598
  • Bachelor's degree: 21,800
  • Master's degree: 12,323
  • Professional school degree: 2,633
  • Doctorate degree: 1,925
Educational Attainment for Males

Education attainment for females 25 years and older:

  • No schooling: 700
  • Nursery to 4th grade: 84
  • 5th and 6th grade: 195
  • 7th and 8th grade: 793
  • 9th grade: 423
  • 10th grade: 1,049
  • 11th grade: 709
  • 12th grade, no diploma: 1,650
  • High school graduate (or equivalency): 15,120
  • Less than 1 year of college: 4,700
  • Some college more than 1 year, no degree: 10,243
  • Associate degree: 6,364
  • Bachelor's degree: 18,869
  • Master's degree: 12,670
  • Professional school degree: 1,414
  • Doctorate degree: 1,291
Educational Attainment for Females
Huntsville marital status for males
Huntsville marital status for females

Housing units in structures:

  • One, detached: 65,795
  • One, attached: 3,470
  • Two: 1,528
  • 3 or 4: 6,677
  • 5 to 9: 7,942
  • 10 to 19: 7,687
  • 20 to 49: 4,725
  • 50 or more: 4,780
  • Mobile homes: 1,888

Median worth of mobile homes: $9,999

Housing units lacking complete plumbing facilities in 2022: 0.2%

Housing units lacking complete kitchen facilities in 2022: 1.0%

House/condo owner moved in on average 10 years ago

Renter moved in on average 2 years ago

Year householders moved into residence in Huntsville
Houses and condos Apartments
Most commonly used house heating fuel in houses and condos in Huntsville, AL
  • 66.6%Electricity
  • 31.3%Utility gas
  • 1.5%Bottled, tank, or LP gas
  • 0.3%No fuel used
  • 0.2%Fuel oil, kerosene, etc.
Most commonly used house heating fuel in apartments in Huntsville, AL
  • 87.3%Electricity
  • 10.8%Utility gas
  • 1.0%No fuel used
  • 0.7%Bottled, tank, or LP gas
  • 0.3%Wood

Private vs. public school enrollment:

Students in private schools in grades 1 to 8 (elementary and middle school): 3,530
Here:

21.0%
Alabama:

14.7%

Students in private schools in grades 9 to 12 (high school): 2,247
Here:

22.2%
Alabama:

16.3%

Students in private undergraduate colleges: 2,765
Here:

15.5%
Alabama:

14.6%
School Enrollment by Level of School for Male Students
School Enrollment by Level of School for Female Students
Age and Sex of Sensory-Disabled Noninstitutionalized Residents
Age and Sex of Physically-Disabled Noninstitutionalized Residents
Age and Sex of Mentally-Disabled Noninstitutionalized Residents
Age and Sex of Self-Care Disabled Noninstitutionalized Residents
Age and Sex of Go-Outside-Home Disabled Noninstitutionalized Residents
Age and Sex of Noninstitutionalized Residents with Employment Disability