Holly Springs, NC (North Carolina) Houses and Residents
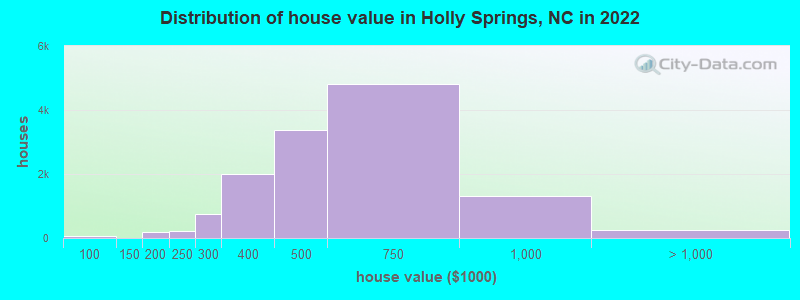
Estimated median house or condo value in 2022: $548,216 (it was $160,800 in 2000 )
Holly Springs:
$548,216North Carolina:
$280,600
Lower value quartile - upper value quartile: $428,948 - $724,395Mean price in 2022: Detached houses: $459,091 Here:
$459,091State:
$375,326
Townhouses or other attached units: $295,761 Here:
$295,761State:
$317,935
Mobile homes: $471,687 Here:
$471,687State:
$124,933
Total population: 30,157 (Urban population: 7,917, Rural population: 1,258 (all nonfarm) )
Houses: 15,178 (14,366 occupied: 11,567 owner occupied, 2,501 renter occupied )
% of renters here:
18%State:
33%
Housing density: 2,027 houses/condos per square mile
Median price asked for vacant for-sale houses and condos in 2022: $298,600.
Median contract rent in 2022: $1,649 (lower quartile is $1,325, upper quartile is over $2,000)
Median rent asked for vacant for-rent units in 2022: $2,739
Median gross rent in Holly Springs, NC in 2022: $1,804
Housing units in Holly Springs with a mortgage: 9,426 (850 second mortgage, 26 home equity loan, 761 both second mortgage and home equity loan )Houses without a mortgage: 41
Median household income for houses/condos with a mortgage: $143,586
Median household income for apartments without a mortgage: $118,220
Median monthly housing costs: $1,964
Data:
Median house or condo value ($)
Median house or condo value ($ change since 2000)
Median house or condo value ($) - White
Median house or condo value ($) - Black or African American
Median house or condo value ($) - Asian
Median house or condo value ($) - Hispanic or Latino
Median house or condo value ($) - American Indian and Alaska Native
Median house or condo value ($) - Multirace
Median house or condo value ($) - Other Race
Median price asked for mobile homes ($)
Household density (households per square mile)
Mean house or condo value by units in structure - 1, detached ($)
Mean house or condo value by units in structure - 1, attached ($)
Mean house or condo value by units in structure - 2 ($)
Mean house or condo value by units in structure by units in structure - 3 or 4 ($)
Mean house or condo value by units in structure - 5 or more ($)
Mean house or condo value by units in structure - Boat, RV, van, etc. ($)
Mean house or condo value by units in structure - Mobile home ($)
Median contract rent ($)
Median contract rent - Lower quartile ($)
Median contract rent - Upper quartile ($)
Median gross rent ($)
Urban houses (%)
Rural houses (%)
Houses occupied (%)
Houses occupied (% change since 2000)
Houses owner occupied (%)
Houses owner occupied (% change since 2000)
Houses renter occupied (%)
Houses renter occupied (% change since 2000)
Vacant housing units - For rent (%)
Vacant housing units - For rent (% change since 2000)
Vacant housing units - For sale only (%)
Vacant housing units - For sale only (% change since 2000)
Vacant housing units - Rented or sold, not occupied (%)
Vacant housing units - Rented or sold, not occupied (% change since 2000)
Vacant housing units - For seasonal, recreational, or occasional use (%)
Vacant housing units - For seasonal, recreational, or occasional use (% change since 2000)
Vacant housing units - For migrant workers (%)
Vacant housing units - For migrant workers (% change since 2000)
Vacant housing units - Other vacant (%)
Vacant housing units - Other vacant (% change since 2000)
Median monthly housing costs ($)
Median household income for houses/condos with a mortgage ($)
Median household income for houses/condos without a mortgage ($)
Median household income ($)
Median household income ($) - White
Median household income ($) - Black or African American
Median household income ($) - Asian
Median household income ($) - Hispanic or Latino
Median household income ($) - American Indian and Alaska Native
Median household income ($) - Multirace
Median household income ($) - Other Race
Mortgage status - with mortgage (%)
Mortgage status - with second mortgage (%)
Mortgage status - with home equity loan (%)
Mortgage status - with both second mortgage and home equity loan (%)
Mortgage status - without a mortgage (%)
Median year house/condo built
Median year apartment built
Household type by relationship - Male householder living alone (%)
Household type by relationship - Male householder not living alone (%)
Household type by relationship - Female householder living alone (%)
Household type by relationship - Female householder not living alone (%)
Household type by relationship - Opposite-Sex spouse (%)
Household type by relationship - Same-Sex spouse (%)
Household type by relationship - Opposite-Sex unmarried partner (%)
Household type by relationship - Same-Sex unmarried partner (%)
Household type by relationship - In group quarters (%)
Size of family households - 2-person household (%)
Size of family households - 3-person household (%)
Size of family households - 4-person household (%)
Size of family households - 5-person household (%)
Size of family households - 6-person household (%)
Size of family households - 7-or-more-person household (%)
Size of nonfamily households - 1-person household (%)
Size of nonfamily households - 2-person household (%)
Size of nonfamily households - 3-person household (%)
Size of nonfamily households - 4-person household (%)
Size of nonfamily households - 5-person household (%)
Size of nonfamily households - 6-person household (%)
Size of nonfamily households - 7-or-moreperson household (%)
Year house built - Built 2010 or later (%)
Year house built - Built 2000 to 2009 (%)
Year house built - Built 1990 to 1999 (%)
Year house built - Built 1980 to 1989 (%)
Year house built - Built 1970 to 1979 (%)
Year house built - Built 1960 to 1969 (%)
Year house built - Built 1950 to 1959 (%)
Year house built - Built 1940 to 1949 (%)
Year house built - Built 1939 or earlier (%)
Median number of rooms in houses and condos
Median number of rooms in apartments
Median number of bedrooms in owner occupied houses
Mean number of bedrooms in owner occupied houses
Median number of bedrooms in renter occupied houses
Mean number of bedrooms in renter occupied houses
Median number of vehichles in owner occupied houses
Mean number of vehichles in owner occupied houses
Median number of vehichles in renter occupied houses
Mean number of vehichles in renter occupied houses
Rooms in owner-occupied houses - 1 room (%)
Rooms in owner-occupied houses - 2 rooms (%)
Rooms in owner-occupied houses - 3 rooms (%)
Rooms in owner-occupied houses - 4 rooms (%)
Rooms in owner-occupied houses - 5 rooms (%)
Rooms in owner-occupied houses - 6 rooms (%)
Rooms in owner-occupied houses - 7 rooms (%)
Rooms in owner-occupied houses - 8 rooms (%)
Rooms in owner-occupied houses - 9+ rooms (%)
Rooms in renter-occupied houses - 1 room (%)
Rooms in renter-occupied houses - 2 rooms (%)
Rooms in renter-occupied houses - 3 rooms (%)
Rooms in renter-occupied houses - 4 rooms (%)
Rooms in renter-occupied houses - 5 rooms (%)
Rooms in renter-occupied houses - 6 rooms (%)
Rooms in renter-occupied houses - 7 rooms (%)
Rooms in renter-occupied houses - 8 rooms (%)
Rooms in renter-occupied houses - 9+ rooms (%)
Bedrooms in owner-occupied houses - no bedrooms (%)
Bedrooms in owner-occupied houses - 1 bedroom (%)
Bedrooms in owner-occupied houses - 2 bedrooms (%)
Bedrooms in owner-occupied houses - 3 bedrooms (%)
Bedrooms in owner-occupied houses - 4 bedrooms (%)
Bedrooms in owner-occupied houses - 5+ bedrooms (%)
Bedrooms in renter-occupied houses - no bedrooms (%)
Bedrooms in renter-occupied houses - 1 bedroom (%)
Bedrooms in renter-occupied houses - 2 bedrooms (%)
Bedrooms in renter-occupied houses - 3 bedrooms (%)
Bedrooms in renter-occupied houses - 4 bedrooms (%)
Bedrooms in renter-occupied houses - 5+ bedrooms (%)
Vehicles available in owner-occupied houses - no vehicle available (%)
Vehicles available in owner-occupied houses - 1 vehicle available(%)
Vehicles available in owner-occupied houses - 2 Vehicles available (%)
Vehicles available in owner-occupied houses - 3 Vehicles available (%)
Vehicles available in owner-occupied houses - 4 Vehicles available (%)
Vehicles available in owner-occupied houses - 5+ Vehicles available (%)
Vehicles available in renter-occupied houses - no vehicle available (%)
Vehicles available in renter-occupied houses - 1 vehicle available (%)
Vehicles available in renter-occupied houses - 2 Vehicles available (%)
Vehicles available in renter-occupied houses - 3 Vehicles available (%)
Vehicles available in renter-occupied houses - 4 Vehicles available (%)
Vehicles available in renter-occupied houses - 5+ Vehicles available (%)
Housing units in structures - 1, detached (%)
Housing units in structures - 1, attached (%)
Housing units in structures - 2 (%)
Housing units in structures - 3 or 4 (%)
Housing units in structures - 5 to 9 (%)
Housing units in structures - 10 to 19 (%)
Housing units in structures - 20 to 49 (%)
Housing units in structures - 50 or more (%)
Housing units in structures - Mobile home (%)
Housing units in structures - Boat, RV, van, etc. (%)
Housing units in structures - Owners - 1, detached (%)
Housing units in structures - Owners - 1, attached (%)
Housing units in structures - Owners - 2 (%)
Housing units in structures - Owners - 3 or 4 (%)
Housing units in structures - Owners - 5 to 9 (%)
Housing units in structures - Owners - 10 to 19 (%)
Housing units in structures - Owners - 20 to 49 (%)
Housing units in structures - Owners - 50 or more (%)
Housing units in structures - Owners - Mobile home (%)
Housing units in structures - Owners - Boat, RV, van, etc. (%)
Housing units in structures - Renters - 1, detached (%)
Housing units in structures - Renters - 1, attached (%)
Housing units in structures - Renters - 2 (%)
Housing units in structures - Renters - 3 or 4 (%)
Housing units in structures - Renters - 5 to 9 (%)
Housing units in structures - Renters - 10 to 19 (%)
Housing units in structures - Renters - 20 to 49 (%)
Housing units in structures - Renters - 50 or more (%)
Housing units in structures - Renters - Mobile home (%)
Housing units in structures - Renters - Boat, RV, van, etc. (%)
House/condo owner moved in on average (years ago)
Renter moved in on average (years ago)
Year householder moved into unit - Moved in 1999 to March 2000 (%)
Year householder moved into unit - Moved in 1999 to March 2000 (%) - White
Year householder moved into unit - Moved in 1999 to March 2000 (%) - Black or African American
Year householder moved into unit - Moved in 1999 to March 2000 (%) - Asian
Year householder moved into unit - Moved in 1999 to March 2000 (%) - Hispanic or Latino
Year householder moved into unit - Moved in 1999 to March 2000 (%) - American Indian and Alaska Native
Year householder moved into unit - Moved in 1999 to March 2000 (%) - Multirace
Year householder moved into unit - Moved in 1999 to March 2000 (%) - Other Race
Year householder moved into unit - Moved in 1995 to 1998 (%)
Year householder moved into unit - Moved in 1995 to 1998 (%) - White
Year householder moved into unit - Moved in 1995 to 1998 (%) - Black or African American
Year householder moved into unit - Moved in 1995 to 1998 (%) - Asian
Year householder moved into unit - Moved in 1995 to 1998 (%) - Hispanic or Latino
Year householder moved into unit - Moved in 1995 to 1998 (%) - American Indian and Alaska Native
Year householder moved into unit - Moved in 1995 to 1998 (%) - Multirace
Year householder moved into unit - Moved in 1995 to 1998 (%) - Other Race
Year householder moved into unit - Moved in 1990 to 1994 (%)
Year householder moved into unit - Moved in 1990 to 1994 (%) - White
Year householder moved into unit - Moved in 1990 to 1994 (%) - Black or African American
Year householder moved into unit - Moved in 1990 to 1994 (%) - Asian
Year householder moved into unit - Moved in 1990 to 1994 (%) - Hispanic or Latino
Year householder moved into unit - Moved in 1990 to 1994 (%) - American Indian and Alaska Native
Year householder moved into unit - Moved in 1990 to 1994 (%) - Multirace
Year householder moved into unit - Moved in 1990 to 1994 (%) - Other Race
Year householder moved into unit - Moved in 1980 to 1989 (%)
Year householder moved into unit - Moved in 1980 to 1989 (%) - White
Year householder moved into unit - Moved in 1980 to 1989 (%) - Black or African American
Year householder moved into unit - Moved in 1980 to 1989 (%) - Asian
Year householder moved into unit - Moved in 1980 to 1989 (%) - Hispanic or Latino
Year householder moved into unit - Moved in 1980 to 1989 (%) - American Indian and Alaska Native
Year householder moved into unit - Moved in 1980 to 1989 (%) - Multirace
Year householder moved into unit - Moved in 1980 to 1989 (%) - Other Race
Year householder moved into unit - Moved in 1970 to 1979 (%)
Year householder moved into unit - Moved in 1970 to 1979 (%) - White
Year householder moved into unit - Moved in 1970 to 1979 (%) - Black or African American
Year householder moved into unit - Moved in 1970 to 1979 (%) - Asian
Year householder moved into unit - Moved in 1970 to 1979 (%) - Hispanic or Latino
Year householder moved into unit - Moved in 1970 to 1979 (%) - American Indian and Alaska Native
Year householder moved into unit - Moved in 1970 to 1979 (%) - Multirace
Year householder moved into unit - Moved in 1970 to 1979 (%) - Other Race
Year householder moved into unit - Moved in 1969 or earlier (%)
Year householder moved into unit - Moved in 1969 or earlier (%) - White
Year householder moved into unit - Moved in 1969 or earlier (%) - Black or African American
Year householder moved into unit - Moved in 1969 or earlier (%) - Asian
Year householder moved into unit - Moved in 1969 or earlier (%) - Hispanic or Latino
Year householder moved into unit - Moved in 1969 or earlier (%) - American Indian and Alaska Native
Year householder moved into unit - Moved in 1969 or earlier (%) - Multirace
Year householder moved into unit - Moved in 1969 or earlier (%) - Other Race
Housing units lacking complete plumbing facilities (%)
Housing units lacking complete kitchen facilities (%)
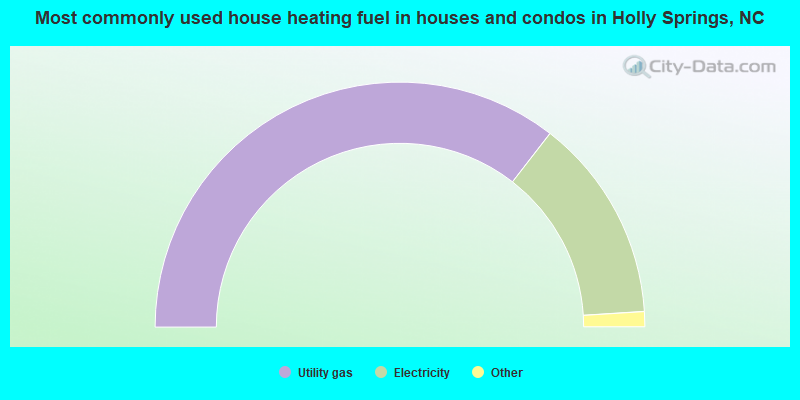
House heating fuel used in houses and condos - Utility gas (%)
House heating fuel used in houses and condos - Bottled, tank, or LP gas (%)
House heating fuel used in houses and condos - Electricity (%)
House heating fuel used in houses and condos - Fuel oil, kerosene, etc. (%)
House heating fuel used in houses and condos - Coal or coke (%)
House heating fuel used in houses and condos - Wood (%)
House heating fuel used in houses and condos - Solar energy (%)
House heating fuel used in houses and condos - Other fuel (%)
House heating fuel used in houses and condos - No fuel used (%)
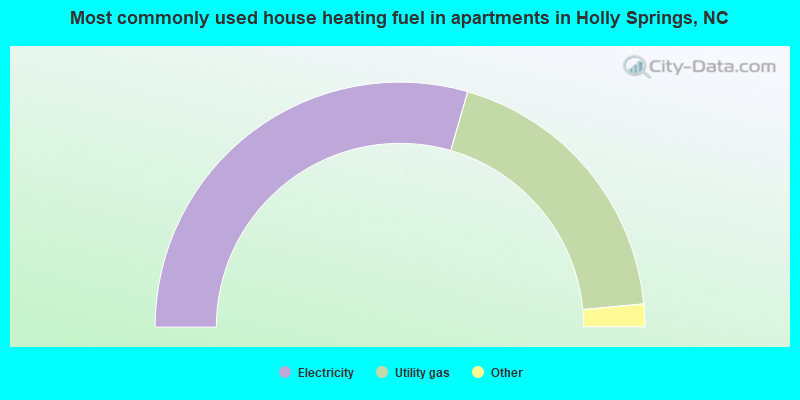
House heating fuel used in apartments - Utility gas (%)
House heating fuel used in apartments - Bottled, tank, or LP gas (%)
House heating fuel used in apartments - Electricity (%)
House heating fuel used in apartments - Fuel oil, kerosene, etc. (%)
House heating fuel used in apartments - Coal or coke (%)
House heating fuel used in apartments - Wood (%)
House heating fuel used in apartments - Solar energy (%)
House heating fuel used in apartments - Other fuel (%)
House heating fuel used in apartments - No fuel used (%)
Median year house/condo built: 2009Median year apartment built: 2013Household type by relationship:
Households: 43,616
Male householders: 7,163 (746 living alone ), Female householders: 6,947 (1,304 living alone )10,033 spouses (10,010 opposite-sex spouses ), 843 unmarried partners , (843 opposite-sex unmarried partners ), 16,966 children (16,064 natural , 423 adopted , 478 stepchildren ), 156 grandchildren , 200 brothers or sisters , 417 parents , 0 foster children , 321 other relatives , 522 non-relatives In group quarters: 42
Size of family households: 3,546 2-persons , 2,788 3-persons , 3,414 4-persons , 1,084 5-persons , 640 6-persons , 134 7-or-more-persons .
Size of nonfamily households: 2,070 1-person , 319 2-persons , 36 3-persons , 5 4-persons .
11,736 married couples with children. single-parent households (966 men , 1,202 women ).
85.4% of residents of Holly Springs speak English at home. of residents speak Spanish at home (70% speak English very well , 19% speak English well , 11% speak English not well ).of residents speak other Indo-European language at home (88% speak English very well , 9% speak English well , 3% speak English not well ).of residents speak Asian or Pacific Island language at home (85% speak English very well , 12% speak English well , 4% speak English not well ).of residents speak other language at home (68% speak English very well , 18% speak English well , 12% speak English not well , 3% don't speak English at all ).
Foreign born population: 4,555 (10.4%)of them are naturalized citizens )
Median number of rooms in houses and condos:
Median number of rooms in apartments
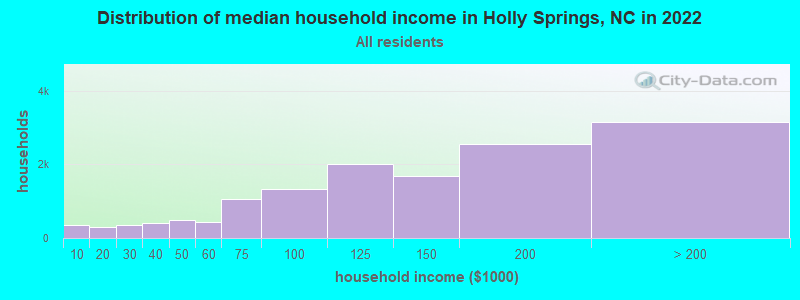
Holly Springs, NC household income distribution 343 Less than $10,000312 $10,000 to $19,999359 $20,000 to $29,999395 $30,000 to $39,999488 $40,000 to $49,999422 $50,000 to $59,9991,051 $60,000 to $74,9991,322 $75,000 to $99,9992,014 $100,000 to $124,9991,682 $125,000 to $149,9992,565 $150,000 to $199,9993,150 $200,000 or more
Home value of owner - occupied houses in 2022 in Holly Springs, NC 16 Less than $10,0005 $15,000 to $19,99912 $40,000 to $49,99911 $60,000 to $69,9997 $80,000 to $89,99927 $90,000 to $99,99991 $150,000 to $174,99983 $175,000 to $199,999223 $200,000 to $249,999754 $250,000 to $299,9991,989 $300,000 to $399,9993,363 $400,000 to $499,9994,803 $500,000 to $749,9991,318 $750,000 to $999,999201 $1,000,000 to $1,499,99946 $1,500,000 to $1,999,999Rent paid by renters in 2022 in Holly Springs, NC 35 $100 to $14930 $150 to $1999 $250 to $29933 $300 to $34943 $450 to $49915 $500 to $54914 $550 to $59921 $650 to $69911 $700 to $74929 $750 to $79939 $800 to $89948 $900 to $999167 $1,000 to $1,249539 $1,250 to $1,4991,035 $1,500 to $1,999459 $2,000 to $2,49986 $2,500 to $2,99926 $3,000 to $3,49967 No cash rent
Percentage of workers working in this county: 90.1%Number of people working at home: 6,697 (30.6% of all workers )
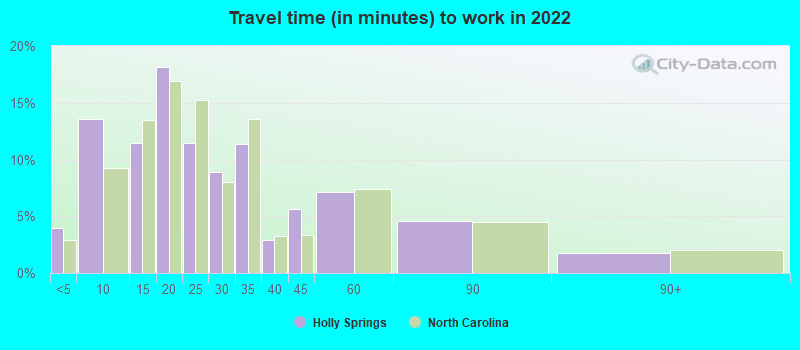
Travel time to work (commute)
Less than 5 minutes: 4185 to 9 minutes: 1,37410 to 14 minutes: 1,24015 to 19 minutes: 1,34720 to 24 minutes: 1,94125 to 29 minutes: 1,85130 to 34 minutes: 3,15535 to 39 minutes: 98540 to 44 minutes: 82245 to 59 minutes: 1,29260 to 89 minutes: 65790 or more minutes: 131
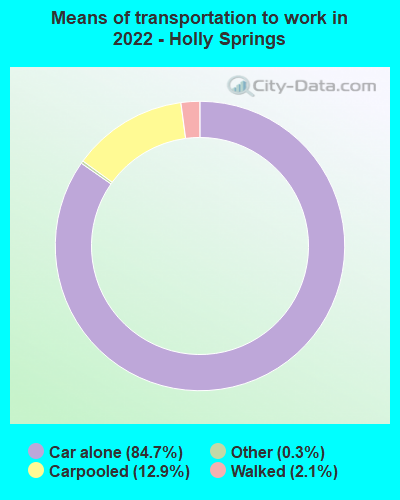
Means of transportation to work:
Drove a car alone: 7,944 (51.2%)Carpooled: 1,288 (8.3%)Taxi: 43 (0.3%)Walked: 271 (1.7%)Worked at home: 6,697 (43.2%)
Unemployment by race in 2022
Unemployment rate for White non-Hispanic residents 1.5% Males1.5% FemalesUnemployment rate for Black residents 3.7% Males5.8% FemalesUnemployment rate for Asian residents 2.7% Males1.0% FemalesUnemployment rate for other race residents 2.9% Males23.8% FemalesUnemployment rate for two or more race residents 3.4% Males8.0% FemalesUnemployment rate for Hispanic or Latino residents 2.3% Males14.2% Females
Year of entry for the foreign-born population in Holly Springs, North Carolina
1,452 2010 or later 864 2000 to 2009 1,084 1990 to 1999 118 1980 to 1989 51 1970 to 1979 55 Before 1970
First ancestries reported:
English: 3,067 (15.2%)
German: 1,871 (9.3%)
Irish: 1,611 (8.0%)
Italian: 1,544 (7.6%)
American: 1,073 (5.3%)
European: 832 (4.1%)
Polish: 433 (2.1%)
Scottish: 280 (1.4%)
Scotch-Irish: 211 (1.0%)
Russian: 198 (1.0%)
Swiss: 141 (0.7%)
Ethiopian: 120 (0.6%)
Greek: 107 (0.5%)
Moroccan: 91 (0.5%)
Dutch: 91 (0.5%)
Norwegian: 87 (0.4%)
Portuguese: 85 (0.4%)
French Canadian: 81 (0.4%)
British: 64 (0.3%)
Scandinavian: 64 (0.3%)
Slovene: 63 (0.3%)
Ukrainian: 61 (0.3%)
Romanian: 59 (0.3%)
African: 58 (0.3%)
French: 57 (0.3%)
Welsh: 57 (0.3%)
Cajun: 55 (0.3%)
Turkish: 53 (0.3%)
Slovak: 51 (0.3%)
Slavic: 49 (0.2%)
Jamaican: 48 (0.2%)
Canadian: 47 (0.2%)
Swedish: 45 (0.2%)
Austrian: 41 (0.2%)
South African: 38 (0.2%)
Serbian: 35 (0.2%)
Eastern European: 31 (0.2%)
Iranian: 25 (0.1%)
Egyptian: 24 (0.1%)
Palestinian: 21 (0.1%)
Hungarian: 21 (0.1%)
Macedonian: 20 (0.10%)
Armenian: 19 (0.09%)
Brazilian: 16 (0.08%)
Danish: 13 (0.06%)
Czechoslovakian: 13 (0.06%)
Czech: 9 (0.04%)
Lithuanian: 8 (0.04%)
Icelander: 8 (0.04%)
Most common places of birth for foreign-born residents (%): India Holly Springs:
27.9% (1,210)North Carolina:
9.3% (80,594)
Korea Holly Springs:
11.8% (511)North Carolina:
1.8% (15,988)
Mexico Holly Springs:
8.6% (374)North Carolina:
24.7% (214,776)
Russia Holly Springs:
4.0% (174)North Carolina:
0.9% (8,067)
United Kingdom, excluding England and Scotland Holly Springs:
3.9% (170)North Carolina:
1.1% (9,831)
Colombia Holly Springs:
3.5% (153)North Carolina:
2.1% (18,275)
Ukraine Holly Springs:
3.0% (131)North Carolina:
0.8% (6,645)
Canada Holly Springs:
2.3% (100)North Carolina:
2.1% (18,105)
Morocco Holly Springs:
2.3% (99)North Carolina:
0.3% (2,820)
Ethiopia Holly Springs:
1.8% (80)North Carolina:
0.5% (4,296)
Egypt Holly Springs:
1.7% (74)North Carolina:
0.6% (4,847)
Vietnam Holly Springs:
1.6% (71)North Carolina:
2.9% (24,965)
Bosnia and Herzegovina Holly Springs:
1.6% (69)North Carolina:
0.2% (1,868)
Jamaica Holly Springs:
1.6% (68)North Carolina:
1.3% (11,419)
Place of birth for U.S.-born residents:
This state: 15,115Other state: 23,502Northeast: 8,067Midwest: 5,197South: 7,772West: 2,432 90.2% of Holly Springs residents lived in the same house 1 years ago.
Out of people who lived in different houses, 35.9% lived in this county.
Out of people who lived in different counties, 46.8% lived in North Carolina.
Holly Springs:
90.2%State average:
87.3%
Education attainment for males 25 years and older:
No schooling: 193Nursery to 4th grade: 185th and 6th grade: 97th and 8th grade: 29th grade: 5310th grade: 11411th grade: 1312th grade, no diploma: 52High school graduate (or equivalency): 1,243Less than 1 year of college: 348Some college more than 1 year, no degree: 1,527Associate degree: 888Bachelor's degree: 5,830Master's degree: 2,177Professional school degree: 371Doctorate degree: 337
Education attainment for females 25 years and older:
No schooling: 127Nursery to 4th grade: 05th and 6th grade: 597th and 8th grade: 399th grade: 3710th grade: 5511th grade: 3012th grade, no diploma: 429High school graduate (or equivalency): 1,276Less than 1 year of college: 414Some college more than 1 year, no degree: 1,092Associate degree: 1,511Bachelor's degree: 5,170Master's degree: 3,007Professional school degree: 571Doctorate degree: 189
Housing units in structures:
One, detached: 12,107One, attached: 1,5433 or 4: 435 to 9: 23110 to 19: 55820 to 49: 45050 or more: 139Mobile homes: 103Median worth of mobile homes: $574,080
Housing units lacking complete plumbing facilities in 2022: 0.6%House/condo owner moved in on average 6 years ago
Renter moved in on average 3 years ago
Private vs. public school enrollment:
Students in private schools in grades 1 to 8 (elementary and middle school): 338 Here:
4.8%North Carolina:
13.8%
Students in private schools in grades 9 to 12 (high school): 198 Here:
6.3%North Carolina:
11.9%
Students in private undergraduate colleges: 92 Here:
6.4%North Carolina:
19.3%