Hillside, NJ (New Jersey) Houses and Residents
| Hillside: | $377,743 |
| New Jersey: | $428,900 |
Total population: 21,605 (All urban)
Houses: 7,388 (7,161 occupied: 5,140 owner occupied, 2,021 renter occupied)
| % of renters here: | 28% |
| State: | 35% |
Housing density: 2,648 houses/condos per square mile
Median price asked for vacant for-sale houses and condos in 2022 in this county: $468,662.
Median contract rent in 2022: $1,478 (lower quartile is $1,148, upper quartile is $1,845)
Median rent asked for vacant for-rent units in 2022: $1,624
Median gross rent in Hillside, NJ in 2022: $1,712
Housing units in Hillside with a mortgage: 3,029 (339 second mortgage, 239 home equity loan, 25 both second mortgage and home equity loan)
Houses without a mortgage: 955
Compare current foreclosures in Hillside, NJ:
| Photo | Address | Area | Beds / Baths | Price | Details |
|---|---|---|---|---|---|

|
#1
Mertz Ave
Hillside, NJ 07205
|
- sq. feet
|
2 baths 4 beds |
show details | |

|
#2
Stanley Ter
Hillside, NJ 07205
|
1,813 sq. feet
|
- baths - beds |
show details | |

|
#3
Salem Ave
Hillside, NJ 07205
|
- sq. feet
|
- baths - beds |
show details | |

|
#4
Paul St
Hillside, NJ 07205
|
1,188 sq. feet
|
- baths - beds |
show details | |

|
#5
Eastern Pkwy
Hillside, NJ 07205
|
- sq. feet
|
- baths - beds |
show details | |

|
#6
Fitzpatrick St
Hillside, NJ 07205
|
1,025 sq. feet
|
- baths - beds |
show details | |

|
#7
Sanford Ave
Hillside, NJ 07205
|
9,999 sq. feet
|
- baths - beds |
show details | |

|
#8
Bauer Ter
Hillside, NJ 07205
|
2,518 sq. feet
|
- baths - beds |
show details | |

|
#9
Schley St Apt 3
Hillside, NJ 07205
|
- sq. feet
|
- baths - beds |
show details | |

|
#10
Conant St
Hillside, NJ 07205
|
2,712 sq. feet
|
- baths - beds |
show details |
| Photo | Address | Area | Beds / Baths | Price | Details |
|---|---|---|---|---|---|

|
#11
Princeton Ave
Hillside, NJ 07205
|
2,298 sq. feet
|
- baths - beds |
show details | |

|
#12
Clark St
Hillside, NJ 07205
|
- sq. feet
|
- baths - beds |
show details | |

|
#13
Mading Ter
Hillside, NJ 07205
|
1,547 sq. feet
|
- baths - beds |
show details | |

|
#14
Long Ave
Hillside, NJ 07205
|
1,170 sq. feet
|
- baths - beds |
show details | |

|
#15
Hollywood Ave
Hillside, NJ 07205
|
1,311 sq. feet
|
- baths - beds |
show details | |

|
#16
Hiawatha Ave
Hillside, NJ 07205
|
1,297 sq. feet
|
- baths - beds |
show details | |

|
#17
Crystal Te 1
Hillside, NJ 07205
|
- sq. feet
|
- baths - beds |
show details | |

|
#18
Florence Ave
Hillside, NJ 07205
|
- sq. feet
|
- baths - beds |
show details | |

|
#19
Paul St
Hillside, NJ 07205
|
1,188 sq. feet
|
- baths - beds |
show details | |

|
#20
Blackburn Rd
Hillside, NJ 07205
|
1,066 sq. feet
|
- baths - beds |
show details |
| Photo | Address | Area | Beds / Baths | Price | Details |
|---|---|---|---|---|---|

|
#21
State St
Hillside, NJ 07205
|
1,680 sq. feet
|
- baths - beds |
show details | |

|
#22
Chester St
Hillside, NJ 07205
|
1,233 sq. feet
|
- baths - beds |
show details | |

|
#23
Route 22 West
Hillside, NJ 07205
|
- sq. feet
|
- baths - beds |
show details | |

|
#24
Baltimore Ave
Hillside, NJ 07205
|
2,772 sq. feet
|
- baths - beds |
show details | |

|
#25
Compton Pl
Hillside, NJ 07205
|
1,986 sq. feet
|
- baths - beds |
show details | |

|
#26
Route 22 E
Hillside, NJ 07205
|
- sq. feet
|
- baths - beds |
show details | |

|
#27
Yale Ave
Hillside, NJ 07205
|
1,456 sq. feet
|
- baths - beds |
show details | |

|
#28
Conklin Ave
Hillside, NJ 07205
|
9,999 sq. feet
|
- baths - beds |
show details | |

|
#29
Eastern Pkwy
Hillside, NJ 07205
|
1,122 sq. feet
|
- baths - beds |
show details | |

|
#30
Fitzpatrick St
Hillside, NJ 07205
|
1,490 sq. feet
|
- baths - beds |
show details |
| Photo | Address | Area | Beds / Baths | Price | Details |
|---|---|---|---|---|---|

|
#31
Chapman St
Hillside, NJ 07205
|
999 sq. feet
|
- baths - beds |
show details | |

|
#32
Pennsylvania Ave
Hillside, NJ 07205
|
2,314 sq. feet
|
- baths - beds |
show details | |

|
#33
Conklin Ave
Hillside, NJ 07205
|
9,999 sq. feet
|
- baths - beds |
show details | |

|
#34
Yale Ave
Hillside, NJ 07205
|
972 sq. feet
|
- baths - beds |
show details | |

|
#35
Munn Ave
Hillside, NJ 07205
|
2,029 sq. feet
|
- baths - beds |
show details | |

|
#36
Route 22 East
Hillside, NJ 07205
|
- sq. feet
|
- baths - beds |
show details | |

|
#37
Crystal Ter
Hillside, NJ 07205
|
1,981 sq. feet
|
- baths - beds |
show details | |

|
#38
Highland Ave
Hillside, NJ 07205
|
2,683 sq. feet
|
- baths - beds |
show details | |

|
#39
Columbia Pl
Hillside, NJ 07205
|
1,040 sq. feet
|
- baths - beds |
show details | |

|
#40
N Broad St
Hillside, NJ 07205
|
- sq. feet
|
- baths - beds |
show details |
| Photo | Address | Area | Beds / Baths | Price | Details |
|---|---|---|---|---|---|

|
#41
Ryan St
Hillside, NJ 07205
|
1,304 sq. feet
|
- baths - beds |
show details | |

|
#42
Schley St
Hillside, NJ 07205
|
9,999 sq. feet
|
- baths - beds |
show details | |

|
#43
Yale Ave
Hillside, NJ 07205
|
- sq. feet
|
- baths - beds |
show details | |

|
#44
Williamson Ave
Hillside, NJ 07205
|
3,555 sq. feet
|
- baths - beds |
show details | |

|
#45
Crann St
Hillside, NJ 07205
|
1,182 sq. feet
|
- baths - beds |
show details | |

|
#46
Stanley Ter
Hillside, NJ 07205
|
1,798 sq. feet
|
- baths - beds |
show details | |

|
#47
Buchanan St
Hillside, NJ 07205
|
1,307 sq. feet
|
- baths - beds |
show details | |

|
#48
Liberty Ave
Hillside, NJ 07205
|
- sq. feet
|
- baths - beds |
show details | |

|
#49
Bailey Ave
Hillside, NJ 07205
|
99,999 sq. feet
|
- baths - beds |
show details | |

|
Check over 1 million property listings on Foreclosure.com!
|
browse all offers | |||
Latest news about housing in Hillside, NJ collected exclusively by city-data.com from local newspapers, TV, and radio stations


Household type by relationship:
Households: 529,695- In family households: 464,085 (87,269 male householders, 47,405 female householders)
94,325 spouses, 171,221 children (162,243 natural, 3,299 adopted, 5,679 stepchildren), 11,365 grandchildren, 8,963 brothers or sisters, 8,956 parents, foster children, 13,013 other relatives, 16,322 non-relatives
- In nonfamily households: 65,610 (23,484 male householders (18,363 living alone)), 29,960 female householders (26,038 living alone)), 12,166 nonrelatives
- In group quarters: 6,804 (4,209 institutionalized population)
88,023 married couples with children.
26,686 single-parent households (5,364 men, 21,322 women).
61.2% of residents of Hillside speak English at home.
13.7% of residents speak Spanish at home (58% speak English very well, 20% speak English well, 18% speak English not well, 3% don't speak English at all).
20.5% of residents speak other Indo-European language at home (56% speak English very well, 25% speak English well, 15% speak English not well, 4% don't speak English at all).
2.2% of residents speak Asian or Pacific Island language at home (72% speak English very well, 26% speak English well, 2% speak English not well).
2.4% of residents speak other language at home (79% speak English very well, 14% speak English well, 3% speak English not well, 3% don't speak English at all).
Foreign born population: 8,606 (36.3%)
(58.0% of them are naturalized citizens)
| Here: | 7.0 |
| State: | 6.8 |
| Here: | 5.5 |
| State: | 3.9 |

- Bedrooms in owner-occupied houses and condos in Hillside, New Jersey
- 20no bedroom
- 1361 bedroom
- 1,2152 bedrooms
- 2,6113 bedrooms
- 8654 bedrooms
- 2935+ bedrooms

- Bedrooms in renter-occupied apartments in Hillside, New Jersey
- 58no bedroom
- 5671 bedroom
- 8382 bedrooms
- 5143 bedrooms
- 384 bedrooms
- 65+ bedrooms

- Cars and other vehicles available in Hillside in owner-occupied houses/condos
- 327no vehicle
- 1,5821 vehicle
- 2,0452 vehicles
- 8563 vehicles
- 2814 vehicles
- 495+ vehicles

- Cars and other vehicles available in Hillside in renter-occupied apartments
- 329no vehicle
- 9941 vehicle
- 5522 vehicles
- 1273 vehicles
- 74 vehicles
- 125+ vehicles

- Rooms in owner-occupied houses in Hillside, New Jersey
- 01 room
- 122 rooms
- 1463 rooms
- 3814 rooms
- 7945 rooms
- 1,6686 rooms
- 9317 rooms
- 7138 rooms
- 4959+ rooms

- Rooms in renter-occupied apartments in Hillside, New Jersey
- 581 room
- 712 rooms
- 3823 rooms
- 5594 rooms
- 5195 rooms
- 3396 rooms
- 337 rooms
- 558 rooms
- 59+ rooms


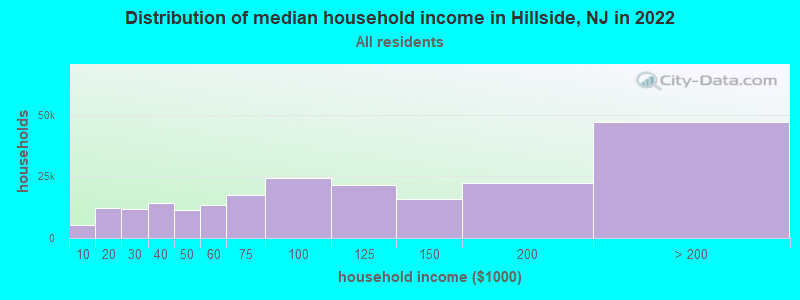
Hillside, NJ household income distribution

- 5,065Less than $10,000
- 12,294$10,000 to $19,999
- 11,921$20,000 to $29,999
- 14,259$30,000 to $39,999
- 11,284$40,000 to $49,999
- 13,223$50,000 to $59,999
- 17,623$60,000 to $74,999
- 24,120$75,000 to $99,999
- 21,327$100,000 to $124,999
- 15,935$125,000 to $149,999
- 22,429$150,000 to $199,999
- 46,995$200,000 or more
Percentage of workers working in this county: 41.5%
Number of people working at home: 1,713 (13.8% of all workers)
Travel time to work (commute)
- Less than 5 minutes: 204
- 5 to 9 minutes: 645
- 10 to 14 minutes: 1,343
- 15 to 19 minutes: 1,807
- 20 to 24 minutes: 1,339
- 25 to 29 minutes: 601
- 30 to 34 minutes: 1,725
- 35 to 39 minutes: 261
- 40 to 44 minutes: 435
- 45 to 59 minutes: 893
- 60 to 89 minutes: 663
- 90 or more minutes: 258
Means of transportation to work:
- Drove a car alone: 7,316 (70.9%)
- Carpooled: 1,361 (13.2%)
- Bus or trolley bus: 719 (7.0%)
- Streetcar or trolley car: 33 (0.3%)
- Subway or elevated: 18 (0.2%)
- Railroad: 313 (3.0%)
- Taxi: 19 (0.2%)
- Walked: 380 (3.7%)
- Other means: 15 (0.1%)
- Worked at home: 148 (1.4%)


- Year of entry for the foreign-born population in Hillside, New Jersey
- 8631995 to March 2000
- 5371990 to 1994
- 1,5001985 to 1989
- 9411980 to 1984
- 8181975 to 1979
- 5521970 to 1974
- 3301965 to 1969
- 418Before 1965
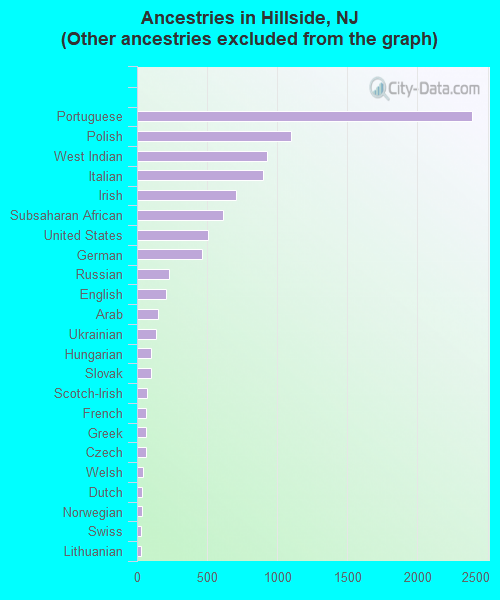
First ancestries reported:
- Other: 12,343 (58.0%)
- Portuguese: 2,391 (11.2%)
- Polish: 1,095 (5.1%)
- West Indian: 928 (4.4%)
- Italian: 896 (4.2%)
- Irish: 707 (3.3%)
- Subsaharan African: 615 (2.9%)
- United States: 503 (2.4%)
- German: 462 (2.2%)
- Russian: 229 (1.1%)
- English: 205 (1.0%)
- Arab: 151 (0.7%)
- Ukrainian: 136 (0.6%)
- Hungarian: 101 (0.5%)
- Slovak: 99 (0.5%)
- Scotch-Irish: 68 (0.3%)
- French: 64 (0.3%)
- Greek: 64 (0.3%)
- Czech: 62 (0.3%)
- Welsh: 46 (0.2%)
- Dutch: 35 (0.2%)
- Norwegian: 34 (0.2%)
- Swiss: 28 (0.1%)
- Lithuanian: 27 (0.1%)
- Scottish: 6 (0.03%)
- Swedish: 3 (0.01%)
Most common places of birth for foreign-born residents (%):
| Hillside: | 25.9% (1,546) |
| New Jersey: | 2.5% (37,183) |
| Hillside: | 8.3% (494) |
| New Jersey: | 2.2% (31,963) |
| Hillside: | 7.2% (429) |
| New Jersey: | 1.5% (22,097) |
| Hillside: | 5.3% (316) |
| New Jersey: | 4.7% (69,773) |
| Hillside: | 3.9% (232) |
| New Jersey: | 0.6% (8,389) |
| Hillside: | 3.7% (220) |
| New Jersey: | 4.7% (69,754) |
| Hillside: | 3.5% (209) |
| New Jersey: | 3.7% (55,241) |
| Hillside: | 3.2% (188) |
| New Jersey: | 1.9% (28,595) |
| Hillside: | 2.9% (173) |
| New Jersey: | 3.6% (53,482) |
| Hillside: | 2.7% (161) |
| New Jersey: | 3.8% (55,466) |
| Hillside: | 2.5% (149) |
| New Jersey: | 1.2% (17,746) |
| Hillside: | 2.4% (145) |
| New Jersey: | 2.5% (36,443) |
| Hillside: | 2.3% (140) |
| New Jersey: | 8.1% (119,497) |
| Hillside: | 2.3% (136) |
| New Jersey: | 3.1% (45,151) |
| Hillside: | 1.8% (110) |
| New Jersey: | 0.5% (7,079) |
| Hillside: | 1.7% (101) |
| New Jersey: | 1.3% (18,535) |
| Hillside: | 1.5% (91) |
| New Jersey: | 0.9% (13,289) |
Place of birth for U.S.-born residents:
- This state: 11,175
- Other state: 4,239
- Northeast: 1,817
- Midwest: 199
- South: 2,145
- West: 78
68% of Hillside residents lived in the same house 5 years ago.
Out of people who lived in different houses, 44% lived in this county.
Out of people who lived in different counties, 85% lived in New Jersey.
Education attainment for males 25 years and older:
- No schooling: 111
- Nursery to 4th grade: 130
- 5th and 6th grade: 200
- 7th and 8th grade: 188
- 9th grade: 164
- 10th grade: 216
- 11th grade: 194
- 12th grade, no diploma: 479
- High school graduate (or equivalency): 2,173
- Less than 1 year of college: 309
- Some college more than 1 year, no degree: 899
- Associate degree: 328
- Bachelor's degree: 770
- Master's degree: 222
- Professional school degree: 132
- Doctorate degree: 36

Education attainment for females 25 years and older:
- No schooling: 65
- Nursery to 4th grade: 214
- 5th and 6th grade: 199
- 7th and 8th grade: 328
- 9th grade: 119
- 10th grade: 141
- 11th grade: 166
- 12th grade, no diploma: 496
- High school graduate (or equivalency): 2,491
- Less than 1 year of college: 486
- Some college more than 1 year, no degree: 1,165
- Associate degree: 373
- Bachelor's degree: 1,079
- Master's degree: 327
- Professional school degree: 51
- Doctorate degree: 28


Housing units in structures:
- One, detached: 4,289
- One, attached: 273
- Two: 1,667
- 3 or 4: 766
- 5 to 9: 152
- 10 to 19: 68
- 20 to 49: 102
- 50 or more: 61
- Mobile homes: 10
Median worth of mobile homes: $141,470
Housing units lacking complete kitchen facilities: 0.5%

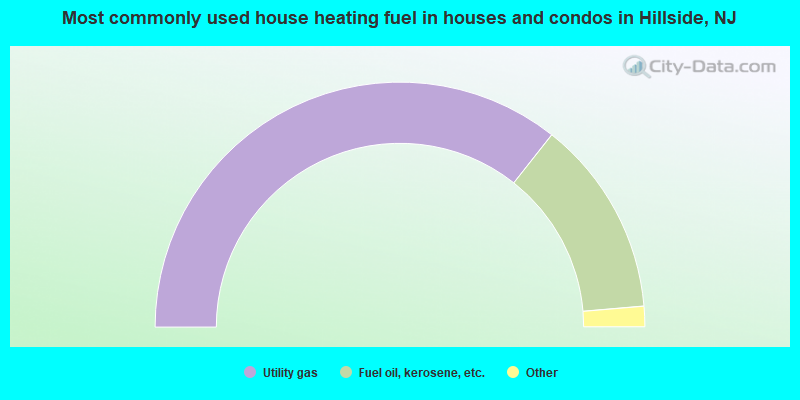
- 71.3%Utility gas
- 26.0%Fuel oil, kerosene, etc.
- 1.2%Electricity
- 1.1%Bottled, tank, or LP gas
- 0.3%Coal or coke
- 0.2%Other fuel
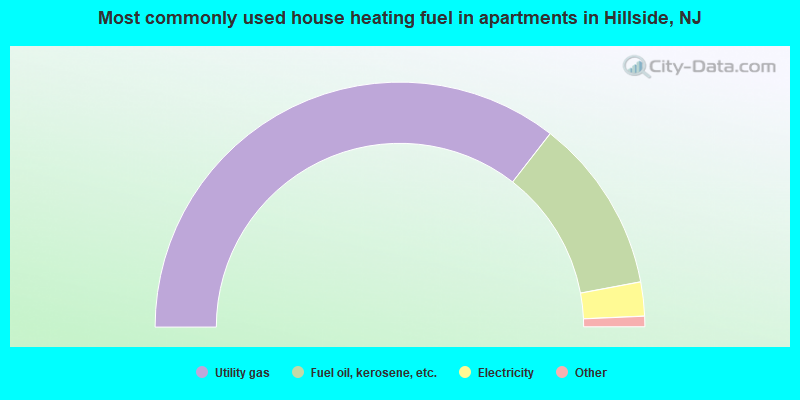
- 71.1%Utility gas
- 23.1%Fuel oil, kerosene, etc.
- 4.5%Electricity
- 0.9%Bottled, tank, or LP gas
- 0.5%Other fuel
Private vs. public school enrollment:
| Here: | 23.6% |
| New Jersey: | 13.2% |
| Here: | 22.0% |
| New Jersey: | 13.0% |
| Here: | 30.3% |
| New Jersey: | 30.1% |


