Hillsborough, NC (North Carolina) Houses and Residents
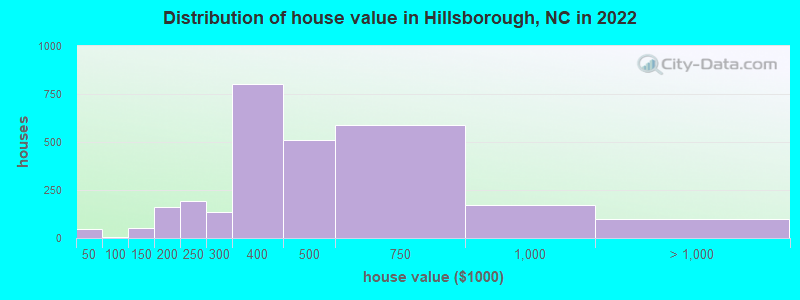
Estimated median house or condo value in 2022: $423,870 (it was $106,400 in 2000 )
Hillsborough:
$423,870North Carolina:
$280,600
Lower value quartile - upper value quartile: $339,147 - $569,544Mean price in 2022: Detached houses: $488,274 Here:
$488,274State:
$375,326
Townhouses or other attached units: $406,386 Here:
$406,386State:
$317,935
Mobile homes: $239,361 Here:
$239,361State:
$124,933
Total population: 6,388 (Urban population: 5,765, Rural population: 64 (all nonfarm) )
Houses: 4,433 (4,082 occupied: 2,665 owner occupied, 1,503 renter occupied )
% of renters here:
36%State:
33%
Housing density: 968 houses/condos per square mile
Median price asked for vacant for-sale houses and condos in 2022: $380,209.
Median contract rent in 2022: $1,201 (lower quartile is $658, upper quartile is $1,580)
Median rent asked for vacant for-rent units in 2022: $1,791
Median gross rent in Hillsborough, NC in 2022: $1,397
Housing units in Hillsborough with a mortgage: 1,922 (245 second mortgage, 0 home equity loan, 210 both second mortgage and home equity loan )Houses without a mortgage: 190
Median household income for houses/condos with a mortgage: $124,292
Median household income for apartments without a mortgage: $113,242
Median monthly housing costs: $1,457
Data:
Median house or condo value ($)
Median house or condo value ($ change since 2000)
Median house or condo value ($) - White
Median house or condo value ($) - Black or African American
Median house or condo value ($) - Asian
Median house or condo value ($) - Hispanic or Latino
Median house or condo value ($) - American Indian and Alaska Native
Median house or condo value ($) - Multirace
Median house or condo value ($) - Other Race
Median price asked for mobile homes ($)
Household density (households per square mile)
Mean house or condo value by units in structure - 1, detached ($)
Mean house or condo value by units in structure - 1, attached ($)
Mean house or condo value by units in structure - 2 ($)
Mean house or condo value by units in structure by units in structure - 3 or 4 ($)
Mean house or condo value by units in structure - 5 or more ($)
Mean house or condo value by units in structure - Boat, RV, van, etc. ($)
Mean house or condo value by units in structure - Mobile home ($)
Median contract rent ($)
Median contract rent - Lower quartile ($)
Median contract rent - Upper quartile ($)
Median gross rent ($)
Urban houses (%)
Rural houses (%)
Houses occupied (%)
Houses occupied (% change since 2000)
Houses owner occupied (%)
Houses owner occupied (% change since 2000)
Houses renter occupied (%)
Houses renter occupied (% change since 2000)
Vacant housing units - For rent (%)
Vacant housing units - For rent (% change since 2000)
Vacant housing units - For sale only (%)
Vacant housing units - For sale only (% change since 2000)
Vacant housing units - Rented or sold, not occupied (%)
Vacant housing units - Rented or sold, not occupied (% change since 2000)
Vacant housing units - For seasonal, recreational, or occasional use (%)
Vacant housing units - For seasonal, recreational, or occasional use (% change since 2000)
Vacant housing units - For migrant workers (%)
Vacant housing units - For migrant workers (% change since 2000)
Vacant housing units - Other vacant (%)
Vacant housing units - Other vacant (% change since 2000)
Median monthly housing costs ($)
Median household income for houses/condos with a mortgage ($)
Median household income for houses/condos without a mortgage ($)
Median household income ($)
Median household income ($) - White
Median household income ($) - Black or African American
Median household income ($) - Asian
Median household income ($) - Hispanic or Latino
Median household income ($) - American Indian and Alaska Native
Median household income ($) - Multirace
Median household income ($) - Other Race
Mortgage status - with mortgage (%)
Mortgage status - with second mortgage (%)
Mortgage status - with home equity loan (%)
Mortgage status - with both second mortgage and home equity loan (%)
Mortgage status - without a mortgage (%)
Median year house/condo built
Median year apartment built
Household type by relationship - Male householder living alone (%)
Household type by relationship - Male householder not living alone (%)
Household type by relationship - Female householder living alone (%)
Household type by relationship - Female householder not living alone (%)
Household type by relationship - Opposite-Sex spouse (%)
Household type by relationship - Same-Sex spouse (%)
Household type by relationship - Opposite-Sex unmarried partner (%)
Household type by relationship - Same-Sex unmarried partner (%)
Household type by relationship - In group quarters (%)
Size of family households - 2-person household (%)
Size of family households - 3-person household (%)
Size of family households - 4-person household (%)
Size of family households - 5-person household (%)
Size of family households - 6-person household (%)
Size of family households - 7-or-more-person household (%)
Size of nonfamily households - 1-person household (%)
Size of nonfamily households - 2-person household (%)
Size of nonfamily households - 3-person household (%)
Size of nonfamily households - 4-person household (%)
Size of nonfamily households - 5-person household (%)
Size of nonfamily households - 6-person household (%)
Size of nonfamily households - 7-or-moreperson household (%)
Year house built - Built 2010 or later (%)
Year house built - Built 2000 to 2009 (%)
Year house built - Built 1990 to 1999 (%)
Year house built - Built 1980 to 1989 (%)
Year house built - Built 1970 to 1979 (%)
Year house built - Built 1960 to 1969 (%)
Year house built - Built 1950 to 1959 (%)
Year house built - Built 1940 to 1949 (%)
Year house built - Built 1939 or earlier (%)
Median number of rooms in houses and condos
Median number of rooms in apartments
Median number of bedrooms in owner occupied houses
Mean number of bedrooms in owner occupied houses
Median number of bedrooms in renter occupied houses
Mean number of bedrooms in renter occupied houses
Median number of vehichles in owner occupied houses
Mean number of vehichles in owner occupied houses
Median number of vehichles in renter occupied houses
Mean number of vehichles in renter occupied houses
Rooms in owner-occupied houses - 1 room (%)
Rooms in owner-occupied houses - 2 rooms (%)
Rooms in owner-occupied houses - 3 rooms (%)
Rooms in owner-occupied houses - 4 rooms (%)
Rooms in owner-occupied houses - 5 rooms (%)
Rooms in owner-occupied houses - 6 rooms (%)
Rooms in owner-occupied houses - 7 rooms (%)
Rooms in owner-occupied houses - 8 rooms (%)
Rooms in owner-occupied houses - 9+ rooms (%)
Rooms in renter-occupied houses - 1 room (%)
Rooms in renter-occupied houses - 2 rooms (%)
Rooms in renter-occupied houses - 3 rooms (%)
Rooms in renter-occupied houses - 4 rooms (%)
Rooms in renter-occupied houses - 5 rooms (%)
Rooms in renter-occupied houses - 6 rooms (%)
Rooms in renter-occupied houses - 7 rooms (%)
Rooms in renter-occupied houses - 8 rooms (%)
Rooms in renter-occupied houses - 9+ rooms (%)
Bedrooms in owner-occupied houses - no bedrooms (%)
Bedrooms in owner-occupied houses - 1 bedroom (%)
Bedrooms in owner-occupied houses - 2 bedrooms (%)
Bedrooms in owner-occupied houses - 3 bedrooms (%)
Bedrooms in owner-occupied houses - 4 bedrooms (%)
Bedrooms in owner-occupied houses - 5+ bedrooms (%)
Bedrooms in renter-occupied houses - no bedrooms (%)
Bedrooms in renter-occupied houses - 1 bedroom (%)
Bedrooms in renter-occupied houses - 2 bedrooms (%)
Bedrooms in renter-occupied houses - 3 bedrooms (%)
Bedrooms in renter-occupied houses - 4 bedrooms (%)
Bedrooms in renter-occupied houses - 5+ bedrooms (%)
Vehicles available in owner-occupied houses - no vehicle available (%)
Vehicles available in owner-occupied houses - 1 vehicle available(%)
Vehicles available in owner-occupied houses - 2 Vehicles available (%)
Vehicles available in owner-occupied houses - 3 Vehicles available (%)
Vehicles available in owner-occupied houses - 4 Vehicles available (%)
Vehicles available in owner-occupied houses - 5+ Vehicles available (%)
Vehicles available in renter-occupied houses - no vehicle available (%)
Vehicles available in renter-occupied houses - 1 vehicle available (%)
Vehicles available in renter-occupied houses - 2 Vehicles available (%)
Vehicles available in renter-occupied houses - 3 Vehicles available (%)
Vehicles available in renter-occupied houses - 4 Vehicles available (%)
Vehicles available in renter-occupied houses - 5+ Vehicles available (%)
Housing units in structures - 1, detached (%)
Housing units in structures - 1, attached (%)
Housing units in structures - 2 (%)
Housing units in structures - 3 or 4 (%)
Housing units in structures - 5 to 9 (%)
Housing units in structures - 10 to 19 (%)
Housing units in structures - 20 to 49 (%)
Housing units in structures - 50 or more (%)
Housing units in structures - Mobile home (%)
Housing units in structures - Boat, RV, van, etc. (%)
Housing units in structures - Owners - 1, detached (%)
Housing units in structures - Owners - 1, attached (%)
Housing units in structures - Owners - 2 (%)
Housing units in structures - Owners - 3 or 4 (%)
Housing units in structures - Owners - 5 to 9 (%)
Housing units in structures - Owners - 10 to 19 (%)
Housing units in structures - Owners - 20 to 49 (%)
Housing units in structures - Owners - 50 or more (%)
Housing units in structures - Owners - Mobile home (%)
Housing units in structures - Owners - Boat, RV, van, etc. (%)
Housing units in structures - Renters - 1, detached (%)
Housing units in structures - Renters - 1, attached (%)
Housing units in structures - Renters - 2 (%)
Housing units in structures - Renters - 3 or 4 (%)
Housing units in structures - Renters - 5 to 9 (%)
Housing units in structures - Renters - 10 to 19 (%)
Housing units in structures - Renters - 20 to 49 (%)
Housing units in structures - Renters - 50 or more (%)
Housing units in structures - Renters - Mobile home (%)
Housing units in structures - Renters - Boat, RV, van, etc. (%)
House/condo owner moved in on average (years ago)
Renter moved in on average (years ago)
Year householder moved into unit - Moved in 1999 to March 2000 (%)
Year householder moved into unit - Moved in 1999 to March 2000 (%) - White
Year householder moved into unit - Moved in 1999 to March 2000 (%) - Black or African American
Year householder moved into unit - Moved in 1999 to March 2000 (%) - Asian
Year householder moved into unit - Moved in 1999 to March 2000 (%) - Hispanic or Latino
Year householder moved into unit - Moved in 1999 to March 2000 (%) - American Indian and Alaska Native
Year householder moved into unit - Moved in 1999 to March 2000 (%) - Multirace
Year householder moved into unit - Moved in 1999 to March 2000 (%) - Other Race
Year householder moved into unit - Moved in 1995 to 1998 (%)
Year householder moved into unit - Moved in 1995 to 1998 (%) - White
Year householder moved into unit - Moved in 1995 to 1998 (%) - Black or African American
Year householder moved into unit - Moved in 1995 to 1998 (%) - Asian
Year householder moved into unit - Moved in 1995 to 1998 (%) - Hispanic or Latino
Year householder moved into unit - Moved in 1995 to 1998 (%) - American Indian and Alaska Native
Year householder moved into unit - Moved in 1995 to 1998 (%) - Multirace
Year householder moved into unit - Moved in 1995 to 1998 (%) - Other Race
Year householder moved into unit - Moved in 1990 to 1994 (%)
Year householder moved into unit - Moved in 1990 to 1994 (%) - White
Year householder moved into unit - Moved in 1990 to 1994 (%) - Black or African American
Year householder moved into unit - Moved in 1990 to 1994 (%) - Asian
Year householder moved into unit - Moved in 1990 to 1994 (%) - Hispanic or Latino
Year householder moved into unit - Moved in 1990 to 1994 (%) - American Indian and Alaska Native
Year householder moved into unit - Moved in 1990 to 1994 (%) - Multirace
Year householder moved into unit - Moved in 1990 to 1994 (%) - Other Race
Year householder moved into unit - Moved in 1980 to 1989 (%)
Year householder moved into unit - Moved in 1980 to 1989 (%) - White
Year householder moved into unit - Moved in 1980 to 1989 (%) - Black or African American
Year householder moved into unit - Moved in 1980 to 1989 (%) - Asian
Year householder moved into unit - Moved in 1980 to 1989 (%) - Hispanic or Latino
Year householder moved into unit - Moved in 1980 to 1989 (%) - American Indian and Alaska Native
Year householder moved into unit - Moved in 1980 to 1989 (%) - Multirace
Year householder moved into unit - Moved in 1980 to 1989 (%) - Other Race
Year householder moved into unit - Moved in 1970 to 1979 (%)
Year householder moved into unit - Moved in 1970 to 1979 (%) - White
Year householder moved into unit - Moved in 1970 to 1979 (%) - Black or African American
Year householder moved into unit - Moved in 1970 to 1979 (%) - Asian
Year householder moved into unit - Moved in 1970 to 1979 (%) - Hispanic or Latino
Year householder moved into unit - Moved in 1970 to 1979 (%) - American Indian and Alaska Native
Year householder moved into unit - Moved in 1970 to 1979 (%) - Multirace
Year householder moved into unit - Moved in 1970 to 1979 (%) - Other Race
Year householder moved into unit - Moved in 1969 or earlier (%)
Year householder moved into unit - Moved in 1969 or earlier (%) - White
Year householder moved into unit - Moved in 1969 or earlier (%) - Black or African American
Year householder moved into unit - Moved in 1969 or earlier (%) - Asian
Year householder moved into unit - Moved in 1969 or earlier (%) - Hispanic or Latino
Year householder moved into unit - Moved in 1969 or earlier (%) - American Indian and Alaska Native
Year householder moved into unit - Moved in 1969 or earlier (%) - Multirace
Year householder moved into unit - Moved in 1969 or earlier (%) - Other Race
Housing units lacking complete plumbing facilities (%)
Housing units lacking complete kitchen facilities (%)
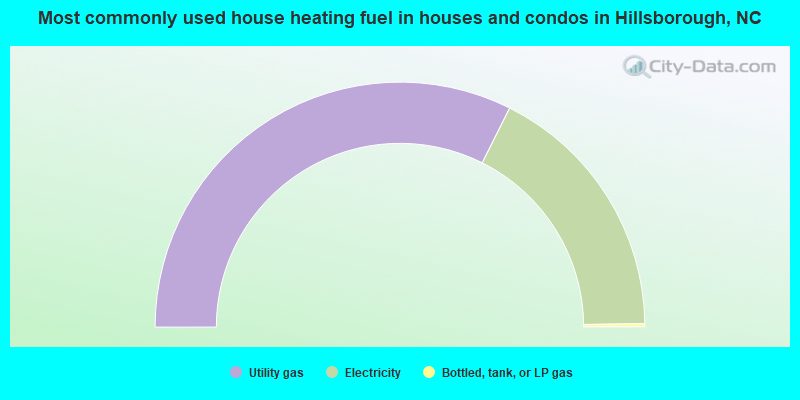
House heating fuel used in houses and condos - Utility gas (%)
House heating fuel used in houses and condos - Bottled, tank, or LP gas (%)
House heating fuel used in houses and condos - Electricity (%)
House heating fuel used in houses and condos - Fuel oil, kerosene, etc. (%)
House heating fuel used in houses and condos - Coal or coke (%)
House heating fuel used in houses and condos - Wood (%)
House heating fuel used in houses and condos - Solar energy (%)
House heating fuel used in houses and condos - Other fuel (%)
House heating fuel used in houses and condos - No fuel used (%)
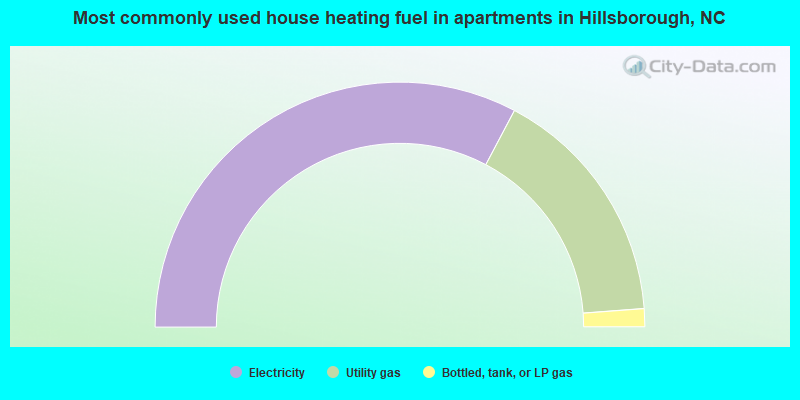
House heating fuel used in apartments - Utility gas (%)
House heating fuel used in apartments - Bottled, tank, or LP gas (%)
House heating fuel used in apartments - Electricity (%)
House heating fuel used in apartments - Fuel oil, kerosene, etc. (%)
House heating fuel used in apartments - Coal or coke (%)
House heating fuel used in apartments - Wood (%)
House heating fuel used in apartments - Solar energy (%)
House heating fuel used in apartments - Other fuel (%)
House heating fuel used in apartments - No fuel used (%)
Latest news about housing in Hillsborough, NC collected exclusively by city-data.com from local newspapers, TV, and radio stations
Median year house/condo built: 1998Median year apartment built: 1983Household type by relationship:
Households: 9,831
Male householders: 1,536 (328 living alone ), Female householders: 2,576 (992 living alone )2,096 spouses (2,006 opposite-sex spouses ), 159 unmarried partners , (131 opposite-sex unmarried partners ), 2,567 children (2,414 natural , 39 adopted , 114 stepchildren ), 22 grandchildren , 0 brothers or sisters , 110 parents , 0 foster children , 43 other relatives , 292 non-relatives In group quarters: 425
Size of family households: 1,222 2-persons , 533 3-persons , 555 4-persons , 94 5-persons , 52 6-persons , 8 7-or-more-persons .
Size of nonfamily households: 1,418 1-person , 165 2-persons , 22 3-persons , 52 4-persons .
1,292 married couples with children. single-parent households (154 men , 424 women ).
90.6% of residents of Hillsborough speak English at home. of residents speak Spanish at home (72% speak English very well , 10% speak English well , 10% speak English not well , 8% don't speak English at all ).of residents speak other Indo-European language at home (53% speak English very well , 21% speak English well , 26% speak English not well ).of residents speak Asian or Pacific Island language at home (100% speak English very well ).of residents speak other language at home (83% speak English very well , 17% speak English well ).
Foreign born population: 498 (5.1%)of them are naturalized citizens )
Median number of rooms in houses and condos:
Median number of rooms in apartments
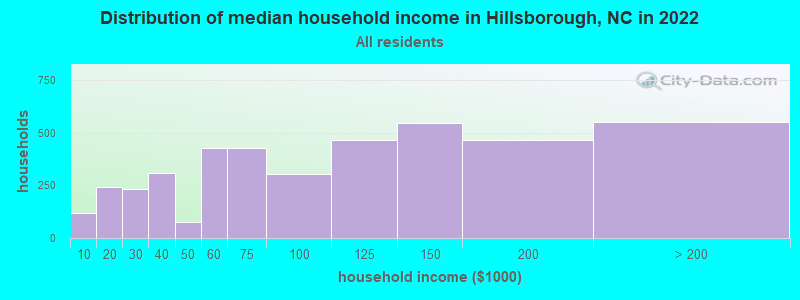
Hillsborough, NC household income distribution 117 Less than $10,000241 $10,000 to $19,999234 $20,000 to $29,999309 $30,000 to $39,99977 $40,000 to $49,999428 $50,000 to $59,999427 $60,000 to $74,999303 $75,000 to $99,999467 $100,000 to $124,999545 $125,000 to $149,999466 $150,000 to $199,999552 $200,000 or more
Home value of owner - occupied houses in 2022 in Hillsborough, NC 46 Less than $10,0006 $90,000 to $99,99954 $125,000 to $149,99941 $150,000 to $174,999117 $175,000 to $199,999190 $200,000 to $249,999135 $250,000 to $299,999804 $300,000 to $399,999512 $400,000 to $499,999585 $500,000 to $749,999170 $750,000 to $999,99960 $1,000,000 to $1,499,99936 $1,500,000 to $1,999,999Rent paid by renters in 2022 in Hillsborough, NC 97 Less than $10016 $100 to $14932 $350 to $39926 $400 to $44957 $500 to $549136 $550 to $59987 $600 to $64915 $700 to $74942 $800 to $89931 $900 to $999171 $1,000 to $1,249380 $1,250 to $1,499244 $1,500 to $1,99988 $2,500 to $2,99975 No cash rent
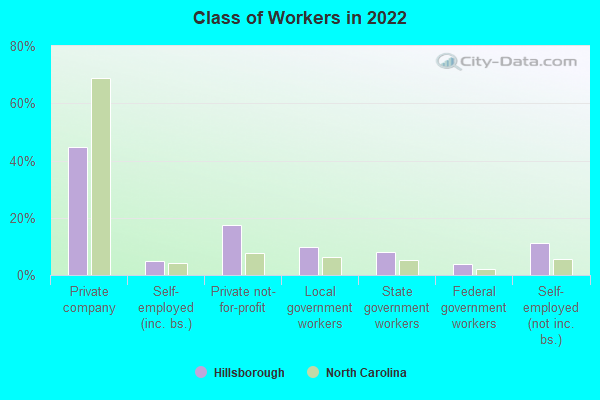
Percentage of workers working in this county: 69.7%Number of people working at home: 1,379 (28.6% of all workers )
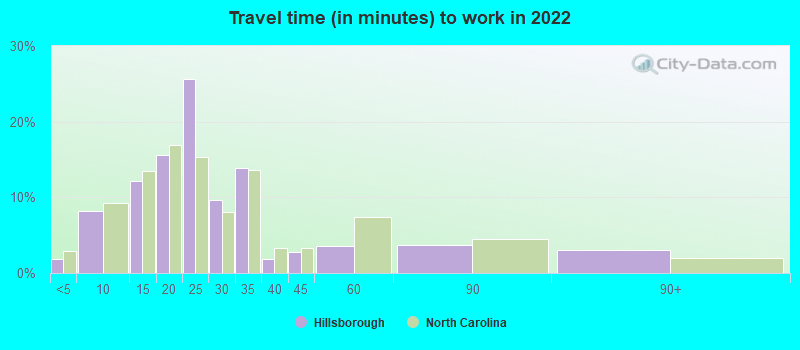
Travel time to work (commute)
Less than 5 minutes: 1015 to 9 minutes: 34310 to 14 minutes: 44315 to 19 minutes: 65120 to 24 minutes: 67625 to 29 minutes: 32030 to 34 minutes: 22135 to 39 minutes: 15840 to 44 minutes: 17245 to 59 minutes: 26060 to 89 minutes: 4190 or more minutes: 58
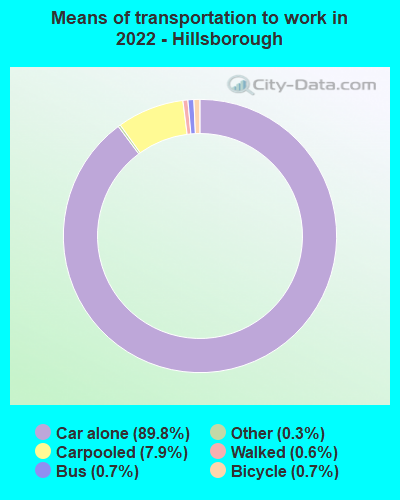
Means of transportation to work:
Drove a car alone: 6,186 (75.9%)Carpooled: 515 (6.3%)Bus : 26 (0.3%)Taxi: 13 (0.2%)Bicycle: 56 (0.7%)Walked: 40 (0.5%)Worked at home: 1,379 (16.9%)
Unemployment by race in 2022
Unemployment rate for White non-Hispanic residents 7.4% Males1.7% FemalesUnemployment rate for Black residents 46.7% Males4.5% Females
Year of entry for the foreign-born population in Hillsborough, North Carolina
333 2010 or later 150 2000 to 2009 105 1990 to 1999 51 1980 to 1989 19 1970 to 1979 16 Before 1970
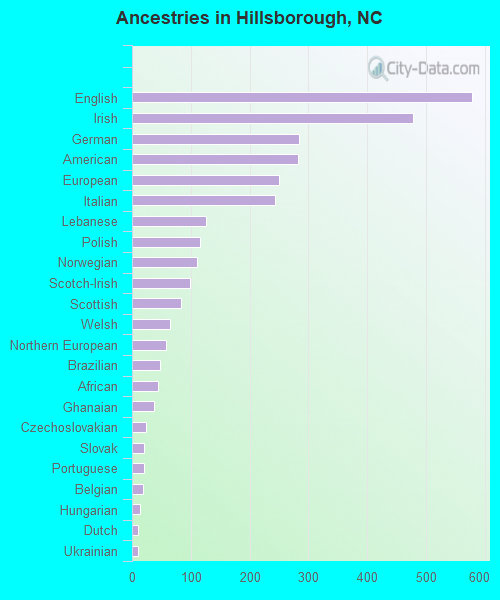
First ancestries reported:
English: 578 (12.6%)
Irish: 478 (10.5%)
German: 284 (6.2%)
American: 282 (6.2%)
European: 250 (5.5%)
Italian: 243 (5.3%)
Lebanese: 125 (2.7%)
Polish: 115 (2.5%)
Norwegian: 110 (2.4%)
Scotch-Irish: 98 (2.1%)
Scottish: 84 (1.8%)
Welsh: 65 (1.4%)
Northern European: 57 (1.2%)
Brazilian: 48 (1.0%)
African: 45 (1.0%)
Ghanaian: 37 (0.8%)
Czechoslovakian: 23 (0.5%)
Slovak: 21 (0.5%)
Portuguese: 20 (0.4%)
Belgian: 19 (0.4%)
Hungarian: 13 (0.3%)
Dutch: 11 (0.2%)
Ukrainian: 11 (0.2%) Most common places of birth for foreign-born residents (%): Mexico Hillsborough:
21.9% (136)North Carolina:
24.7% (214,776)
Brazil Hillsborough:
14.7% (91)North Carolina:
1.0% (8,426)
Lebanon Hillsborough:
12.6% (78)North Carolina:
0.3% (2,422)
Thailand Hillsborough:
4.8% (30)North Carolina:
0.7% (6,161)
Netherlands Hillsborough:
4.2% (26)North Carolina:
0.2% (1,461)
Spain Hillsborough:
4.0% (25)North Carolina:
0.3% (2,183)
South Africa Hillsborough:
4.0% (25)North Carolina:
0.5% (4,673)
Portugal Hillsborough:
3.9% (24)North Carolina:
0.1% (903)
Philippines Hillsborough:
3.7% (23)North Carolina:
2.4% (20,695)
Korea Hillsborough:
3.5% (22)North Carolina:
1.8% (15,988)
Hungary Hillsborough:
3.1% (19)North Carolina:
0.2% (1,491)
Kenya Hillsborough:
2.6% (16)North Carolina:
0.5% (4,309)
Belgium Hillsborough:
2.3% (14)North Carolina:
0.1% (904)
Colombia Hillsborough:
2.3% (14)North Carolina:
2.1% (18,275)
Dominican Republic Hillsborough:
2.1% (13)North Carolina:
1.7% (15,135)
Guatemala Hillsborough:
1.9% (12)North Carolina:
2.6% (22,964)
Place of birth for U.S.-born residents:
This state: 4,630Other state: 4,586Northeast: 1,714Midwest: 1,257South: 1,270West: 408 80.7% of Hillsborough residents lived in the same house 1 years ago.
Out of people who lived in different houses, 28.9% lived in this county.
Out of people who lived in different counties, 39.0% lived in North Carolina.
Hillsborough:
80.7%State average:
87.3%
Education attainment for males 25 years and older:
No schooling: 87Nursery to 4th grade: 255th and 6th grade: 07th and 8th grade: 159th grade: 1410th grade: 16511th grade: 5112th grade, no diploma: 1High school graduate (or equivalency): 750Less than 1 year of college: 71Some college more than 1 year, no degree: 221Associate degree: 161Bachelor's degree: 1,081Master's degree: 466Professional school degree: 158Doctorate degree: 190
Education attainment for females 25 years and older:
No schooling: 15Nursery to 4th grade: 05th and 6th grade: 07th and 8th grade: 09th grade: 1910th grade: 6711th grade: 412th grade, no diploma: 38High school graduate (or equivalency): 481Less than 1 year of college: 120Some college more than 1 year, no degree: 351Associate degree: 351Bachelor's degree: 1,448Master's degree: 592Professional school degree: 205Doctorate degree: 141
Housing units in structures:
One, detached: 2,825One, attached: 5553 or 4: 665 to 9: 35610 to 19: 12220 to 49: 19250 or more: 213Mobile homes: 100Median worth of mobile homes: $208,120
Housing units lacking complete plumbing facilities in 2022: 4.8%Housing units lacking complete kitchen facilities in 2022: 4.8%House/condo owner moved in on average 9 years ago
Renter moved in on average 1 years ago
Private vs. public school enrollment:
Students in private schools in grades 1 to 8 (elementary and middle school): 161 Here:
17.3%North Carolina:
13.8%
Students in private schools in grades 9 to 12 (high school): 32 Here:
8.0%North Carolina:
11.9%
Students in private undergraduate colleges: 31 Here:
9.4%North Carolina:
19.3%