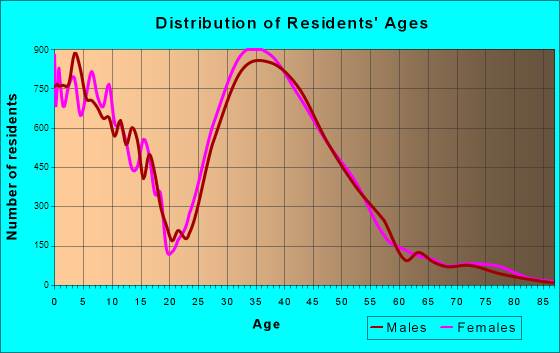
Highlands Ranch, CO (Colorado) Houses and Residents
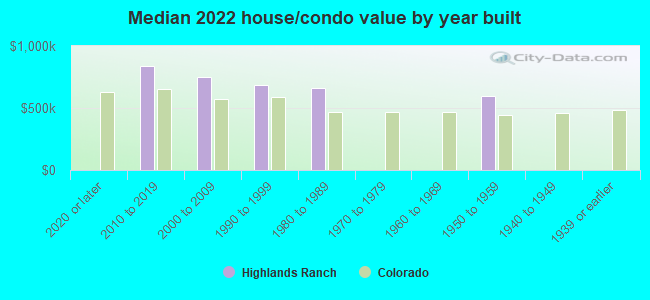
| Highlands Ranch: | $699,300 |
| Colorado: | $531,100 |
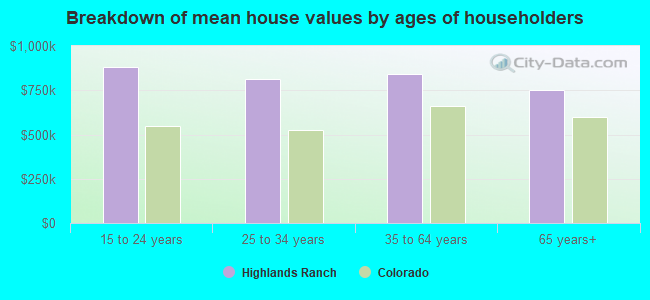
Mean price in 2022:
Detached houses: $783,396
Here: $783,396 State: $676,667 Townhouses or other attached units: $704,089
Here: $704,089 State: $526,340 In 3-to-4-unit structures: $515,163
Here: $515,163 State: $385,502 In 5-or-more-unit structures: $487,525
Here: $487,525 State: $417,586
Total population: 96,713 (Urban population: 70,484, Rural population: 380 (all nonfarm))
Houses: 39,990 (38,839 occupied: 30,885 owner occupied, 7,954 renter occupied)
| % of renters here: | 20% |
| State: | 34% |
Housing density: 1,700 houses/condos per square mile
Median price asked for vacant for-sale houses and condos in 2022: $1,075,619.
Median contract rent in 2022: over $2,000 (lower quartile is $1,835, upper quartile is over $2,000)
Median rent asked for vacant for-rent units in 2022: $4,663
Median gross rent in Highlands Ranch, CO in 2022: over $2,000
Housing units in Highlands Ranch with a mortgage: 23,420 (3,363 second mortgage, 148 home equity loan, 2,990 both second mortgage and home equity loan)
Houses without a mortgage: 369
Median household income for houses/condos with a mortgage: $174,564
Median household income for apartments without a mortgage: $114,884
Median monthly housing costs: $2,276
Compare current foreclosures near Highlands Ranch, CO:
| Photo | Address | Area | Beds / Baths | Price | Details |
|---|---|---|---|---|---|

|
#1
Curtis St
Denver, CO 80205
|
822 sq. feet
|
3 baths 4 beds |
$499,900
|
show details |

|
#2
S Columbine Dr
Morrison, CO 80465
|
2,280 sq. feet
|
2 baths 3 beds |
$529,900
|
show details |

|
#3
E Exposition Ave Apartme
Aurora, CO 80012
|
444 sq. feet
|
1 baths 1 beds |
show details | |

|
#4
S Memphis Way Apt K
Aurora, CO 80017
|
706 sq. feet
|
1 baths 1 beds |
show details | |

|
#5
S Fillmore Cir
Littleton, CO 80122
|
1,036 sq. feet
|
3 baths 3 beds |
show details | |

|
#6
E Eastman Pl
Aurora, CO 80013
|
1,526 sq. feet
|
2 baths 3 beds |
show details | |

|
#7
E Tennessee Pl
Aurora, CO 80017
|
1,360 sq. feet
|
3 baths 3 beds |
show details | |

|
#8
S Flanders Way
Aurora, CO 80017
|
859 sq. feet
|
2 baths 2 beds |
show details | |

|
#9
Clayton St
Denver, CO 80216
|
1,107 sq. feet
|
2 baths 3 beds |
show details | |

|
#10
Ladera Dr
Littleton, CO 80124
|
- sq. feet
|
4 baths 4 beds |
show details |
| Photo | Address | Area | Beds / Baths | Price | Details |
|---|---|---|---|---|---|

|
#11
S Elk Way
Aurora, CO 80016
|
1,984 sq. feet
|
2 baths 4 beds |
show details | |

|
#12
Banyon Cir
Parker, CO 80134
|
- sq. feet
|
2 baths 4 beds |
show details | |

|
#13
W Woodard Cir
Denver, CO 80227
|
3,221 sq. feet
|
3 baths 3 beds |
show details | |

|
#14
S Chase Dr
Denver, CO 80226
|
1,581 sq. feet
|
2 baths 6 beds |
show details | |

|
#15
Wheatgrass Cir
Parker, CO 80134
|
1,276 sq. feet
|
2 baths 3 beds |
show details | |

|
#16
W Vail Pass
Littleton, CO 80127
|
1,562 sq. feet
|
1 baths 3 beds |
show details | |

|
#17
E Calhoun Ave
Aurora, CO 80016
|
3,380 sq. feet
|
6 baths 6 beds |
show details | |

|
#18
E Indore Dr
Aurora, CO 80016
|
3,013 sq. feet
|
3 baths 4 beds |
show details | |

|
#19
Bridle Path Ln
Parker, CO 80134
|
3,665 sq. feet
|
4 baths 5 beds |
show details | |

|
#20
Longpark Dr
Parker, CO 80138
|
1,620 sq. feet
|
3 baths 3 beds |
show details |
| Photo | Address | Area | Beds / Baths | Price | Details |
|---|---|---|---|---|---|

|
#21
S Joplin Way
Aurora, CO 80013
|
1,132 sq. feet
|
2 baths 3 beds |
show details | |

|
#22
Routt St
Denver, CO 80215
|
1,134 sq. feet
|
2 baths 4 beds |
show details | |

|
#23
S Newark Ct
Aurora, CO 80012
|
1,296 sq. feet
|
2 baths 2 beds |
show details | |

|
#24
E Columbia Ave
Aurora, CO 80013
|
1,078 sq. feet
|
2 baths 3 beds |
show details | |

|
#25
E Kentucky Ave Apt 101
Aurora, CO 80017
|
1,177 sq. feet
|
1 baths 3 beds |
show details | |

|
#26
S Idalia St
Aurora, CO 80013
|
1,716 sq. feet
|
4 baths 4 beds |
show details | |

|
#27
Florence St
Aurora, CO 80010
|
839 sq. feet
|
1 baths 2 beds |
show details | |

|
#28
E Asbury Pl
Aurora, CO 80013
|
1,880 sq. feet
|
2 baths 3 beds |
show details | |

|
#29
E Harvard Ave
Aurora, CO 80013
|
1,279 sq. feet
|
2 baths 3 beds |
show details | |

|
#30
16th St Apt 504
Denver, CO 80202
|
708 sq. feet
|
1 baths 1 beds |
show details |
| Photo | Address | Area | Beds / Baths | Price | Details |
|---|---|---|---|---|---|

|
#31
S Elmira St Apt 10
Denver, CO 80231
|
3,043 sq. feet
|
3 baths 3 beds |
show details | |

|
#32
Lodgepole Trl
Littleton, CO 80124
|
3,064 sq. feet
|
3 baths 4 beds |
show details | |

|
#33
W Hampden Ave
Denver, CO 80227
|
922 sq. feet
|
1 baths 2 beds |
show details | |

|
#34
S Windermere St
Littleton, CO 80120
|
1,992 sq. feet
|
4 baths 1 beds |
show details | |

|
#35
S Van Gordon St
Denver, CO 80228
|
1,630 sq. feet
|
2 baths 3 beds |
show details | |

|
#36
S Danube Way Unit 101
Aurora, CO 80017
|
1,140 sq. feet
|
3 baths 2 beds |
show details | |

|
#37
E Dakota Ave
Aurora, CO 80012
|
1,431 sq. feet
|
1 baths 3 beds |
show details | |

|
#38
W Adriatic Pl
Englewood, CO 80110
|
1,104 sq. feet
|
1 baths 3 beds |
show details | |

|
#39
E Alaska Ave
Aurora, CO 80012
|
1,118 sq. feet
|
1 baths 2 beds |
show details | |

|
#40
Iola St
Aurora, CO 80010
|
2,128 sq. feet
|
2 baths 5 beds |
show details |
| Photo | Address | Area | Beds / Baths | Price | Details |
|---|---|---|---|---|---|

|
#41
S Crystal Way
Aurora, CO 80012
|
1,258 sq. feet
|
1 baths 2 beds |
show details | |

|
#42
Spanish Oaks Way
Castle Rock, CO 80108
|
- sq. feet
|
3 baths 4 beds |
show details | |

|
#43
Geneva Creek Lane
Littleton, CO 80125
|
- sq. feet
|
3 baths 3 beds |
show details | |

|
#44
E 18th Pl
Aurora, CO 80011
|
986 sq. feet
|
1 baths 4 beds |
show details | |

|
#45
E Smoky Hill Rd
Aurora, CO 80015
|
- sq. feet
|
2 baths 2 beds |
show details | |

|
#46
E Amherst Ave
Aurora, CO 80014
|
1,342 sq. feet
|
2 baths 2 beds |
show details | |

|
#47
S Dillon Way
Aurora, CO 80012
|
1,186 sq. feet
|
1 baths 2 beds |
show details | |

|
#48
W Dartmouth Ave
Denver, CO 80227
|
1,351 sq. feet
|
3 baths 3 beds |
show details | |

|
#49
E Mississippi Ave
Denver, CO 80247
|
1,194 sq. feet
|
2 baths 2 beds |
show details | |

|
Check over 1 million property listings on Foreclosure.com!
|
browse all offers | |||


 | Extra Home inspections in this Real Estate climate (23 replies) |
| Looking at Denver real estate - a little torn between the city and the burbs (107 replies) |
| Houses in Highlands Ranch (15 replies) |
| Whats the scoop on living in Highlands Ranch? Pros and cons? (29 replies) |
| Castle Pines, Highlands Ranch, Castle Rock or ??? (19 replies) |
| Apartments - Legacy Highlands Ranch, Palomino Park (5 replies) |
Median year apartment built: 2002
Household type by relationship:
Households: 103,830- Male householders: 20,812 (4,247 living alone), Female householders: 18,027 (3,777 living alone)
25,983 spouses (25,983 opposite-sex spouses), 1,349 unmarried partners, (1,274 opposite-sex unmarried partners), 34,129 children (32,246 natural, 768 adopted, 1,115 stepchildren), 307 grandchildren, 188 brothers or sisters, 852 parents, 0 foster children, 763 other relatives, 1,259 non-relatives
- In group quarters: 161
Size of family households: 12,168 2-persons, 6,820 3-persons, 6,415 4-persons, 2,740 5-persons, 853 6-persons, 407 7-or-more-persons.
Size of nonfamily households: 8,024 1-person, 1,412 2-persons.
22,401 married couples with children.
2,807 single-parent households (839 men, 1,968 women).
89.4% of residents of Highlands Ranch speak English at home.
3.3% of residents speak Spanish at home (82% speak English very well, 10% speak English well, 6% speak English not well, 1% don't speak English at all).
3.6% of residents speak other Indo-European language at home (87% speak English very well, 7% speak English well, 5% speak English not well).
3.3% of residents speak Asian or Pacific Island language at home (72% speak English very well, 20% speak English well, 6% speak English not well, 3% don't speak English at all).
0.3% of residents speak other language at home (96% speak English very well, 4% speak English well).
Foreign born population: 9,764 (9.4%)
(63.5% of them are naturalized citizens)
| Here: | 8.2 |
| State: | 6.8 |
| Here: | 4.7 |
| State: | 4.0 |
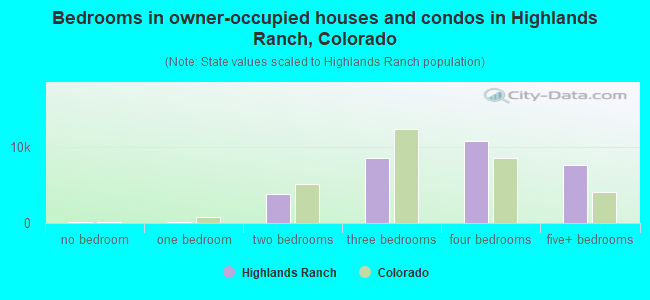
- Bedrooms in owner-occupied houses and condos in Highlands Ranch, Colorado
- 113no bedroom
- 1631 bedroom
- 3,8352 bedrooms
- 8,5143 bedrooms
- 10,7044 bedrooms
- 7,5565+ bedrooms
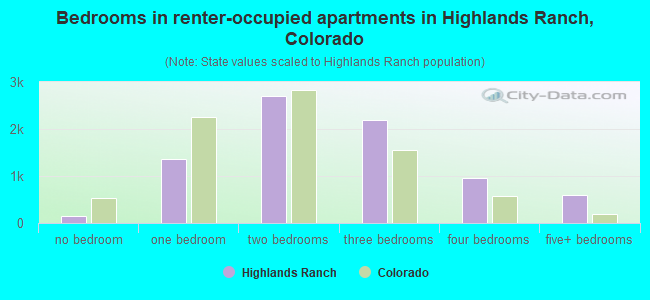
- Bedrooms in renter-occupied apartments in Highlands Ranch, Colorado
- 151no bedroom
- 1,3551 bedroom
- 2,6922 bedrooms
- 2,2013 bedrooms
- 9654 bedrooms
- 5905+ bedrooms
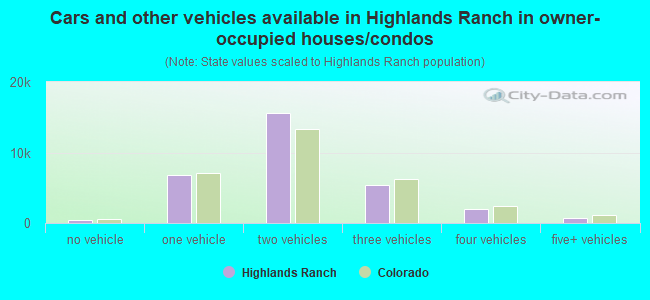
- Cars and other vehicles available in Highlands Ranch in owner-occupied houses/condos
- 445no vehicle
- 6,8551 vehicle
- 15,5702 vehicles
- 5,3773 vehicles
- 1,9694 vehicles
- 6695+ vehicles
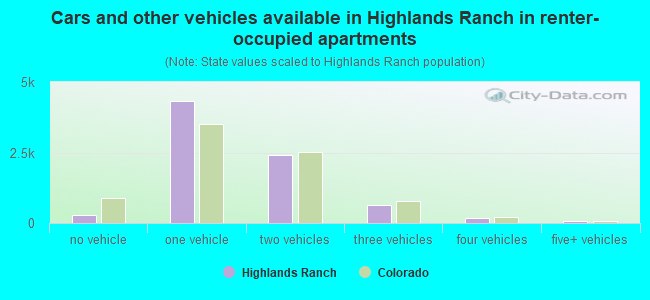
- Cars and other vehicles available in Highlands Ranch in renter-occupied apartments
- 289no vehicle
- 4,3361 vehicle
- 2,4132 vehicles
- 6473 vehicles
- 1914 vehicles
- 785+ vehicles
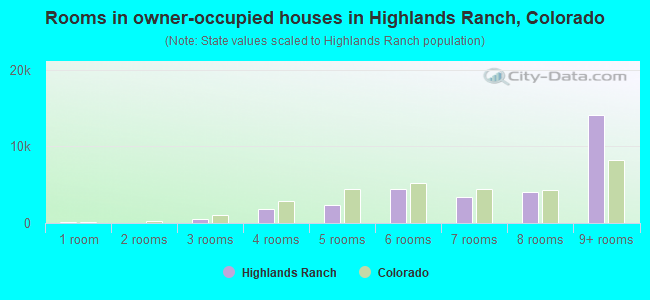
- Rooms in owner-occupied houses in Highlands Ranch, Colorado
- 1131 room
- 02 rooms
- 5843 rooms
- 1,8234 rooms
- 2,4025 rooms
- 4,3766 rooms
- 3,4117 rooms
- 4,0968 rooms
- 14,0809+ rooms
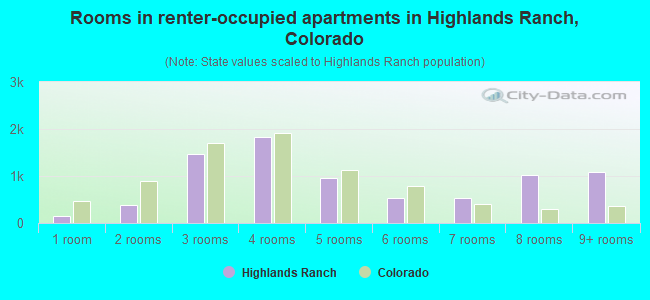
- Rooms in renter-occupied apartments in Highlands Ranch, Colorado
- 1511 room
- 3902 rooms
- 1,4613 rooms
- 1,8294 rooms
- 9495 rooms
- 5286 rooms
- 5407 rooms
- 1,0228 rooms
- 1,0849+ rooms
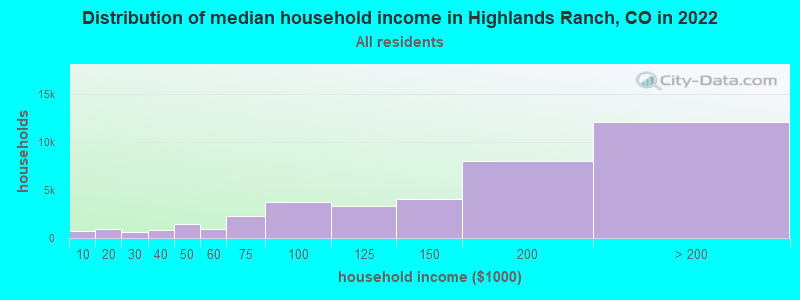
Highlands Ranch, CO household income distribution

- 686Less than $10,000
- 897$10,000 to $19,999
- 615$20,000 to $29,999
- 804$30,000 to $39,999
- 1,439$40,000 to $49,999
- 935$50,000 to $59,999
- 2,302$60,000 to $74,999
- 3,704$75,000 to $99,999
- 3,366$100,000 to $124,999
- 4,051$125,000 to $149,999
- 7,965$150,000 to $199,999
- 12,075$200,000 or more
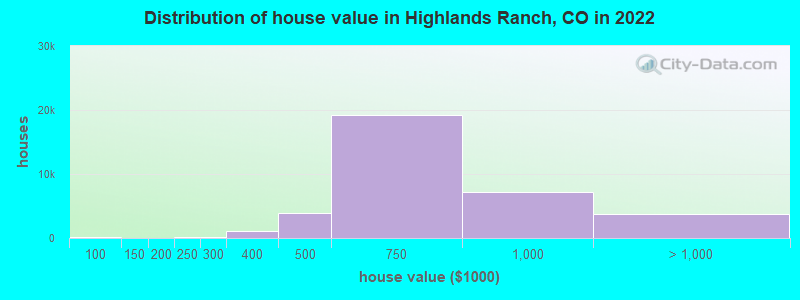
Home value of owner - occupied houses in 2022 in Highlands Ranch, CO
-
- 117Less than $10,000
- 14$10,000 to $14,999
- 3$20,000 to $24,999
- 6$25,000 to $29,999
- 22$40,000 to $49,999
- 62$50,000 to $59,999
- 55$60,000 to $69,999
- 17$70,000 to $79,999
- 45$80,000 to $89,999
- 12$90,000 to $99,999
- 8$100,000 to $124,999
- 5$125,000 to $149,999
- 14$150,000 to $174,999
- 24$175,000 to $199,999
- 102$200,000 to $249,999
- 195$250,000 to $299,999
- 1,042$300,000 to $399,999
- 3,886$400,000 to $499,999
- 19,293$500,000 to $749,999
- 7,124$750,000 to $999,999
- 2,983$1,000,000 to $1,499,999
- 490$1,500,000 to $1,999,999
- 315$2,000,000 or more
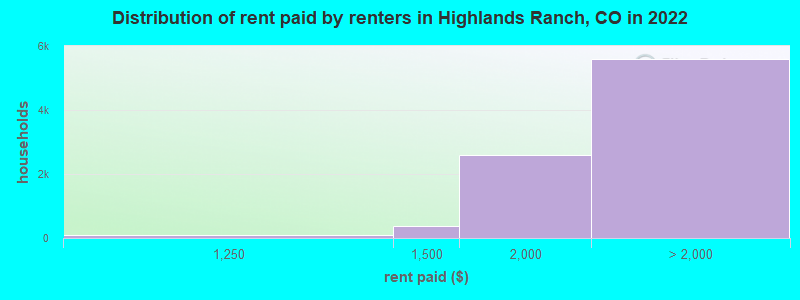
Rent paid by renters in 2022 in Highlands Ranch, CO
-
- 31Less than $100
- 21$150 to $199
- 35$200 to $249
- 31$500 to $549
- 38$750 to $799
- 19$800 to $899
- 90$1,000 to $1,249
- 382$1,250 to $1,499
- 2,594$1,500 to $1,999
- 2,431$2,000 to $2,499
- 1,584$2,500 to $2,999
- 489$3,000 to $3,499
- 875$3,500 or more
- 197No cash rent
Percentage of workers working in this county: 59.8%
Number of people working at home: 19,388 (33.3% of all workers)
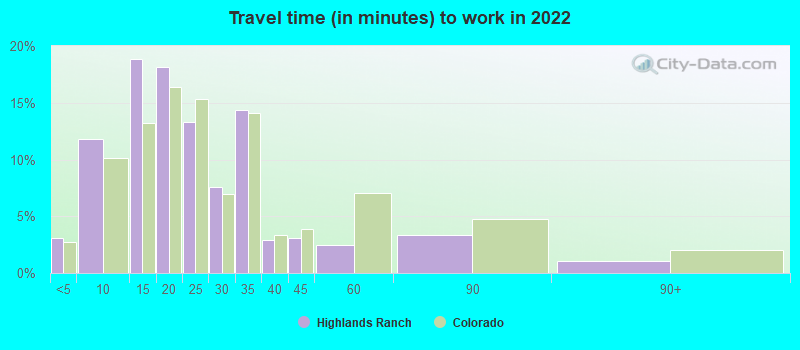
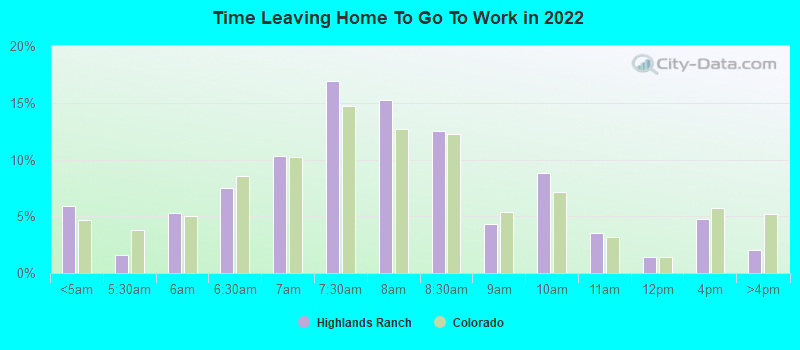
Travel time to work (commute)
- Less than 5 minutes: 841
- 5 to 9 minutes: 2,997
- 10 to 14 minutes: 5,452
- 15 to 19 minutes: 5,577
- 20 to 24 minutes: 7,217
- 25 to 29 minutes: 2,440
- 30 to 34 minutes: 4,105
- 35 to 39 minutes: 1,631
- 40 to 44 minutes: 1,452
- 45 to 59 minutes: 3,496
- 60 to 89 minutes: 1,632
- 90 or more minutes: 450
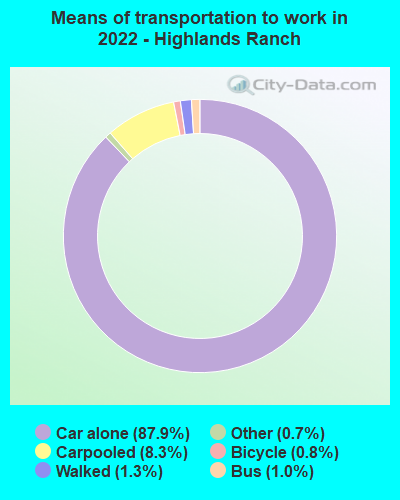
Means of transportation to work:
- Drove a car alone: 21,971 (50.1%)
- Carpooled: 2,348 (5.4%)
- Bus: 354 (0.8%)
- Subway or elevated rail: 8 (0.0%)
- Taxi: 178 (0.4%)
- Bicycle: 318 (0.7%)
- Walked: 311 (0.7%)
- Worked at home: 19,388 (44.2%)
- Unemployment by race in 2022
- Unemployment rate for White non-Hispanic residents
- 0.3%Males
- 3.6%Females
- Unemployment rate for Black residents
- 7.2%Males
- Unemployment rate for Asian residents
- 1.0%Males
- 5.0%Females
- Unemployment rate for other race residents
- 2.9%Males
- Unemployment rate for two or more race residents
- 4.6%Males
- 2.1%Females
- Unemployment rate for Hispanic or Latino residents
- 8.2%Males
- 1.1%Females
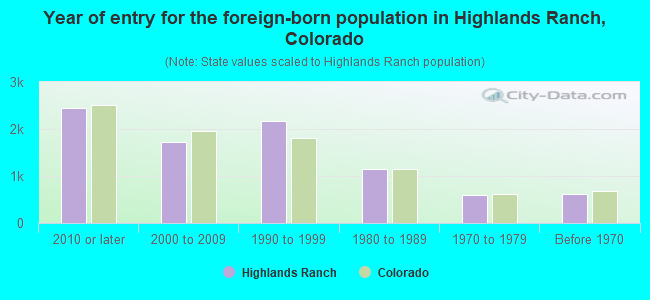
- Year of entry for the foreign-born population in Highlands Ranch, Colorado
- 2,4502010 or later
- 1,7332000 to 2009
- 2,1761990 to 1999
- 1,1591980 to 1989
- 6031970 to 1979
- 608Before 1970
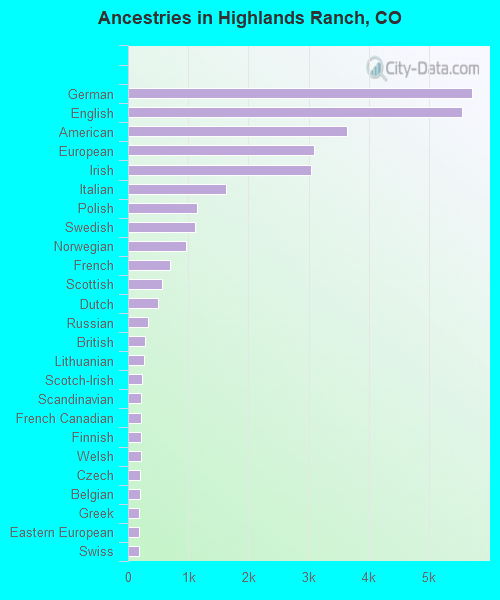
First ancestries reported:
- German: 5,714 (12.8%)
- English: 5,543 (12.4%)
- American: 3,647 (8.2%)
- European: 3,099 (7.0%)
- Irish: 3,045 (6.8%)
- Italian: 1,637 (3.7%)
- Polish: 1,151 (2.6%)
- Swedish: 1,115 (2.5%)
- Norwegian: 971 (2.2%)
- French: 697 (1.6%)
- Scottish: 563 (1.3%)
- Dutch: 506 (1.1%)
- Russian: 336 (0.8%)
- British: 284 (0.6%)
- Lithuanian: 263 (0.6%)
- Scotch-Irish: 240 (0.5%)
- Scandinavian: 218 (0.5%)
- French Canadian: 216 (0.5%)
- Finnish: 212 (0.5%)
- Welsh: 208 (0.5%)
- Czech: 206 (0.5%)
- Belgian: 193 (0.4%)
- Greek: 191 (0.4%)
- Eastern European: 186 (0.4%)
- Swiss: 182 (0.4%)
- Northern European: 176 (0.4%)
- Hungarian: 153 (0.3%)
- Ukrainian: 152 (0.3%)
- Egyptian: 138 (0.3%)
- Danish: 138 (0.3%)
- Iranian: 118 (0.3%)
- Czechoslovakian: 102 (0.2%)
- Romanian: 101 (0.2%)
- Portuguese: 98 (0.2%)
- Canadian: 98 (0.2%)
- Brazilian: 91 (0.2%)
- Croatian: 67 (0.2%)
- Austrian: 53 (0.1%)
- South African: 32 (0.07%)
- Slovak: 31 (0.07%)
- German Russian: 29 (0.07%)
- Yugoslavian: 29 (0.07%)
- Ethiopian: 26 (0.06%)
- Australian: 26 (0.06%)
- Lebanese: 26 (0.06%)
- Pennsylvania German: 25 (0.06%)
- African: 22 (0.05%)
- Slavic: 20 (0.04%)
- Jamaican: 20 (0.04%)
- Turkish: 20 (0.04%)
- Arab: 16 (0.04%)
- Jordanian: 16 (0.04%)
- Haitian: 16 (0.04%)
- Barbadian: 15 (0.03%)
- Celtic: 9 (0.02%)
- Slovene: 9 (0.02%)
- Bahamian: 8 (0.02%)
- Icelander: 5 (0.01%)
- Estonian: 5 (0.01%)
- Cajun: 5 (0.01%)
- New Zealander: 3 (0.01%)
Most common places of birth for foreign-born residents (%):
| Highlands Ranch: | 18.2% (1,633) |
| Colorado: | 4.0% (21,689) |
| Highlands Ranch: | 9.2% (827) |
| Colorado: | 2.9% (15,981) |
| Highlands Ranch: | 8.4% (753) |
| Colorado: | 2.7% (15,026) |
| Highlands Ranch: | 7.0% (628) |
| Colorado: | 3.3% (17,998) |
| Highlands Ranch: | 6.3% (560) |
| Colorado: | 38.3% (209,491) |
| Highlands Ranch: | 5.0% (449) |
| Colorado: | 2.3% (12,342) |
| Highlands Ranch: | 3.8% (343) |
| Colorado: | 0.9% (4,772) |
| Highlands Ranch: | 2.7% (242) |
| Colorado: | 2.5% (13,706) |
| Highlands Ranch: | 2.6% (237) |
| Colorado: | 1.0% (5,365) |
| Highlands Ranch: | 2.6% (235) |
| Colorado: | 0.1% (547) |
| Highlands Ranch: | 2.3% (206) |
| Colorado: | 3.0% (16,616) |
| Highlands Ranch: | 1.9% (173) |
| Colorado: | 1.1% (5,799) |
| Highlands Ranch: | 1.9% (171) |
| Colorado: | 0.7% (3,568) |
| Highlands Ranch: | 1.7% (152) |
| Colorado: | 1.4% (7,860) |
| Highlands Ranch: | 1.6% (144) |
| Colorado: | 1.2% (6,672) |
Place of birth for U.S.-born residents:
- This state: 38,859
- Other state: 52,761
- Northeast: 7,703
- Midwest: 18,337
- South: 12,491
- West: 14,230
89.3% of Highlands Ranch residents lived in the same house 1 years ago.
Out of people who lived in different houses, 28.1% lived in this county.
Out of people who lived in different counties, 54.1% lived in Colorado.
| Highlands Ranch: | 89.3% |
| State average: | 83.6% |
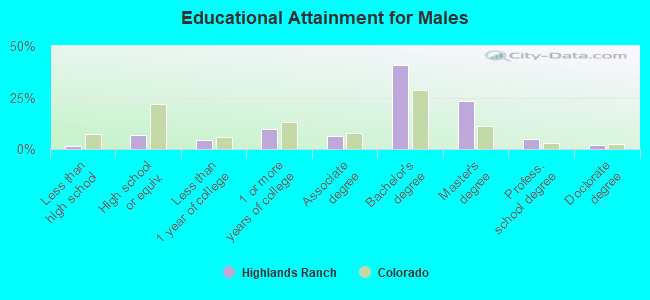
Education attainment for males 25 years and older:
- No schooling: 0
- Nursery to 4th grade: 56
- 5th and 6th grade: 0
- 7th and 8th grade: 165
- 9th grade: 0
- 10th grade: 187
- 11th grade: 74
- 12th grade, no diploma: 0
- High school graduate (or equivalency): 2,418
- Less than 1 year of college: 1,574
- Some college more than 1 year, no degree: 3,428
- Associate degree: 2,189
- Bachelor's degree: 14,238
- Master's degree: 8,088
- Professional school degree: 1,636
- Doctorate degree: 675
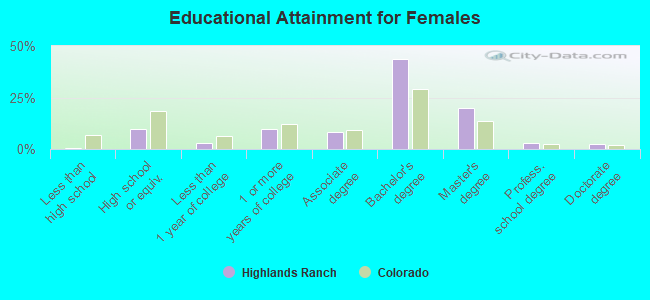
Education attainment for females 25 years and older:
- No schooling: 0
- Nursery to 4th grade: 0
- 5th and 6th grade: 58
- 7th and 8th grade: 0
- 9th grade: 0
- 10th grade: 0
- 11th grade: 0
- 12th grade, no diploma: 126
- High school graduate (or equivalency): 3,554
- Less than 1 year of college: 1,018
- Some college more than 1 year, no degree: 3,414
- Associate degree: 2,952
- Bachelor's degree: 15,773
- Master's degree: 7,180
- Professional school degree: 966
- Doctorate degree: 872
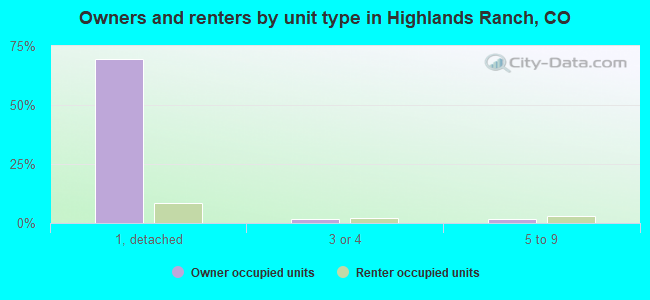
Housing units in structures:
- One, detached: 30,815
- One, attached: 2,412
- 3 or 4: 1,480
- 5 to 9: 1,739
- 10 to 19: 1,184
- 20 to 49: 767
- 50 or more: 1,593
Housing units lacking complete kitchen facilities in 2022: 0.3%
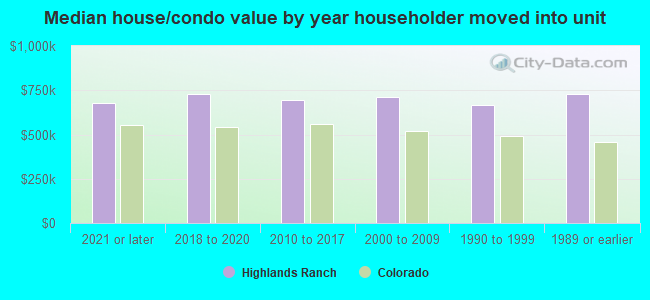
House/condo owner moved in on average 10 years ago
Renter moved in on average 2 years ago
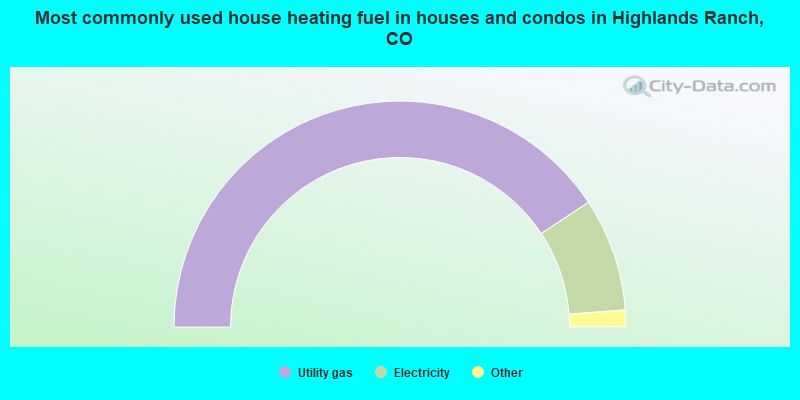
- 81.4%Utility gas
- 16.2%Electricity
- 1.2%Solar energy
- 0.9%Bottled, tank, or LP gas
- 0.2%Wood
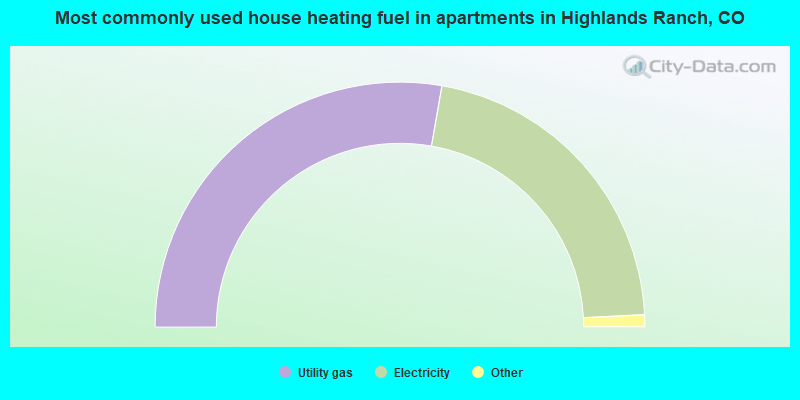
- 55.5%Utility gas
- 42.9%Electricity
- 0.7%Bottled, tank, or LP gas
- 0.3%No fuel used
- 0.3%Other fuel
- 0.1%Fuel oil, kerosene, etc.
- 0.1%Wood
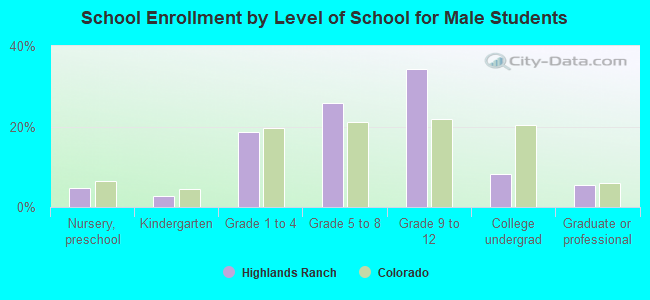
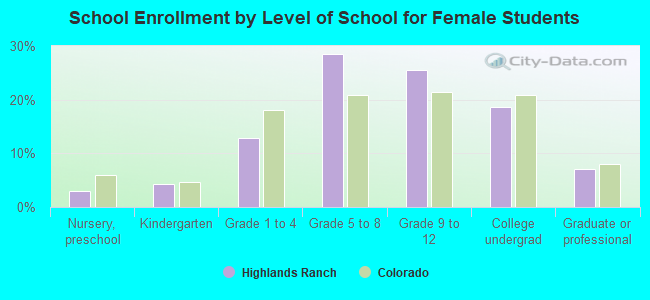
Private vs. public school enrollment:
| Here: | 17.1% |
| Colorado: | 11.4% |
| Here: | 10.0% |
| Colorado: | 8.5% |
| Here: | 7.5% |
| Colorado: | 14.0% |