Highland Park, NJ (New Jersey) Houses and Residents
Estimated median house or condo value in 2022: $449,614 (it was $179,000 in 2000 )
Highland Park:
$449,614New Jersey:
$428,900
Lower value quartile - upper value quartile: $345,298 - $606,401Mean price in 2022: Detached houses: $516,249 Here:
$516,249State:
$537,591
Townhouses or other attached units: $558,640 Here:
$558,640State:
$381,113
In 2-unit structures: $475,541 Here:
$475,541State:
$444,476
In 3-to-4-unit structures: $106,037 Here:
$106,037State:
$457,463
In 5-or-more-unit structures: $394,565 Here:
$394,565State:
$368,745
Total population: 14,436 (Urban population: 13,999, Rural population: 0)
Houses: 6,997 (6,599 occupied: 2,553 owner occupied, 4,101 renter occupied )
% of renters here:
62%State:
35%
Housing density: 3,806 houses/condos per square mile
Median price asked for vacant for-sale houses and condos in 2022: $3,713,537.
Median contract rent in 2022: $1,632 (lower quartile is $1,295, upper quartile is $1,895)
Median rent asked for vacant for-rent units in 2022: $1,883
Median gross rent in Highland Park, NJ in 2022: $1,684
Housing units in Highland Park with a mortgage: 1,620 (159 second mortgage, 11 home equity loan, 100 both second mortgage and home equity loan )Houses without a mortgage: 127
Median household income for houses/condos with a mortgage: $160,939
Median household income for apartments without a mortgage: $117,413
Median monthly housing costs: $1,773
Data:
Median house or condo value ($)
Median house or condo value ($ change since 2000)
Median house or condo value ($) - White
Median house or condo value ($) - Black or African American
Median house or condo value ($) - Asian
Median house or condo value ($) - Hispanic or Latino
Median house or condo value ($) - American Indian and Alaska Native
Median house or condo value ($) - Multirace
Median house or condo value ($) - Other Race
Median price asked for mobile homes ($)
Household density (households per square mile)
Mean house or condo value by units in structure - 1, detached ($)
Mean house or condo value by units in structure - 1, attached ($)
Mean house or condo value by units in structure - 2 ($)
Mean house or condo value by units in structure by units in structure - 3 or 4 ($)
Mean house or condo value by units in structure - 5 or more ($)
Mean house or condo value by units in structure - Boat, RV, van, etc. ($)
Mean house or condo value by units in structure - Mobile home ($)
Median contract rent ($)
Median contract rent - Lower quartile ($)
Median contract rent - Upper quartile ($)
Median gross rent ($)
Urban houses (%)
Rural houses (%)
Houses occupied (%)
Houses occupied (% change since 2000)
Houses owner occupied (%)
Houses owner occupied (% change since 2000)
Houses renter occupied (%)
Houses renter occupied (% change since 2000)
Vacant housing units - For rent (%)
Vacant housing units - For rent (% change since 2000)
Vacant housing units - For sale only (%)
Vacant housing units - For sale only (% change since 2000)
Vacant housing units - Rented or sold, not occupied (%)
Vacant housing units - Rented or sold, not occupied (% change since 2000)
Vacant housing units - For seasonal, recreational, or occasional use (%)
Vacant housing units - For seasonal, recreational, or occasional use (% change since 2000)
Vacant housing units - For migrant workers (%)
Vacant housing units - For migrant workers (% change since 2000)
Vacant housing units - Other vacant (%)
Vacant housing units - Other vacant (% change since 2000)
Median monthly housing costs ($)
Median household income for houses/condos with a mortgage ($)
Median household income for houses/condos without a mortgage ($)
Median household income ($)
Median household income ($) - White
Median household income ($) - Black or African American
Median household income ($) - Asian
Median household income ($) - Hispanic or Latino
Median household income ($) - American Indian and Alaska Native
Median household income ($) - Multirace
Median household income ($) - Other Race
Mortgage status - with mortgage (%)
Mortgage status - with second mortgage (%)
Mortgage status - with home equity loan (%)
Mortgage status - with both second mortgage and home equity loan (%)
Mortgage status - without a mortgage (%)
Median year house/condo built
Median year apartment built
Household type by relationship - Male householder living alone (%)
Household type by relationship - Male householder not living alone (%)
Household type by relationship - Female householder living alone (%)
Household type by relationship - Female householder not living alone (%)
Household type by relationship - Opposite-Sex spouse (%)
Household type by relationship - Same-Sex spouse (%)
Household type by relationship - Opposite-Sex unmarried partner (%)
Household type by relationship - Same-Sex unmarried partner (%)
Household type by relationship - In group quarters (%)
Size of family households - 2-person household (%)
Size of family households - 3-person household (%)
Size of family households - 4-person household (%)
Size of family households - 5-person household (%)
Size of family households - 6-person household (%)
Size of family households - 7-or-more-person household (%)
Size of nonfamily households - 1-person household (%)
Size of nonfamily households - 2-person household (%)
Size of nonfamily households - 3-person household (%)
Size of nonfamily households - 4-person household (%)
Size of nonfamily households - 5-person household (%)
Size of nonfamily households - 6-person household (%)
Size of nonfamily households - 7-or-moreperson household (%)
Year house built - Built 2010 or later (%)
Year house built - Built 2000 to 2009 (%)
Year house built - Built 1990 to 1999 (%)
Year house built - Built 1980 to 1989 (%)
Year house built - Built 1970 to 1979 (%)
Year house built - Built 1960 to 1969 (%)
Year house built - Built 1950 to 1959 (%)
Year house built - Built 1940 to 1949 (%)
Year house built - Built 1939 or earlier (%)
Median number of rooms in houses and condos
Median number of rooms in apartments
Median number of bedrooms in owner occupied houses
Mean number of bedrooms in owner occupied houses
Median number of bedrooms in renter occupied houses
Mean number of bedrooms in renter occupied houses
Median number of vehichles in owner occupied houses
Mean number of vehichles in owner occupied houses
Median number of vehichles in renter occupied houses
Mean number of vehichles in renter occupied houses
Rooms in owner-occupied houses - 1 room (%)
Rooms in owner-occupied houses - 2 rooms (%)
Rooms in owner-occupied houses - 3 rooms (%)
Rooms in owner-occupied houses - 4 rooms (%)
Rooms in owner-occupied houses - 5 rooms (%)
Rooms in owner-occupied houses - 6 rooms (%)
Rooms in owner-occupied houses - 7 rooms (%)
Rooms in owner-occupied houses - 8 rooms (%)
Rooms in owner-occupied houses - 9+ rooms (%)
Rooms in renter-occupied houses - 1 room (%)
Rooms in renter-occupied houses - 2 rooms (%)
Rooms in renter-occupied houses - 3 rooms (%)
Rooms in renter-occupied houses - 4 rooms (%)
Rooms in renter-occupied houses - 5 rooms (%)
Rooms in renter-occupied houses - 6 rooms (%)
Rooms in renter-occupied houses - 7 rooms (%)
Rooms in renter-occupied houses - 8 rooms (%)
Rooms in renter-occupied houses - 9+ rooms (%)
Bedrooms in owner-occupied houses - no bedrooms (%)
Bedrooms in owner-occupied houses - 1 bedroom (%)
Bedrooms in owner-occupied houses - 2 bedrooms (%)
Bedrooms in owner-occupied houses - 3 bedrooms (%)
Bedrooms in owner-occupied houses - 4 bedrooms (%)
Bedrooms in owner-occupied houses - 5+ bedrooms (%)
Bedrooms in renter-occupied houses - no bedrooms (%)
Bedrooms in renter-occupied houses - 1 bedroom (%)
Bedrooms in renter-occupied houses - 2 bedrooms (%)
Bedrooms in renter-occupied houses - 3 bedrooms (%)
Bedrooms in renter-occupied houses - 4 bedrooms (%)
Bedrooms in renter-occupied houses - 5+ bedrooms (%)
Vehicles available in owner-occupied houses - no vehicle available (%)
Vehicles available in owner-occupied houses - 1 vehicle available(%)
Vehicles available in owner-occupied houses - 2 Vehicles available (%)
Vehicles available in owner-occupied houses - 3 Vehicles available (%)
Vehicles available in owner-occupied houses - 4 Vehicles available (%)
Vehicles available in owner-occupied houses - 5+ Vehicles available (%)
Vehicles available in renter-occupied houses - no vehicle available (%)
Vehicles available in renter-occupied houses - 1 vehicle available (%)
Vehicles available in renter-occupied houses - 2 Vehicles available (%)
Vehicles available in renter-occupied houses - 3 Vehicles available (%)
Vehicles available in renter-occupied houses - 4 Vehicles available (%)
Vehicles available in renter-occupied houses - 5+ Vehicles available (%)
Housing units in structures - 1, detached (%)
Housing units in structures - 1, attached (%)
Housing units in structures - 2 (%)
Housing units in structures - 3 or 4 (%)
Housing units in structures - 5 to 9 (%)
Housing units in structures - 10 to 19 (%)
Housing units in structures - 20 to 49 (%)
Housing units in structures - 50 or more (%)
Housing units in structures - Mobile home (%)
Housing units in structures - Boat, RV, van, etc. (%)
Housing units in structures - Owners - 1, detached (%)
Housing units in structures - Owners - 1, attached (%)
Housing units in structures - Owners - 2 (%)
Housing units in structures - Owners - 3 or 4 (%)
Housing units in structures - Owners - 5 to 9 (%)
Housing units in structures - Owners - 10 to 19 (%)
Housing units in structures - Owners - 20 to 49 (%)
Housing units in structures - Owners - 50 or more (%)
Housing units in structures - Owners - Mobile home (%)
Housing units in structures - Owners - Boat, RV, van, etc. (%)
Housing units in structures - Renters - 1, detached (%)
Housing units in structures - Renters - 1, attached (%)
Housing units in structures - Renters - 2 (%)
Housing units in structures - Renters - 3 or 4 (%)
Housing units in structures - Renters - 5 to 9 (%)
Housing units in structures - Renters - 10 to 19 (%)
Housing units in structures - Renters - 20 to 49 (%)
Housing units in structures - Renters - 50 or more (%)
Housing units in structures - Renters - Mobile home (%)
Housing units in structures - Renters - Boat, RV, van, etc. (%)
House/condo owner moved in on average (years ago)
Renter moved in on average (years ago)
Year householder moved into unit - Moved in 1999 to March 2000 (%)
Year householder moved into unit - Moved in 1999 to March 2000 (%) - White
Year householder moved into unit - Moved in 1999 to March 2000 (%) - Black or African American
Year householder moved into unit - Moved in 1999 to March 2000 (%) - Asian
Year householder moved into unit - Moved in 1999 to March 2000 (%) - Hispanic or Latino
Year householder moved into unit - Moved in 1999 to March 2000 (%) - American Indian and Alaska Native
Year householder moved into unit - Moved in 1999 to March 2000 (%) - Multirace
Year householder moved into unit - Moved in 1999 to March 2000 (%) - Other Race
Year householder moved into unit - Moved in 1995 to 1998 (%)
Year householder moved into unit - Moved in 1995 to 1998 (%) - White
Year householder moved into unit - Moved in 1995 to 1998 (%) - Black or African American
Year householder moved into unit - Moved in 1995 to 1998 (%) - Asian
Year householder moved into unit - Moved in 1995 to 1998 (%) - Hispanic or Latino
Year householder moved into unit - Moved in 1995 to 1998 (%) - American Indian and Alaska Native
Year householder moved into unit - Moved in 1995 to 1998 (%) - Multirace
Year householder moved into unit - Moved in 1995 to 1998 (%) - Other Race
Year householder moved into unit - Moved in 1990 to 1994 (%)
Year householder moved into unit - Moved in 1990 to 1994 (%) - White
Year householder moved into unit - Moved in 1990 to 1994 (%) - Black or African American
Year householder moved into unit - Moved in 1990 to 1994 (%) - Asian
Year householder moved into unit - Moved in 1990 to 1994 (%) - Hispanic or Latino
Year householder moved into unit - Moved in 1990 to 1994 (%) - American Indian and Alaska Native
Year householder moved into unit - Moved in 1990 to 1994 (%) - Multirace
Year householder moved into unit - Moved in 1990 to 1994 (%) - Other Race
Year householder moved into unit - Moved in 1980 to 1989 (%)
Year householder moved into unit - Moved in 1980 to 1989 (%) - White
Year householder moved into unit - Moved in 1980 to 1989 (%) - Black or African American
Year householder moved into unit - Moved in 1980 to 1989 (%) - Asian
Year householder moved into unit - Moved in 1980 to 1989 (%) - Hispanic or Latino
Year householder moved into unit - Moved in 1980 to 1989 (%) - American Indian and Alaska Native
Year householder moved into unit - Moved in 1980 to 1989 (%) - Multirace
Year householder moved into unit - Moved in 1980 to 1989 (%) - Other Race
Year householder moved into unit - Moved in 1970 to 1979 (%)
Year householder moved into unit - Moved in 1970 to 1979 (%) - White
Year householder moved into unit - Moved in 1970 to 1979 (%) - Black or African American
Year householder moved into unit - Moved in 1970 to 1979 (%) - Asian
Year householder moved into unit - Moved in 1970 to 1979 (%) - Hispanic or Latino
Year householder moved into unit - Moved in 1970 to 1979 (%) - American Indian and Alaska Native
Year householder moved into unit - Moved in 1970 to 1979 (%) - Multirace
Year householder moved into unit - Moved in 1970 to 1979 (%) - Other Race
Year householder moved into unit - Moved in 1969 or earlier (%)
Year householder moved into unit - Moved in 1969 or earlier (%) - White
Year householder moved into unit - Moved in 1969 or earlier (%) - Black or African American
Year householder moved into unit - Moved in 1969 or earlier (%) - Asian
Year householder moved into unit - Moved in 1969 or earlier (%) - Hispanic or Latino
Year householder moved into unit - Moved in 1969 or earlier (%) - American Indian and Alaska Native
Year householder moved into unit - Moved in 1969 or earlier (%) - Multirace
Year householder moved into unit - Moved in 1969 or earlier (%) - Other Race
Housing units lacking complete plumbing facilities (%)
Housing units lacking complete kitchen facilities (%)
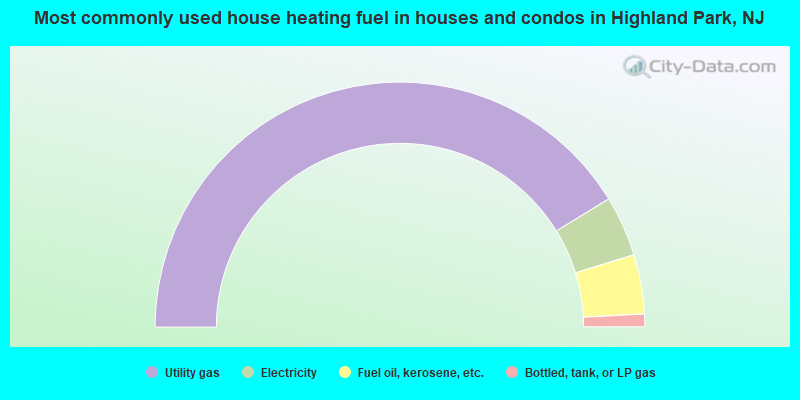
House heating fuel used in houses and condos - Utility gas (%)
House heating fuel used in houses and condos - Bottled, tank, or LP gas (%)
House heating fuel used in houses and condos - Electricity (%)
House heating fuel used in houses and condos - Fuel oil, kerosene, etc. (%)
House heating fuel used in houses and condos - Coal or coke (%)
House heating fuel used in houses and condos - Wood (%)
House heating fuel used in houses and condos - Solar energy (%)
House heating fuel used in houses and condos - Other fuel (%)
House heating fuel used in houses and condos - No fuel used (%)
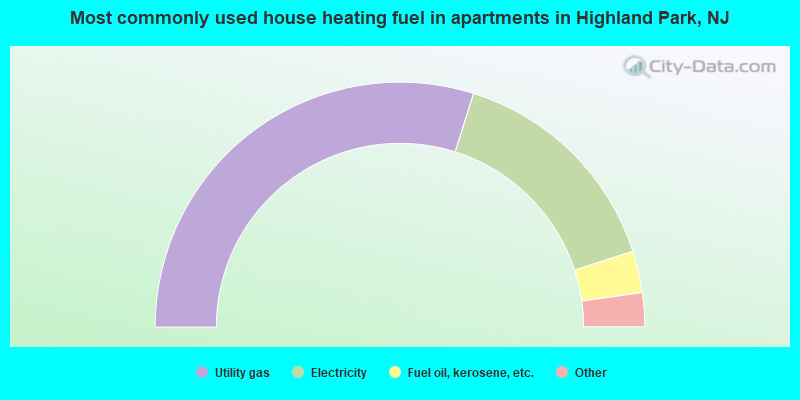
House heating fuel used in apartments - Utility gas (%)
House heating fuel used in apartments - Bottled, tank, or LP gas (%)
House heating fuel used in apartments - Electricity (%)
House heating fuel used in apartments - Fuel oil, kerosene, etc. (%)
House heating fuel used in apartments - Coal or coke (%)
House heating fuel used in apartments - Wood (%)
House heating fuel used in apartments - Solar energy (%)
House heating fuel used in apartments - Other fuel (%)
House heating fuel used in apartments - No fuel used (%)
Median year house/condo built: 1946Median year apartment built: 1968Household type by relationship:
Households: 15,018
Male householders: 3,510 (1,214 living alone ), Female householders: 3,046 (1,161 living alone )2,648 spouses (2,648 opposite-sex spouses ), 493 unmarried partners , (493 opposite-sex unmarried partners ), 3,888 children (3,802 natural , 44 adopted , 42 stepchildren ), 7 grandchildren , 191 brothers or sisters , 306 parents , 0 foster children , 350 other relatives , 539 non-relatives In group quarters: 35
Size of family households: 1,621 2-persons , 712 3-persons , 870 4-persons , 273 5-persons , 74 6-persons , 34 7-or-more-persons .
Size of nonfamily households: 2,416 1-person , 574 2-persons , 121 3-persons , 18 4-persons , 9 5-persons , 10 6-persons .
1,894 married couples with children. single-parent households (78 men , 488 women ).
57.8% of residents of Highland Park speak English at home. of residents speak Spanish at home (47% speak English very well , 21% speak English well , 28% speak English not well , 5% don't speak English at all ).of residents speak other Indo-European language at home (73% speak English very well , 22% speak English well , 5% speak English not well ).of residents speak Asian or Pacific Island language at home (58% speak English very well , 31% speak English well , 10% speak English not well ).of residents speak other language at home (78% speak English very well , 19% speak English well , 3% speak English not well ).
Foreign born population: 5,730 (38.2%)of them are naturalized citizens )
Median number of rooms in houses and condos:
Median number of rooms in apartments
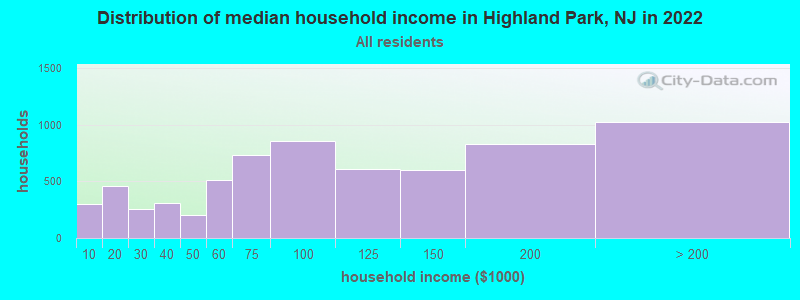
Highland Park, NJ household income distribution 304 Less than $10,000464 $10,000 to $19,999255 $20,000 to $29,999306 $30,000 to $39,999203 $40,000 to $49,999510 $50,000 to $59,999734 $60,000 to $74,999855 $75,000 to $99,999610 $100,000 to $124,999601 $125,000 to $149,999835 $150,000 to $199,9991,026 $200,000 or more
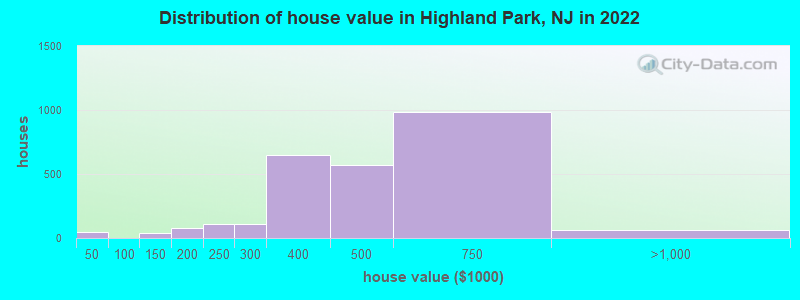
Home value of owner - occupied houses in 2022 in Highland Park, NJ 43 Less than $10,00037 $125,000 to $149,99937 $150,000 to $174,99938 $175,000 to $199,999106 $200,000 to $249,999113 $250,000 to $299,999648 $300,000 to $399,999572 $400,000 to $499,999981 $500,000 to $749,99954 $750,000 to $999,9998 $1,000,000 to $1,499,999Rent paid by renters in 2022 in Highland Park, NJ 73 $150 to $19923 $200 to $24965 $250 to $29988 $300 to $34917 $450 to $49915 $650 to $69998 $900 to $999225 $1,000 to $1,249727 $1,250 to $1,4991,807 $1,500 to $1,999550 $2,000 to $2,49932 $2,500 to $2,999126 No cash rent
Percentage of workers working in this county: 75.6%Number of people working at home: 2,035 (23.8% of all workers )
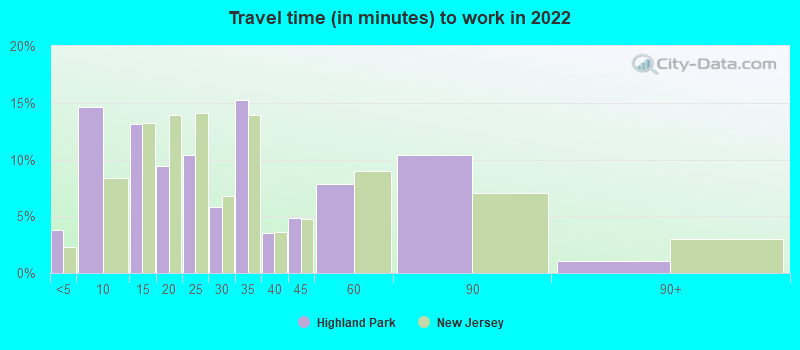
Travel time to work (commute)
Less than 5 minutes: 1515 to 9 minutes: 90910 to 14 minutes: 1,31115 to 19 minutes: 1,46520 to 24 minutes: 47625 to 29 minutes: 43430 to 34 minutes: 56235 to 39 minutes: 15340 to 44 minutes: 17545 to 59 minutes: 50560 to 89 minutes: 39490 or more minutes: 280
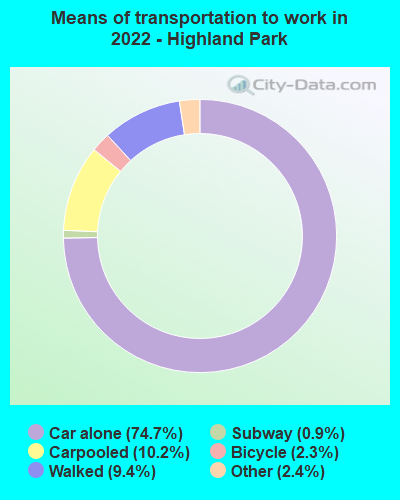
Means of transportation to work:
Drove a car alone: 1,960 (43.4%)Carpooled: 317 (7.0%)Long-distance train or commuter rail : 19 (0.4%)Taxi: 87 (1.9%)Bicycle: 65 (1.4%)Walked: 364 (8.1%)Worked at home: 2,035 (45.1%)
Unemployment by race in 2022
Unemployment rate for White non-Hispanic residents 5.5% Males5.8% FemalesUnemployment rate for Black residents 19.5% MalesUnemployment rate for Asian residents 5.8% Males0.4% FemalesUnemployment rate for other race residents 7.9% MalesUnemployment rate for two or more race residents 2.3% FemalesUnemployment rate for Hispanic or Latino residents 2.0% Males5.6% Females
Year of entry for the foreign-born population in Highland Park, New Jersey
2,503 2010 or later 1,598 2000 to 2009 692 1990 to 1999 736 1980 to 1989 314 1970 to 1979 472 Before 1970
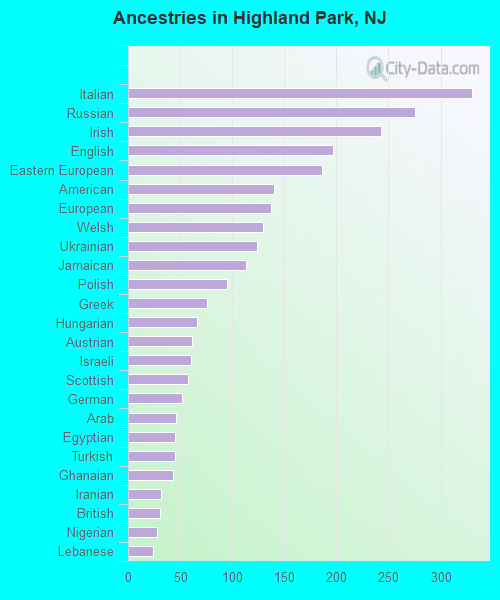
First ancestries reported:
Italian: 330 (3.8%)
Russian: 275 (3.2%)
Irish: 243 (2.8%)
English: 197 (2.3%)
Eastern European: 186 (2.2%)
American: 140 (1.6%)
European: 137 (1.6%)
Welsh: 130 (1.5%)
Ukrainian: 124 (1.4%)
Jamaican: 113 (1.3%)
Polish: 95 (1.1%)
Greek: 76 (0.9%)
Hungarian: 66 (0.8%)
Austrian: 61 (0.7%)
Israeli: 60 (0.7%)
Scottish: 58 (0.7%)
German: 52 (0.6%)
Arab: 46 (0.5%)
Egyptian: 45 (0.5%)
Turkish: 45 (0.5%)
Ghanaian: 43 (0.5%)
Iranian: 32 (0.4%)
British: 31 (0.4%)
Nigerian: 28 (0.3%)
Lebanese: 24 (0.3%)
Brazilian: 20 (0.2%)
Romanian: 17 (0.2%)
African: 17 (0.2%)
Portuguese: 16 (0.2%)
Czech: 15 (0.2%)
Scotch-Irish: 13 (0.2%)
Lithuanian: 12 (0.1%)
Scandinavian: 11 (0.1%)
Afghan: 11 (0.1%)
French Canadian: 10 (0.1%)
Slovak: 10 (0.1%)
Iraqi: 8 (0.09%)
Czechoslovakian: 8 (0.09%)
Syrian: 7 (0.08%)
Danish: 7 (0.08%)
Moroccan: 6 (0.07%) Most common places of birth for foreign-born residents (%): China, excluding Hong Kong and Taiwan Highland Park:
19.9% (1,107)New Jersey:
3.7% (78,969)
India Highland Park:
12.6% (700)New Jersey:
12.8% (274,609)
Peru Highland Park:
7.1% (394)New Jersey:
2.7% (58,563)
Philippines Highland Park:
6.2% (343)New Jersey:
4.0% (85,934)
Mexico Highland Park:
4.8% (267)New Jersey:
4.8% (102,527)
Dominican Republic Highland Park:
4.1% (226)New Jersey:
9.7% (209,055)
United Kingdom, excluding England and Scotland Highland Park:
3.8% (210)New Jersey:
0.6% (12,793)
Korea Highland Park:
3.5% (194)New Jersey:
3.3% (70,512)
Canada Highland Park:
2.9% (161)New Jersey:
0.9% (18,317)
Ukraine Highland Park:
2.2% (122)New Jersey:
1.1% (22,760)
Pakistan Highland Park:
1.8% (102)New Jersey:
1.3% (27,580)
Bangladesh Highland Park:
1.7% (97)New Jersey:
0.7% (14,405)
El Salvador Highland Park:
1.6% (88)New Jersey:
2.3% (48,885)
Russia Highland Park:
1.5% (84)New Jersey:
0.9% (20,371)
Place of birth for U.S.-born residents:
This state: 4,975Other state: 4,186Northeast: 2,608Midwest: 483South: 668West: 424 84.6% of Highland Park residents lived in the same house 1 years ago.
Out of people who lived in different houses, 37.4% lived in this county.
Out of people who lived in different counties, 40.2% lived in New Jersey.
Highland Park:
84.6%State average:
90.4%
Education attainment for males 25 years and older:
No schooling: 32Nursery to 4th grade: 05th and 6th grade: 67th and 8th grade: 509th grade: 010th grade: 4311th grade: 012th grade, no diploma: 29High school graduate (or equivalency): 530Less than 1 year of college: 203Some college more than 1 year, no degree: 236Associate degree: 338Bachelor's degree: 1,776Master's degree: 1,151Professional school degree: 404Doctorate degree: 614
Education attainment for females 25 years and older:
No schooling: 14Nursery to 4th grade: 415th and 6th grade: 77th and 8th grade: 729th grade: 6110th grade: 2011th grade: 012th grade, no diploma: 40High school graduate (or equivalency): 668Less than 1 year of college: 117Some college more than 1 year, no degree: 334Associate degree: 399Bachelor's degree: 1,423Master's degree: 1,475Professional school degree: 289Doctorate degree: 555
Housing units in structures:
One, detached: 2,214One, attached: 530Two: 6073 or 4: 1,3355 to 9: 53210 to 19: 46920 to 49: 71650 or more: 590Housing units lacking complete plumbing facilities in 2022: 0.2%Housing units lacking complete kitchen facilities in 2022: 3.5%House/condo owner moved in on average 13 years ago
Renter moved in on average 2 years ago
Private vs. public school enrollment:
Students in private schools in grades 1 to 8 (elementary and middle school): 261 Here:
21.1%New Jersey:
12.3%
Students in private schools in grades 9 to 12 (high school): 112 Here:
17.7%New Jersey:
13.1%
Students in private undergraduate colleges: 404 Here:
33.8%New Jersey:
33.2%