High Point, NC (North Carolina) Houses and Residents
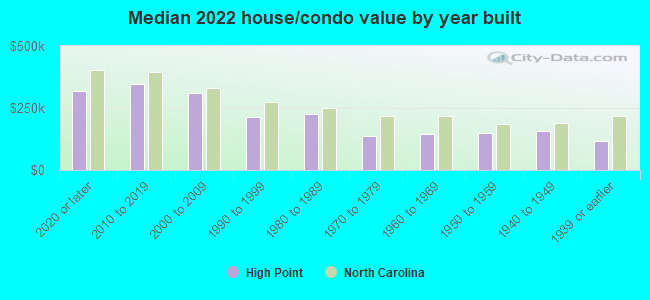
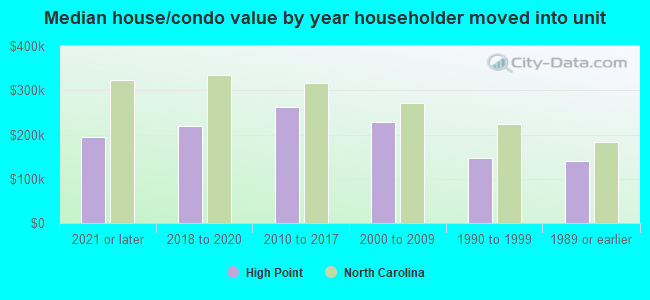
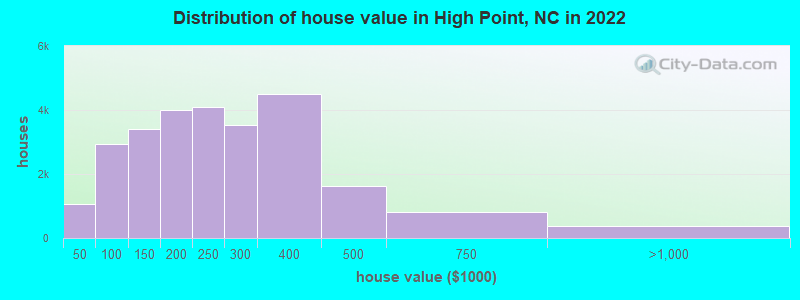
Estimated median house or condo value in 2022: $212,100 (it was $101,800 in 2000 )
High Point:
$212,100North Carolina:
$280,600
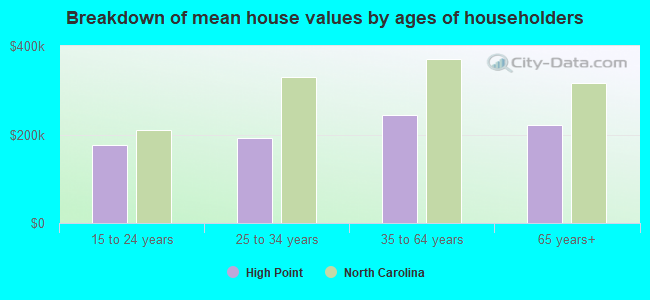
Lower value quartile - upper value quartile: $132,200 - $335,000Mean price in 2022: Detached houses: $264,609 Here:
$264,609State:
$375,326
Townhouses or other attached units: $263,422 Here:
$263,422State:
$317,935
In 2-unit structures: $88,178 Here:
$88,178State:
$250,488
In 3-to-4-unit structures: $135,779 Here:
$135,779State:
$254,939
In 5-or-more-unit structures: $192,587 Here:
$192,587State:
$329,290
Mobile homes: $97,644 Here:
$97,644State:
$124,933
Total population: 108,629 (Urban population: 85,230, Rural population: 719 (all nonfarm) )
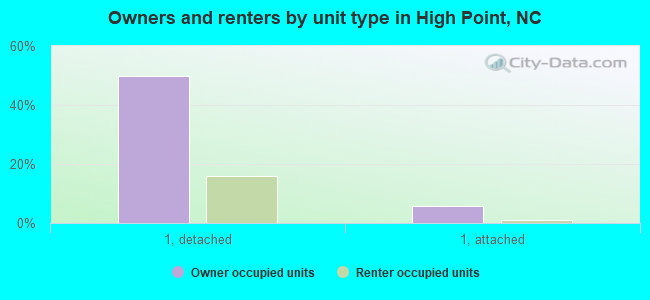
Houses: 48,438 (45,906 occupied: 27,237 owner occupied, 18,669 renter occupied )
% of renters here:
41%State:
33%
Housing density: 988 houses/condos per square mile
Median price asked for vacant for-sale houses and condos in 2022: $96,895.
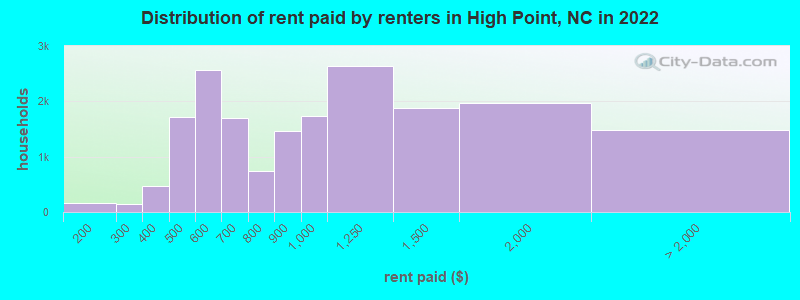
Median contract rent in 2022: $903 (lower quartile is $570, upper quartile is $1,274)
Median rent asked for vacant for-rent units in 2022: $346
Median gross rent in High Point, NC in 2022: $1,116
Housing units in High Point with a mortgage: 17,956 (1,659 second mortgage, 0 home equity loan, 1,494 both second mortgage and home equity loan )Houses without a mortgage: 438
Median household income for houses/condos with a mortgage: $86,228
Median household income for apartments without a mortgage: $59,889
Median monthly housing costs: $1,063
Data:
Median house or condo value ($)
Median house or condo value ($ change since 2000)
Median house or condo value ($) - White
Median house or condo value ($) - Black or African American
Median house or condo value ($) - Asian
Median house or condo value ($) - Hispanic or Latino
Median house or condo value ($) - American Indian and Alaska Native
Median house or condo value ($) - Multirace
Median house or condo value ($) - Other Race
Median price asked for mobile homes ($)
Household density (households per square mile)
Mean house or condo value by units in structure - 1, detached ($)
Mean house or condo value by units in structure - 1, attached ($)
Mean house or condo value by units in structure - 2 ($)
Mean house or condo value by units in structure by units in structure - 3 or 4 ($)
Mean house or condo value by units in structure - 5 or more ($)
Mean house or condo value by units in structure - Boat, RV, van, etc. ($)
Mean house or condo value by units in structure - Mobile home ($)
Median contract rent ($)
Median contract rent - Lower quartile ($)
Median contract rent - Upper quartile ($)
Median gross rent ($)
Urban houses (%)
Rural houses (%)
Houses occupied (%)
Houses occupied (% change since 2000)
Houses owner occupied (%)
Houses owner occupied (% change since 2000)
Houses renter occupied (%)
Houses renter occupied (% change since 2000)
Vacant housing units - For rent (%)
Vacant housing units - For rent (% change since 2000)
Vacant housing units - For sale only (%)
Vacant housing units - For sale only (% change since 2000)
Vacant housing units - Rented or sold, not occupied (%)
Vacant housing units - Rented or sold, not occupied (% change since 2000)
Vacant housing units - For seasonal, recreational, or occasional use (%)
Vacant housing units - For seasonal, recreational, or occasional use (% change since 2000)
Vacant housing units - For migrant workers (%)
Vacant housing units - For migrant workers (% change since 2000)
Vacant housing units - Other vacant (%)
Vacant housing units - Other vacant (% change since 2000)
Median monthly housing costs ($)
Median household income for houses/condos with a mortgage ($)
Median household income for houses/condos without a mortgage ($)
Median household income ($)
Median household income ($) - White
Median household income ($) - Black or African American
Median household income ($) - Asian
Median household income ($) - Hispanic or Latino
Median household income ($) - American Indian and Alaska Native
Median household income ($) - Multirace
Median household income ($) - Other Race
Mortgage status - with mortgage (%)
Mortgage status - with second mortgage (%)
Mortgage status - with home equity loan (%)
Mortgage status - with both second mortgage and home equity loan (%)
Mortgage status - without a mortgage (%)
Median year house/condo built
Median year apartment built
Household type by relationship - Male householder living alone (%)
Household type by relationship - Male householder not living alone (%)
Household type by relationship - Female householder living alone (%)
Household type by relationship - Female householder not living alone (%)
Household type by relationship - Opposite-Sex spouse (%)
Household type by relationship - Same-Sex spouse (%)
Household type by relationship - Opposite-Sex unmarried partner (%)
Household type by relationship - Same-Sex unmarried partner (%)
Household type by relationship - In group quarters (%)
Size of family households - 2-person household (%)
Size of family households - 3-person household (%)
Size of family households - 4-person household (%)
Size of family households - 5-person household (%)
Size of family households - 6-person household (%)
Size of family households - 7-or-more-person household (%)
Size of nonfamily households - 1-person household (%)
Size of nonfamily households - 2-person household (%)
Size of nonfamily households - 3-person household (%)
Size of nonfamily households - 4-person household (%)
Size of nonfamily households - 5-person household (%)
Size of nonfamily households - 6-person household (%)
Size of nonfamily households - 7-or-moreperson household (%)
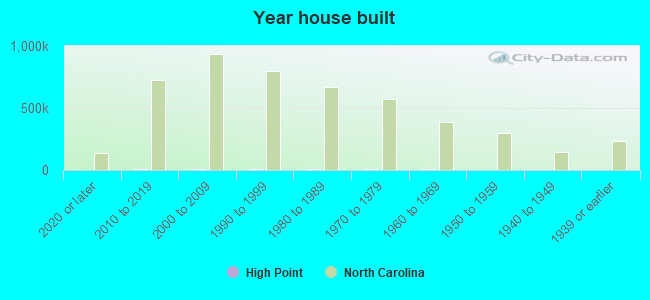
Year house built - Built 2010 or later (%)
Year house built - Built 2000 to 2009 (%)
Year house built - Built 1990 to 1999 (%)
Year house built - Built 1980 to 1989 (%)
Year house built - Built 1970 to 1979 (%)
Year house built - Built 1960 to 1969 (%)
Year house built - Built 1950 to 1959 (%)
Year house built - Built 1940 to 1949 (%)
Year house built - Built 1939 or earlier (%)
Median number of rooms in houses and condos
Median number of rooms in apartments
Median number of bedrooms in owner occupied houses
Mean number of bedrooms in owner occupied houses
Median number of bedrooms in renter occupied houses
Mean number of bedrooms in renter occupied houses
Median number of vehichles in owner occupied houses
Mean number of vehichles in owner occupied houses
Median number of vehichles in renter occupied houses
Mean number of vehichles in renter occupied houses
Rooms in owner-occupied houses - 1 room (%)
Rooms in owner-occupied houses - 2 rooms (%)
Rooms in owner-occupied houses - 3 rooms (%)
Rooms in owner-occupied houses - 4 rooms (%)
Rooms in owner-occupied houses - 5 rooms (%)
Rooms in owner-occupied houses - 6 rooms (%)
Rooms in owner-occupied houses - 7 rooms (%)
Rooms in owner-occupied houses - 8 rooms (%)
Rooms in owner-occupied houses - 9+ rooms (%)
Rooms in renter-occupied houses - 1 room (%)
Rooms in renter-occupied houses - 2 rooms (%)
Rooms in renter-occupied houses - 3 rooms (%)
Rooms in renter-occupied houses - 4 rooms (%)
Rooms in renter-occupied houses - 5 rooms (%)
Rooms in renter-occupied houses - 6 rooms (%)
Rooms in renter-occupied houses - 7 rooms (%)
Rooms in renter-occupied houses - 8 rooms (%)
Rooms in renter-occupied houses - 9+ rooms (%)
Bedrooms in owner-occupied houses - no bedrooms (%)
Bedrooms in owner-occupied houses - 1 bedroom (%)
Bedrooms in owner-occupied houses - 2 bedrooms (%)
Bedrooms in owner-occupied houses - 3 bedrooms (%)
Bedrooms in owner-occupied houses - 4 bedrooms (%)
Bedrooms in owner-occupied houses - 5+ bedrooms (%)
Bedrooms in renter-occupied houses - no bedrooms (%)
Bedrooms in renter-occupied houses - 1 bedroom (%)
Bedrooms in renter-occupied houses - 2 bedrooms (%)
Bedrooms in renter-occupied houses - 3 bedrooms (%)
Bedrooms in renter-occupied houses - 4 bedrooms (%)
Bedrooms in renter-occupied houses - 5+ bedrooms (%)
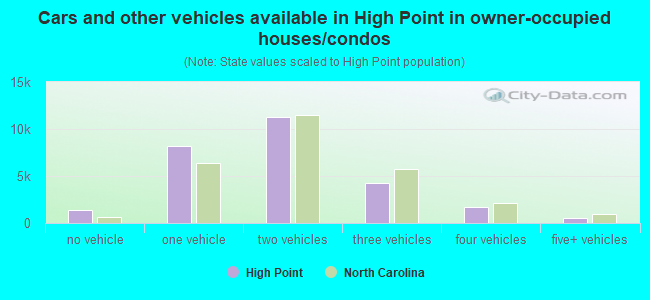
Vehicles available in owner-occupied houses - no vehicle available (%)
Vehicles available in owner-occupied houses - 1 vehicle available(%)
Vehicles available in owner-occupied houses - 2 Vehicles available (%)
Vehicles available in owner-occupied houses - 3 Vehicles available (%)
Vehicles available in owner-occupied houses - 4 Vehicles available (%)
Vehicles available in owner-occupied houses - 5+ Vehicles available (%)
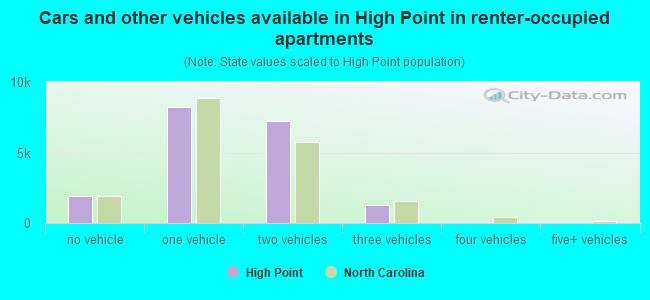
Vehicles available in renter-occupied houses - no vehicle available (%)
Vehicles available in renter-occupied houses - 1 vehicle available (%)
Vehicles available in renter-occupied houses - 2 Vehicles available (%)
Vehicles available in renter-occupied houses - 3 Vehicles available (%)
Vehicles available in renter-occupied houses - 4 Vehicles available (%)
Vehicles available in renter-occupied houses - 5+ Vehicles available (%)
Housing units in structures - 1, detached (%)
Housing units in structures - 1, attached (%)
Housing units in structures - 2 (%)
Housing units in structures - 3 or 4 (%)
Housing units in structures - 5 to 9 (%)
Housing units in structures - 10 to 19 (%)
Housing units in structures - 20 to 49 (%)
Housing units in structures - 50 or more (%)
Housing units in structures - Mobile home (%)
Housing units in structures - Boat, RV, van, etc. (%)
Housing units in structures - Owners - 1, detached (%)
Housing units in structures - Owners - 1, attached (%)
Housing units in structures - Owners - 2 (%)
Housing units in structures - Owners - 3 or 4 (%)
Housing units in structures - Owners - 5 to 9 (%)
Housing units in structures - Owners - 10 to 19 (%)
Housing units in structures - Owners - 20 to 49 (%)
Housing units in structures - Owners - 50 or more (%)
Housing units in structures - Owners - Mobile home (%)
Housing units in structures - Owners - Boat, RV, van, etc. (%)
Housing units in structures - Renters - 1, detached (%)
Housing units in structures - Renters - 1, attached (%)
Housing units in structures - Renters - 2 (%)
Housing units in structures - Renters - 3 or 4 (%)
Housing units in structures - Renters - 5 to 9 (%)
Housing units in structures - Renters - 10 to 19 (%)
Housing units in structures - Renters - 20 to 49 (%)
Housing units in structures - Renters - 50 or more (%)
Housing units in structures - Renters - Mobile home (%)
Housing units in structures - Renters - Boat, RV, van, etc. (%)
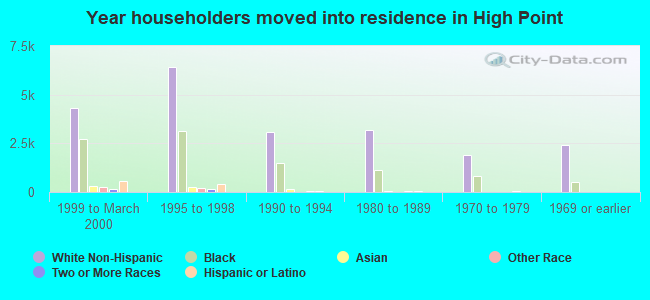
House/condo owner moved in on average (years ago)
Renter moved in on average (years ago)
Year householder moved into unit - Moved in 1999 to March 2000 (%)
Year householder moved into unit - Moved in 1999 to March 2000 (%) - White
Year householder moved into unit - Moved in 1999 to March 2000 (%) - Black or African American
Year householder moved into unit - Moved in 1999 to March 2000 (%) - Asian
Year householder moved into unit - Moved in 1999 to March 2000 (%) - Hispanic or Latino
Year householder moved into unit - Moved in 1999 to March 2000 (%) - American Indian and Alaska Native
Year householder moved into unit - Moved in 1999 to March 2000 (%) - Multirace
Year householder moved into unit - Moved in 1999 to March 2000 (%) - Other Race
Year householder moved into unit - Moved in 1995 to 1998 (%)
Year householder moved into unit - Moved in 1995 to 1998 (%) - White
Year householder moved into unit - Moved in 1995 to 1998 (%) - Black or African American
Year householder moved into unit - Moved in 1995 to 1998 (%) - Asian
Year householder moved into unit - Moved in 1995 to 1998 (%) - Hispanic or Latino
Year householder moved into unit - Moved in 1995 to 1998 (%) - American Indian and Alaska Native
Year householder moved into unit - Moved in 1995 to 1998 (%) - Multirace
Year householder moved into unit - Moved in 1995 to 1998 (%) - Other Race
Year householder moved into unit - Moved in 1990 to 1994 (%)
Year householder moved into unit - Moved in 1990 to 1994 (%) - White
Year householder moved into unit - Moved in 1990 to 1994 (%) - Black or African American
Year householder moved into unit - Moved in 1990 to 1994 (%) - Asian
Year householder moved into unit - Moved in 1990 to 1994 (%) - Hispanic or Latino
Year householder moved into unit - Moved in 1990 to 1994 (%) - American Indian and Alaska Native
Year householder moved into unit - Moved in 1990 to 1994 (%) - Multirace
Year householder moved into unit - Moved in 1990 to 1994 (%) - Other Race
Year householder moved into unit - Moved in 1980 to 1989 (%)
Year householder moved into unit - Moved in 1980 to 1989 (%) - White
Year householder moved into unit - Moved in 1980 to 1989 (%) - Black or African American
Year householder moved into unit - Moved in 1980 to 1989 (%) - Asian
Year householder moved into unit - Moved in 1980 to 1989 (%) - Hispanic or Latino
Year householder moved into unit - Moved in 1980 to 1989 (%) - American Indian and Alaska Native
Year householder moved into unit - Moved in 1980 to 1989 (%) - Multirace
Year householder moved into unit - Moved in 1980 to 1989 (%) - Other Race
Year householder moved into unit - Moved in 1970 to 1979 (%)
Year householder moved into unit - Moved in 1970 to 1979 (%) - White
Year householder moved into unit - Moved in 1970 to 1979 (%) - Black or African American
Year householder moved into unit - Moved in 1970 to 1979 (%) - Asian
Year householder moved into unit - Moved in 1970 to 1979 (%) - Hispanic or Latino
Year householder moved into unit - Moved in 1970 to 1979 (%) - American Indian and Alaska Native
Year householder moved into unit - Moved in 1970 to 1979 (%) - Multirace
Year householder moved into unit - Moved in 1970 to 1979 (%) - Other Race
Year householder moved into unit - Moved in 1969 or earlier (%)
Year householder moved into unit - Moved in 1969 or earlier (%) - White
Year householder moved into unit - Moved in 1969 or earlier (%) - Black or African American
Year householder moved into unit - Moved in 1969 or earlier (%) - Asian
Year householder moved into unit - Moved in 1969 or earlier (%) - Hispanic or Latino
Year householder moved into unit - Moved in 1969 or earlier (%) - American Indian and Alaska Native
Year householder moved into unit - Moved in 1969 or earlier (%) - Multirace
Year householder moved into unit - Moved in 1969 or earlier (%) - Other Race
Housing units lacking complete plumbing facilities (%)
Housing units lacking complete kitchen facilities (%)
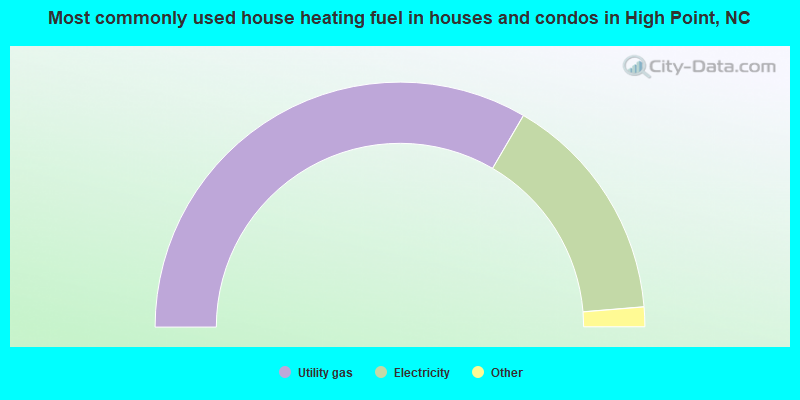
House heating fuel used in houses and condos - Utility gas (%)
House heating fuel used in houses and condos - Bottled, tank, or LP gas (%)
House heating fuel used in houses and condos - Electricity (%)
House heating fuel used in houses and condos - Fuel oil, kerosene, etc. (%)
House heating fuel used in houses and condos - Coal or coke (%)
House heating fuel used in houses and condos - Wood (%)
House heating fuel used in houses and condos - Solar energy (%)
House heating fuel used in houses and condos - Other fuel (%)
House heating fuel used in houses and condos - No fuel used (%)
House heating fuel used in apartments - Utility gas (%)
House heating fuel used in apartments - Bottled, tank, or LP gas (%)
House heating fuel used in apartments - Electricity (%)
House heating fuel used in apartments - Fuel oil, kerosene, etc. (%)
House heating fuel used in apartments - Coal or coke (%)
House heating fuel used in apartments - Wood (%)
House heating fuel used in apartments - Solar energy (%)
House heating fuel used in apartments - Other fuel (%)
House heating fuel used in apartments - No fuel used (%)
Median year house/condo built: 1990Median year apartment built: 1988Household type by relationship:
Households: 114,339
Male householders: 20,532 (4,558 living alone ), Female householders: 25,374 (10,429 living alone )20,519 spouses (19,626 opposite-sex spouses ), 3,159 unmarried partners , (2,951 opposite-sex unmarried partners ), 27,815 children (26,208 natural , 533 adopted , 1,074 stepchildren ), 2,507 grandchildren , 1,478 brothers or sisters , 916 parents , 0 foster children , 1,685 other relatives , 1,578 non-relatives In group quarters: 8,776
Size of family households: 12,133 2-persons , 6,611 3-persons , 5,724 4-persons , 1,538 5-persons , 1,110 6-persons , 642 7-or-more-persons .
Size of nonfamily households: 14,987 1-person , 2,914 2-persons , 50 3-persons , 197 4-persons .
13,728 married couples with children. single-parent households (1,302 men , 5,706 women ).
79.5% of residents of High Point speak English at home. of residents speak Spanish at home (58% speak English very well , 21% speak English well , 14% speak English not well , 7% don't speak English at all ).of residents speak other Indo-European language at home (69% speak English very well , 21% speak English well , 9% speak English not well , 1% don't speak English at all ).of residents speak Asian or Pacific Island language at home (57% speak English very well , 15% speak English well , 23% speak English not well , 4% don't speak English at all ).of residents speak other language at home (50% speak English very well , 24% speak English well , 23% speak English not well , 3% don't speak English at all ).
Foreign born population: 15,382 (13.5%)of them are naturalized citizens )
Median number of rooms in houses and condos:
Median number of rooms in apartments
Owner-occupied Renter-occupied
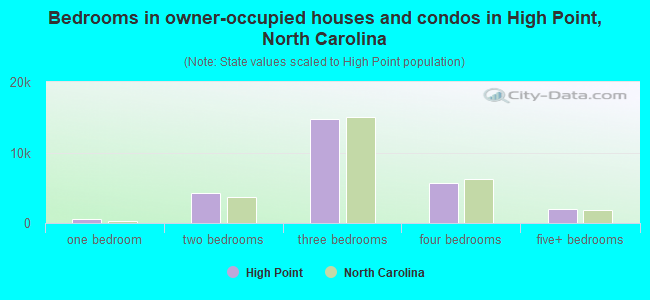
Bedrooms in owner-occupied houses and condos in High Point, North Carolina
33 no bedroom 501 1 bedroom 4,255 2 bedrooms 14,717 3 bedrooms 5,714 4 bedrooms 2,017 5+ bedrooms
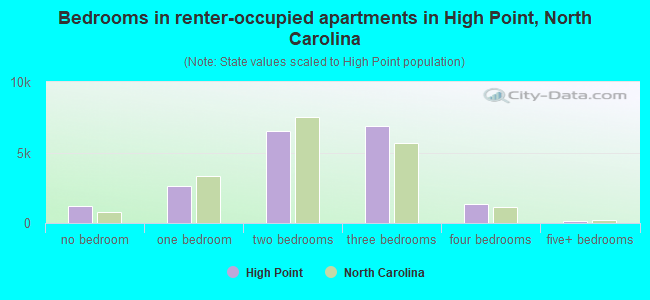
Bedrooms in renter-occupied apartments in High Point, North Carolina
1,212 no bedroom 2,621 1 bedroom 6,526 2 bedrooms 6,883 3 bedrooms 1,317 4 bedrooms 110 5+ bedrooms
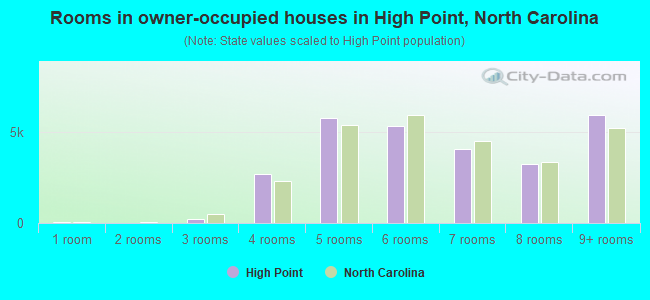
Owner-occupied Renter-occupied
Rooms in owner-occupied houses in High Point, North Carolina
33 1 room 0 2 rooms 213 3 rooms 2,677 4 rooms 5,743 5 rooms 5,346 6 rooms 4,052 7 rooms 3,245 8 rooms 5,928 9+ rooms
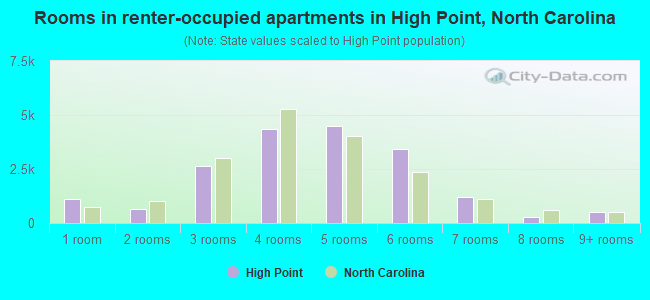
Rooms in renter-occupied apartments in High Point, North Carolina
1,121 1 room 671 2 rooms 2,641 3 rooms 4,353 4 rooms 4,511 5 rooms 3,407 6 rooms 1,195 7 rooms 282 8 rooms 488 9+ rooms
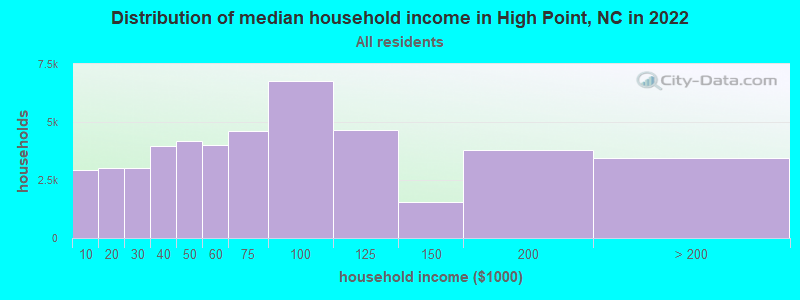
High Point, NC household income distribution 2,917 Less than $10,0003,012 $10,000 to $19,9993,018 $20,000 to $29,9993,958 $30,000 to $39,9994,200 $40,000 to $49,9994,007 $50,000 to $59,9994,602 $60,000 to $74,9996,767 $75,000 to $99,9994,638 $100,000 to $124,9991,539 $125,000 to $149,9993,799 $150,000 to $199,9993,449 $200,000 or more
Home value of owner - occupied houses in 2022 in High Point, NC 237 Less than $10,000106 $10,000 to $14,999121 $15,000 to $19,99979 $20,000 to $24,99971 $25,000 to $29,99986 $30,000 to $34,99964 $35,000 to $39,999305 $40,000 to $49,999241 $50,000 to $59,999396 $60,000 to $69,999450 $70,000 to $79,999906 $80,000 to $89,999650 $90,000 to $99,9991,757 $100,000 to $124,9991,656 $125,000 to $149,9992,287 $150,000 to $174,9991,719 $175,000 to $199,9994,094 $200,000 to $249,9993,543 $250,000 to $299,9994,503 $300,000 to $399,9991,631 $400,000 to $499,999824 $500,000 to $749,999313 $750,000 to $999,99952 $1,000,000 to $1,499,99912 $2,000,000 or moreRent paid by renters in 2022 in High Point, NC 65 $100 to $149101 $150 to $19918 $200 to $249119 $250 to $299267 $300 to $349211 $350 to $3991,009 $400 to $449702 $450 to $4991,649 $500 to $549922 $550 to $599637 $600 to $6491,056 $650 to $699613 $700 to $749131 $750 to $7991,459 $800 to $8991,733 $900 to $9992,640 $1,000 to $1,2491,883 $1,250 to $1,4991,973 $1,500 to $1,999531 $2,000 to $2,499300 $3,500 or more650 No cash rent
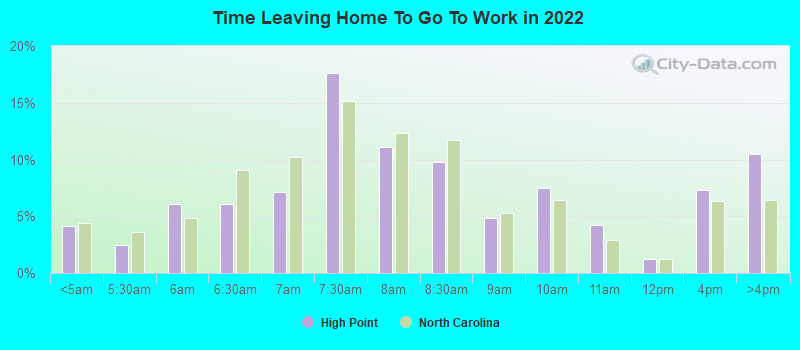
Percentage of workers working in this county: 76.4%Number of people working at home: 5,759 (10.9% of all workers )
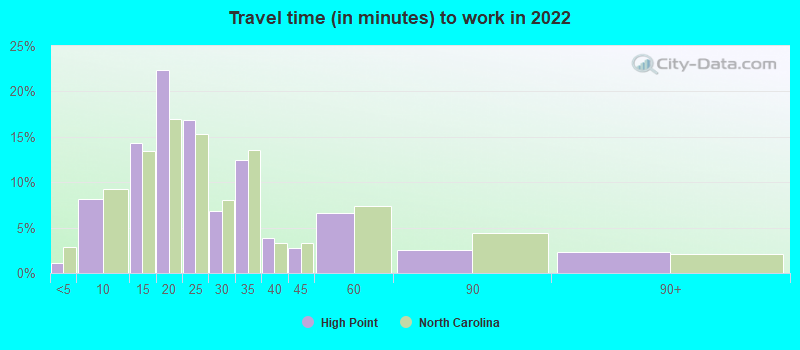
Travel time to work (commute)
Less than 5 minutes: 6015 to 9 minutes: 5,64010 to 14 minutes: 8,64515 to 19 minutes: 8,98420 to 24 minutes: 6,49325 to 29 minutes: 4,46230 to 34 minutes: 5,64435 to 39 minutes: 2,68440 to 44 minutes: 42145 to 59 minutes: 88560 to 89 minutes: 48690 or more minutes: 1,975
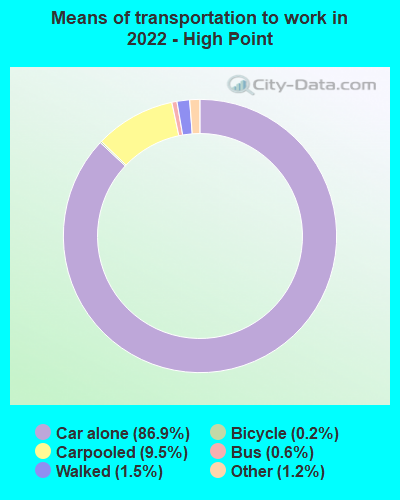
Means of transportation to work:
Drove a car alone: 49,406 (78.9%)Carpooled: 5,362 (8.6%)Bus : 245 (0.4%)Subway or elevated rail : 20 (0.0%)Long-distance train or commuter rail : 9 (0.0%)Taxi: 840 (1.3%)Bicycle: 148 (0.2%)Walked: 726 (1.2%)Worked at home: 5,759 (9.2%)
Unemployment by race in 2022
Unemployment rate for White non-Hispanic residents 3.8% Males4.2% FemalesUnemployment rate for Black residents 6.1% Males6.2% FemalesUnemployment rate for American Indian and Alaska Native residents 8.6% FemalesUnemployment rate for Asian residents 6.7% Males8.3% FemalesUnemployment rate for other race residents 4.1% Males6.1% FemalesUnemployment rate for two or more race residents 7.9% Males6.1% FemalesUnemployment rate for Hispanic or Latino residents 3.5% Males5.5% Females
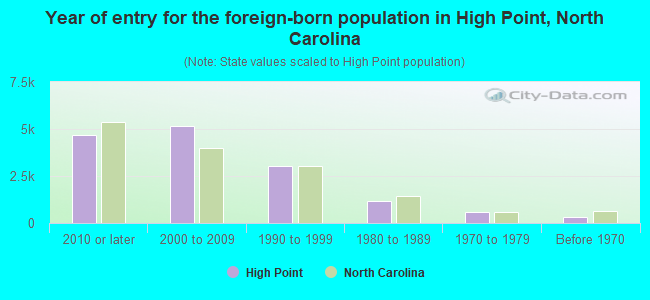
Year of entry for the foreign-born population in High Point, North Carolina
4,656 2010 or later 5,181 2000 to 2009 3,033 1990 to 1999 1,181 1980 to 1989 597 1970 to 1979 337 Before 1970
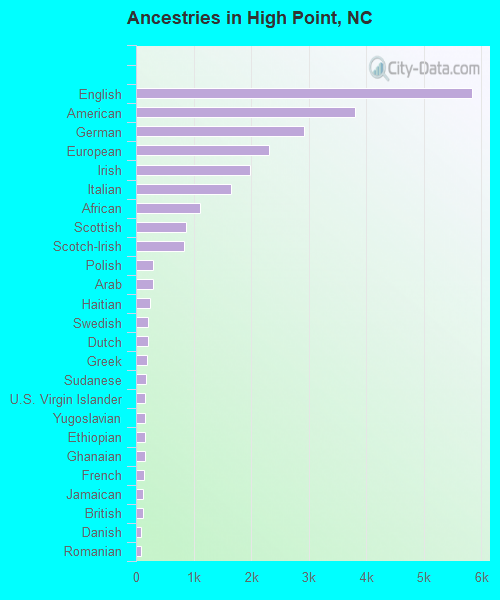
First ancestries reported:
English: 5,839 (8.5%)
American: 3,807 (5.5%)
German: 2,917 (4.2%)
European: 2,316 (3.4%)
Irish: 1,976 (2.9%)
Italian: 1,653 (2.4%)
African: 1,118 (1.6%)
Scottish: 869 (1.3%)
Scotch-Irish: 838 (1.2%)
Polish: 297 (0.4%)
Arab: 290 (0.4%)
Haitian: 239 (0.3%)
Swedish: 212 (0.3%)
Dutch: 209 (0.3%)
Greek: 192 (0.3%)
Sudanese: 174 (0.3%)
U.S. Virgin Islander: 162 (0.2%)
Yugoslavian: 160 (0.2%)
Ethiopian: 158 (0.2%)
Ghanaian: 152 (0.2%)
French: 139 (0.2%)
Jamaican: 128 (0.2%)
British: 117 (0.2%)
Danish: 92 (0.1%)
Romanian: 84 (0.1%)
Trinidadian and Tobagonian: 82 (0.1%)
Slovak: 76 (0.1%)
French Canadian: 71 (0.1%)
Egyptian: 67 (0.10%)
Hungarian: 66 (0.10%)
Welsh: 63 (0.09%)
Moroccan: 62 (0.09%)
Eastern European: 56 (0.08%)
Brazilian: 51 (0.07%)
Turkish: 49 (0.07%)
Liberian: 49 (0.07%)
Russian: 47 (0.07%)
Iraqi: 44 (0.06%)
Northern European: 43 (0.06%)
Portuguese: 43 (0.06%)
Scandinavian: 39 (0.06%)
Norwegian: 35 (0.05%)
Lebanese: 35 (0.05%)
West Indian: 35 (0.05%)
British West Indian: 34 (0.05%)
Canadian: 32 (0.05%)
Icelander: 30 (0.04%)
Swiss: 29 (0.04%)
Bulgarian: 29 (0.04%)
Iranian: 25 (0.04%)
Albanian: 22 (0.03%)
Lithuanian: 21 (0.03%)
Austrian: 20 (0.03%)
Nigerian: 19 (0.03%)
Palestinian: 18 (0.03%)
Australian: 16 (0.02%)
Armenian: 16 (0.02%)
Afghan: 15 (0.02%)
Croatian: 12 (0.02%)
Ukrainian: 11 (0.02%)
Bermudan: 8 (0.01%)
Pennsylvania German: 7 (0.01%)
Israeli: 7 (0.01%)
Most common places of birth for foreign-born residents (%): Mexico High Point:
12.4% (1,900)North Carolina:
24.7% (214,776)
Pakistan High Point:
8.0% (1,222)North Carolina:
0.7% (6,226)
India High Point:
7.1% (1,078)North Carolina:
9.3% (80,594)
Philippines High Point:
4.3% (651)North Carolina:
2.4% (20,695)
Nepal High Point:
4.0% (612)North Carolina:
0.6% (5,372)
El Salvador High Point:
3.6% (549)North Carolina:
3.8% (33,379)
Laos High Point:
3.1% (478)North Carolina:
0.6% (4,983)
Honduras High Point:
3.1% (469)North Carolina:
4.7% (40,707)
Italy High Point:
2.8% (435)North Carolina:
0.5% (4,315)
Colombia High Point:
2.6% (399)North Carolina:
2.1% (18,275)
Korea High Point:
2.4% (369)North Carolina:
1.8% (15,988)
Thailand High Point:
2.2% (332)North Carolina:
0.7% (6,161)
Burma (Myanmar) High Point:
2.1% (324)North Carolina:
0.5% (4,516)
China, excluding Hong Kong and Taiwan High Point:
2.1% (324)North Carolina:
3.2% (27,477)
Canada High Point:
2.1% (320)North Carolina:
2.1% (18,105)
Democratic Republic of Congo (Zaire) High Point:
2.0% (308)North Carolina:
0.5% (4,046)
Vietnam High Point:
2.0% (299)North Carolina:
2.9% (24,965)
Africa, n.e.c. High Point:
1.6% (243)North Carolina:
0.5% (4,032)
Place of birth for U.S.-born residents:
This state: 56,629Other state: 40,835Northeast: 9,123Midwest: 9,013South: 20,702West: 1,997 84.8% of High Point residents lived in the same house 1 years ago.
Out of people who lived in different houses, 25.6% lived in this county.
Out of people who lived in different counties, 67.0% lived in North Carolina.
High Point:
84.8%State average:
87.3%
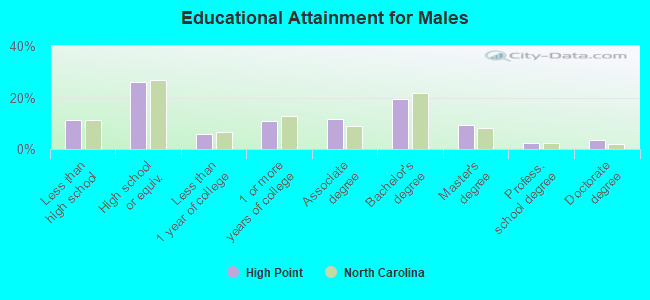
Education attainment for males 25 years and older:
No schooling: 918Nursery to 4th grade: 2325th and 6th grade: 2187th and 8th grade: 2379th grade: 46610th grade: 1,02111th grade: 16712th grade, no diploma: 588High school graduate (or equivalency): 8,914Less than 1 year of college: 1,979Some college more than 1 year, no degree: 3,687Associate degree: 3,984Bachelor's degree: 6,597Master's degree: 3,147Professional school degree: 851Doctorate degree: 1,259
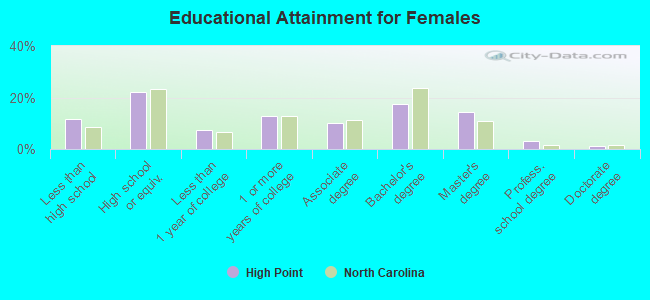
Education attainment for females 25 years and older:
No schooling: 921Nursery to 4th grade: 3725th and 6th grade: 1457th and 8th grade: 1889th grade: 79110th grade: 66811th grade: 87112th grade, no diploma: 658High school graduate (or equivalency): 8,892Less than 1 year of college: 3,049Some college more than 1 year, no degree: 5,119Associate degree: 3,989Bachelor's degree: 7,072Master's degree: 5,771Professional school degree: 1,216Doctorate degree: 537
Housing units in structures:
One, detached: 32,761One, attached: 4,393Two: 1,4173 or 4: 1,7315 to 9: 2,76410 to 19: 1,79820 to 49: 1,53750 or more: 1,811Mobile homes: 226Median worth of mobile homes: $112,600
Housing units lacking complete plumbing facilities in 2022: 1.2%Housing units lacking complete kitchen facilities in 2022: 1.3%House/condo owner moved in on average 10 years ago
Renter moved in on average 3 years ago
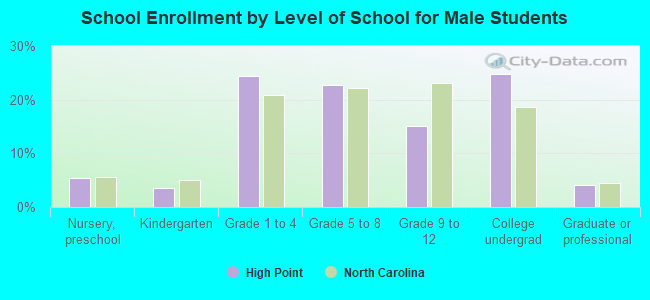
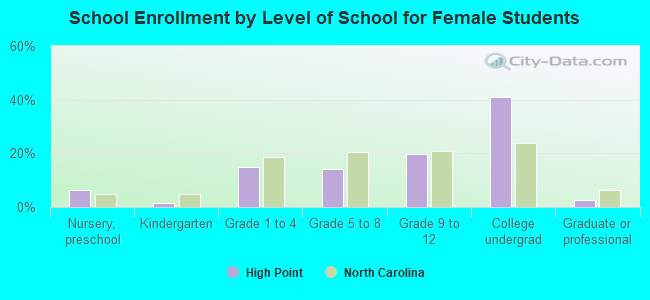
Private vs. public school enrollment:
Students in private schools in grades 1 to 8 (elementary and middle school): 2,709 Here:
21.9%North Carolina:
13.8%
Students in private schools in grades 9 to 12 (high school): 379 Here:
6.8%North Carolina:
11.9%
Students in private undergraduate colleges: 3,286 Here:
31.4%North Carolina:
19.3%