Hickory Hills, IL (Illinois) Houses and Residents
| Hickory Hills: | $277,900 |
| Illinois: | $251,600 |
Mean price in 2022:
Detached houses: $302,292
Here: $302,292 State: $310,164 Townhouses or other attached units: $200,755
Here: $200,755 State: $286,230 In 5-or-more-unit structures: $155,940
Here: $155,940 State: $318,887
Total population: 14,177 (Urban population: 13,935, Rural population: 0)
Houses: 5,613 (5,374 occupied: 3,969 owner occupied, 1,497 renter occupied)
| % of renters here: | 27% |
| State: | 33% |
Housing density: 1,980 houses/condos per square mile
Median price asked for vacant for-sale houses and condos in 2022: $188,091.
Median contract rent in 2022: $957 (lower quartile is $863, upper quartile is $1,157)
Median rent asked for vacant for-rent units in 2022: $4,819
Median gross rent in Hickory Hills, IL in 2022: $1,013
Housing units in Hickory Hills with a mortgage: 2,334 (144 second mortgage, 34 home equity loan, 90 both second mortgage and home equity loan)
Houses without a mortgage: 86
Median household income for houses/condos with a mortgage: $93,182
Median household income for apartments without a mortgage: $70,963
Median monthly housing costs: $1,211
Compare current foreclosures near Hickory Hills, IL:
| Photo | Address | Area | Beds / Baths | Price | Details |
|---|---|---|---|---|---|

|
#1
W 99th St
Hickory Hills, IL 60457
|
1,680 sq. feet
|
1 baths 3 beds |
show details | |

|
#2
S 81st Ave
Hickory Hills, IL 60457
|
1,216 sq. feet
|
1 baths 4 beds |
show details | |

|
#3
W 95th St Apt 2e
Hickory Hills, IL 60457
|
960 sq. feet
|
1 baths 1 beds |
show details | |

|
#4
Sandra Ln
Hickory Hills, IL 60457
|
1,092 sq. feet
|
1 baths - beds |
show details | |

|
#5
S 83rd Ct
Hickory Hills, IL 60457
|
1,589 sq. feet
|
2 baths - beds |
show details | |

|
#6
S 89th Ave
Hickory Hills, IL 60457
|
1,276 sq. feet
|
2 baths - beds |
show details | |

|
#7
W 87th St
Hickory Hills, IL 60457
|
2,197 sq. feet
|
2 baths - beds |
show details | |

|
#8
W 91st St
Hickory Hills, IL 60457
|
2,036 sq. feet
|
1 baths - beds |
show details | |

|
#9
S 83rd Ct
Hickory Hills, IL 60457
|
1,220 sq. feet
|
1 baths - beds |
show details | |

|
#10
S 83rd Ave
Hickory Hills, IL 60457
|
1,062 sq. feet
|
1 baths - beds |
show details |
| Photo | Address | Area | Beds / Baths | Price | Details |
|---|---|---|---|---|---|

|
#11
Kopping Ln
Hickory Hills, IL 60457
|
2,145 sq. feet
|
2 baths - beds |
show details | |

|
#12
Baldwin Trl
Hickory Hills, IL 60457
|
1,745 sq. feet
|
1 baths - beds |
show details | |

|
#13
S 76th Ct
Hickory Hills, IL 60457
|
1,376 sq. feet
|
1 baths - beds |
show details | |

|
#14
S 82nd Ave Apt 1e
Hickory Hills, IL 60457
|
- sq. feet
|
- baths - beds |
show details | |

|
#15
S 86th, Bldg 7 Apt 115
Hickory Hills, IL 60457
|
- sq. feet
|
- baths - beds |
show details | |

|
#16
S 83rd Ct
Hickory Hills, IL 60457
|
- sq. feet
|
- baths - beds |
show details | |

|
#17
S 84th Ct
Hickory Hills, IL 60457
|
- sq. feet
|
- baths - beds |
show details | |

|
#18
W 95th S 2
Hickory Hills, IL 60457
|
- sq. feet
|
- baths - beds |
show details | |

|
#19
S Roberts Rd Apt 3s
Hickory Hills, IL 60457
|
- sq. feet
|
- baths - beds |
show details | |

|
#20
W 90th St Apt 1a
Hickory Hills, IL 60457
|
- sq. feet
|
- baths - beds |
show details |
| Photo | Address | Area | Beds / Baths | Price | Details |
|---|---|---|---|---|---|

|
#21
W 95th St
Hickory Hills, IL 60457
|
- sq. feet
|
- baths - beds |
show details | |

|
#22
Forest Ln E
Hickory Hills, IL 60457
|
- sq. feet
|
- baths - beds |
show details | |

|
#23
W 89th Pl
Hickory Hills, IL 60457
|
- sq. feet
|
- baths - beds |
show details | |

|
#24
E 46th St
Chicago, IL 60653
|
2,126 sq. feet
|
2 baths 2 beds |
$289,000
|
show details |

|
#25
S Tripp Ave
Oak Lawn, IL 60453
|
1,591 sq. feet
|
1 baths 3 beds |
$212,000
|
show details |

|
#26
S Vanderpoel Ave
Chicago, IL 60643
|
2,352 sq. feet
|
2 baths 7 beds |
$115,000
|
show details |

|
#27
145th St
Midlothian, IL 60445
|
2,000 sq. feet
|
1 baths 3 beds |
$179,900
|
show details |

|
#28
W Arquilla Dr
Palos Heights, IL 60463
|
1,780 sq. feet
|
2 baths 2 beds |
$299,900
|
show details |

|
#29
N Austin Ave
Chicago, IL 60634
|
2,500 sq. feet
|
3 baths 4 beds |
$365,000
|
show details |

|
#30
176th Pl
Lansing, IL 60438
|
1,511 sq. feet
|
1 baths 2 beds |
$168,480
|
show details |
| Photo | Address | Area | Beds / Baths | Price | Details |
|---|---|---|---|---|---|

|
#31
S Yale Ave
Chicago, IL 60628
|
1,608 sq. feet
|
2 baths 3 beds |
$262,000
|
show details |

|
#32
S Normal Ave
Chicago, IL 60628
|
989 sq. feet
|
1 baths 3 beds |
$154,375
|
show details |

|
#33
S Calumet Ave
Chicago, IL 60628
|
3,690 sq. feet
|
3 baths 6 beds |
$260,000
|
show details |

|
#34
S Main St
Hometown, IL 60456
|
744 sq. feet
|
1 baths 2 beds |
$175,000
|
show details |

|
#35
Finch Ave
Harvey, IL 60426
|
1,108 sq. feet
|
2 baths 3 beds |
$225,000
|
show details |

|
#36
S South Shore Dr Apt 1201
Chicago, IL 60649
|
1,100 sq. feet
|
2 baths 2 beds |
$179,000
|
show details |

|
#37
Lincoln Ave
Dolton, IL 60419
|
1,966 sq. feet
|
2 baths 3 beds |
$69,900
|
show details |

|
#38
N Olcott Ave
Chicago, IL 60634
|
2,161 sq. feet
|
2 baths 4 beds |
$559,000
|
show details |

|
#39
W Garfield Blvd
Chicago, IL 60636
|
2,820 sq. feet
|
2 baths 5 beds |
$132,500
|
show details |

|
#40
E Crest Ave
Addison, IL 60101
|
2,023 sq. feet
|
1 baths 5 beds |
$296,100
|
show details |
| Photo | Address | Area | Beds / Baths | Price | Details |
|---|---|---|---|---|---|

|
#41
S Emerald Ave
Chicago, IL 60620
|
1,080 sq. feet
|
1 baths 2 beds |
$34,900
|
show details |

|
#42
W 107th Pl
Chicago, IL 60628
|
1,579 sq. feet
|
2 baths 6 beds |
$40,000
|
show details |

|
#43
- 24 S Kimbark Unit 105
Chicago, IL 60637
|
600 sq. feet
|
1 baths 1 beds |
$137,000
|
show details |

|
#44
S Crandon Ave # 319
Chicago, IL 60649
|
1,271 sq. feet
|
2 baths 2 beds |
$146,900
|
show details |

|
#45
W Van Buren St
Chicago, IL 60644
|
2,839 sq. feet
|
3 baths 8 beds |
$87,500
|
show details |

|
#46
W 63rd St
Chicago, IL 60638
|
1,250 sq. feet
|
2 baths 4 beds |
$385,000
|
show details |

|
#47
Whitman Ave
Hazel Crest, IL 60429
|
1,360 sq. feet
|
2 baths 2 beds |
$137,900
|
show details |

|
#48
N Bruce Ln Apt 311
Glenwood, IL 60425
|
1,000 sq. feet
|
2 baths 2 beds |
$185,000
|
show details |

|
#49
N 74th Ave
Elmwood Park, IL 60707
|
1,300 sq. feet
|
1 baths 3 beds |
$235,000
|
show details |

|
Check over 1 million property listings on Foreclosure.com!
|
browse all offers | |||


 | Need to find a family home in Chicagoland to rent (3 replies) |
| Suburbs with Cute Downtown (54 replies) |
| Suburb Danger Tiers (75 replies) |
| Oak Lawn, Midlothian, Palos [Insert Noun Here], Worth (16 replies) |
| Bugs in Chicagoland in the Summer (24 replies) |
| Could Use Advice on Where to Move (21 replies) |

Median year apartment built: 1978
Household type by relationship:
Households: 14,583- Male householders: 2,716 (612 living alone), Female householders: 2,516 (906 living alone)
2,750 spouses (2,750 opposite-sex spouses), 153 unmarried partners, (153 opposite-sex unmarried partners), 5,314 children (5,161 natural, 47 adopted, 104 stepchildren), 80 grandchildren, 177 brothers or sisters, 272 parents, 0 foster children, 261 other relatives, 256 non-relatives
- In group quarters: 84
Size of family households: 1,288 2-persons, 710 3-persons, 764 4-persons, 428 5-persons, 282 6-persons, 120 7-or-more-persons.
Size of nonfamily households: 1,631 1-person, 182 2-persons, 9 3-persons.
3,032 married couples with children.
760 single-parent households (435 men, 325 women).
45.4% of residents of Hickory Hills speak English at home.
11.6% of residents speak Spanish at home (66% speak English very well, 17% speak English well, 15% speak English not well, 1% don't speak English at all).
26.5% of residents speak other Indo-European language at home (51% speak English very well, 30% speak English well, 16% speak English not well, 2% don't speak English at all).
1.1% of residents speak Asian or Pacific Island language at home (79% speak English very well, 21% speak English not well).
15.0% of residents speak other language at home (71% speak English very well, 15% speak English well, 11% speak English not well, 3% don't speak English at all).
Foreign born population: 4,551 (31.2%)
(67.8% of them are naturalized citizens)
| Here: | 6.1 |
| State: | 6.4 |
| Here: | 3.7 |
| State: | 4.1 |

- Bedrooms in owner-occupied houses and condos in Hickory Hills, Illinois
- 11no bedroom
- 91 bedroom
- 5252 bedrooms
- 2,6213 bedrooms
- 5914 bedrooms
- 2115+ bedrooms

- Bedrooms in renter-occupied apartments in Hickory Hills, Illinois
- 32no bedroom
- 5621 bedroom
- 6822 bedrooms
- 1873 bedrooms
- 354 bedrooms
- 05+ bedrooms

- Cars and other vehicles available in Hickory Hills in owner-occupied houses/condos
- 113no vehicle
- 9041 vehicle
- 2,0372 vehicles
- 5653 vehicles
- 3024 vehicles
- 485+ vehicles

- Cars and other vehicles available in Hickory Hills in renter-occupied apartments
- 69no vehicle
- 1,0291 vehicle
- 3352 vehicles
- 643 vehicles
- 04 vehicles
- 05+ vehicles

- Rooms in owner-occupied houses in Hickory Hills, Illinois
- 111 room
- 02 rooms
- 663 rooms
- 3854 rooms
- 9465 rooms
- 9346 rooms
- 8717 rooms
- 5178 rooms
- 2399+ rooms

- Rooms in renter-occupied apartments in Hickory Hills, Illinois
- 321 room
- 922 rooms
- 4353 rooms
- 5664 rooms
- 945 rooms
- 1426 rooms
- 427 rooms
- 418 rooms
- 549+ rooms


Hickory Hills, IL household income distribution

- 244Less than $10,000
- 299$10,000 to $19,999
- 340$20,000 to $29,999
- 455$30,000 to $39,999
- 492$40,000 to $49,999
- 363$50,000 to $59,999
- 459$60,000 to $74,999
- 777$75,000 to $99,999
- 618$100,000 to $124,999
- 528$125,000 to $149,999
- 485$150,000 to $199,999
- 406$200,000 or more
Home value of owner - occupied houses in 2022 in Hickory Hills, IL
-
- 48Less than $10,000
- 14$15,000 to $19,999
- 27$20,000 to $24,999
- 34$25,000 to $29,999
- 51$70,000 to $79,999
- 38$80,000 to $89,999
- 16$90,000 to $99,999
- 64$100,000 to $124,999
- 42$125,000 to $149,999
- 203$150,000 to $174,999
- 228$175,000 to $199,999
- 680$200,000 to $249,999
- 1,110$250,000 to $299,999
- 1,019$300,000 to $399,999
- 352$400,000 to $499,999
- 88$500,000 to $749,999
- 11$2,000,000 or more
Rent paid by renters in 2022 in Hickory Hills, IL
-
- 22$250 to $299
- 9$500 to $549
- 20$600 to $649
- 16$650 to $699
- 56$700 to $749
- 70$750 to $799
- 311$800 to $899
- 414$900 to $999
- 349$1,000 to $1,249
- 56$1,250 to $1,499
- 131$1,500 to $1,999
- 50$2,000 to $2,499
- 43No cash rent


Percentage of workers working in this county: 85.1%
Number of people working at home: 621 (8.7% of all workers)
Travel time to work (commute)
- Less than 5 minutes: 183
- 5 to 9 minutes: 555
- 10 to 14 minutes: 528
- 15 to 19 minutes: 873
- 20 to 24 minutes: 1,061
- 25 to 29 minutes: 405
- 30 to 34 minutes: 798
- 35 to 39 minutes: 189
- 40 to 44 minutes: 283
- 45 to 59 minutes: 604
- 60 to 89 minutes: 721
- 90 or more minutes: 88
Means of transportation to work:
- Drove a car alone: 1,874 (60.0%)
- Carpooled: 386 (12.4%)
- Bus: 15 (0.5%)
- Long-distance train or commuter rail: 4 (0.1%)
- Taxi: 42 (1.3%)
- Bicycle: 22 (0.7%)
- Walked: 268 (8.6%)
- Worked at home: 621 (19.9%)

- Unemployment by race in 2022
- Unemployment rate for White non-Hispanic residents
- 1.5%Males
- 7.4%Females
- Unemployment rate for Asian residents
- 7.5%Females
- Unemployment rate for two or more race residents
- 5.8%Males
- 2.8%Females
- Unemployment rate for Hispanic or Latino residents
- 0.1%Males

- Year of entry for the foreign-born population in Hickory Hills, Illinois
- 9392010 or later
- 1,1172000 to 2009
- 1,3581990 to 1999
- 5761980 to 1989
- 3941970 to 1979
- 694Before 1970

First ancestries reported:
- Polish: 2,480 (28.7%)
- Palestinian: 1,088 (12.6%)
- Lithuanian: 559 (6.5%)
- American: 401 (4.6%)
- Irish: 274 (3.2%)
- Italian: 259 (3.0%)
- Arab: 172 (2.0%)
- Jordanian: 168 (1.9%)
- German: 166 (1.9%)
- Macedonian: 166 (1.9%)
- Czech: 128 (1.5%)
- Albanian: 127 (1.5%)
- English: 60 (0.7%)
- Greek: 56 (0.6%)
- Romanian: 50 (0.6%)
- Ukrainian: 45 (0.5%)
- Eastern European: 34 (0.4%)
- Swedish: 31 (0.4%)
- Egyptian: 29 (0.3%)
- Croatian: 26 (0.3%)
- French: 24 (0.3%)
- Scandinavian: 21 (0.2%)
- European: 18 (0.2%)
- Russian: 18 (0.2%)
- Serbian: 17 (0.2%)
- Dutch: 12 (0.1%)
- Slovak: 12 (0.1%)
- Scottish: 11 (0.1%)
- Danish: 5 (0.06%)
Most common places of birth for foreign-born residents (%):
| Hickory Hills: | 35.2% (1,602) |
| Illinois: | 6.9% (124,474) |
| Hickory Hills: | 15.7% (716) |
| Illinois: | 34.7% (626,958) |
| Hickory Hills: | 9.0% (410) |
| Illinois: | 0.4% (6,781) |
| Hickory Hills: | 5.9% (270) |
| Illinois: | 0.6% (10,249) |
| Hickory Hills: | 5.4% (244) |
| Illinois: | 0.5% (8,827) |
| Hickory Hills: | 4.3% (195) |
| Illinois: | 0.2% (4,211) |
| Hickory Hills: | 3.7% (170) |
| Illinois: | 0.4% (7,117) |
| Hickory Hills: | 3.0% (137) |
| Illinois: | 1.6% (29,519) |
| Hickory Hills: | 2.5% (113) |
| Illinois: | 5.2% (93,003) |
| Hickory Hills: | 1.5% (70) |
| Illinois: | 0.1% (1,047) |
Place of birth for U.S.-born residents:
- This state: 8,739
- Other state: 988
- Northeast: 254
- Midwest: 327
- South: 181
- West: 225
90.9% of Hickory Hills residents lived in the same house 1 years ago.
Out of people who lived in different houses, 48.3% lived in this county.
Out of people who lived in different counties, 50.0% lived in Illinois.
| Hickory Hills: | 90.9% |
| State average: | 88.3% |
Education attainment for males 25 years and older:
- No schooling: 202
- Nursery to 4th grade: 10
- 5th and 6th grade: 19
- 7th and 8th grade: 102
- 9th grade: 44
- 10th grade: 17
- 11th grade: 90
- 12th grade, no diploma: 285
- High school graduate (or equivalency): 1,192
- Less than 1 year of college: 379
- Some college more than 1 year, no degree: 876
- Associate degree: 659
- Bachelor's degree: 611
- Master's degree: 193
- Professional school degree: 7
- Doctorate degree: 71

Education attainment for females 25 years and older:
- No schooling: 159
- Nursery to 4th grade: 9
- 5th and 6th grade: 20
- 7th and 8th grade: 129
- 9th grade: 9
- 10th grade: 30
- 11th grade: 57
- 12th grade, no diploma: 115
- High school graduate (or equivalency): 1,328
- Less than 1 year of college: 187
- Some college more than 1 year, no degree: 631
- Associate degree: 399
- Bachelor's degree: 912
- Master's degree: 567
- Professional school degree: 81
- Doctorate degree: 23


Housing units in structures:
- One, detached: 3,485
- One, attached: 280
- Two: 79
- 3 or 4: 92
- 5 to 9: 557
- 10 to 19: 740
- 20 to 49: 321
- 50 or more: 57
Housing units lacking complete kitchen facilities in 2022: 0.8%
House/condo owner moved in on average 13 years ago
Renter moved in on average 5 years ago

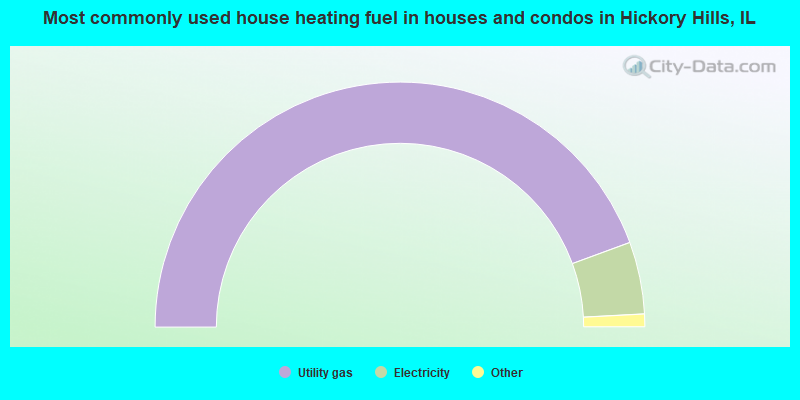
- 88.8%Utility gas
- 9.5%Electricity
- 0.7%Other fuel
- 0.6%Bottled, tank, or LP gas
- 0.3%No fuel used
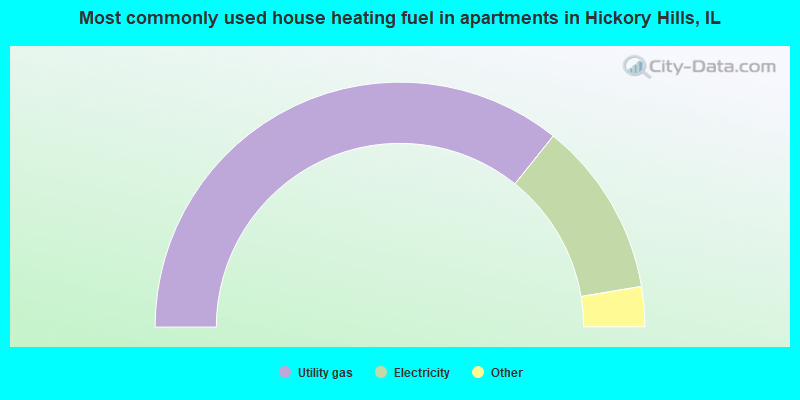
- 71.6%Utility gas
- 23.2%Electricity
- 2.7%Bottled, tank, or LP gas
- 1.8%No fuel used
- 0.8%Fuel oil, kerosene, etc.
Private vs. public school enrollment:
| Here: | 5.9% |
| Illinois: | 13.3% |
| Here: | 8.5% |
| Illinois: | 9.9% |
| Here: | 14.2% |
| Illinois: | 27.4% |


