Housing density: 1,404 houses/condos per square mile
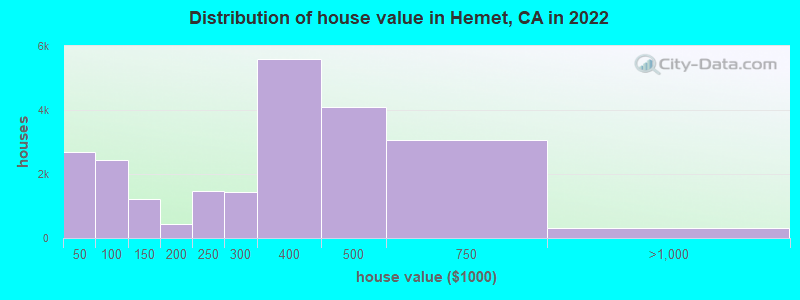
Median price asked for vacant for-sale houses and condos in 2022: $493,615.
Median contract rent in 2022: $1,237 (lower quartile is $912, upper quartile is $1,755)
Median rent asked for vacant for-rent units in 2022: $1,288
Median gross rent in Hemet, CA in 2022: $1,465
Housing units in Hemet with a mortgage: 10,588 (493 second mortgage, 37 home equity loan, 233 both second mortgage and home equity loan) Houses without a mortgage: 141
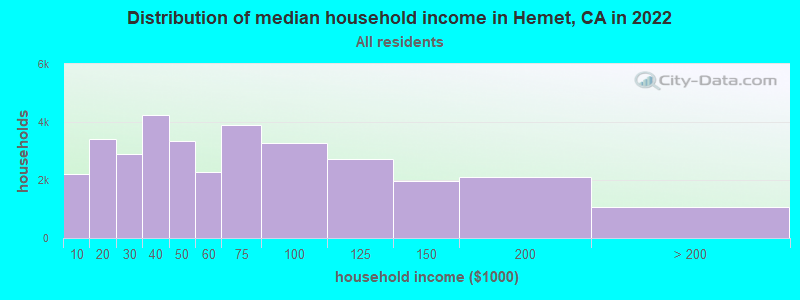
Median household income for houses/condos with a mortgage: $74,282
Median household income for apartments without a mortgage: $38,198
8,222 married couples with children.
9,409 single-parent households (2,119 men, 7,290 women).
66.0% of residents of Hemet speak English at home.
30.4% of residents speak Spanish at home (64% speak English very well, 18% speak English well, 12% speak English not well, 6% don't speak English at all).
1.0% of residents speak other Indo-European language at home (63% speak English very well, 28% speak English well, 9% speak English not well).
1.6% of residents speak Asian or Pacific Island language at home (47% speak English very well, 38% speak English well, 12% speak English not well, 2% don't speak English at all).
1.1% of residents speak other language at home (72% speak English very well, 14% speak English well, 5% speak English not well, 9% don't speak English at all).
Foreign born population: 16,920 (18.7%)
(64.3% of them are naturalized citizens)
Percentage of workers working in this county: 84.8% Number of people working at home: 3,135 (9.6% of all workers)
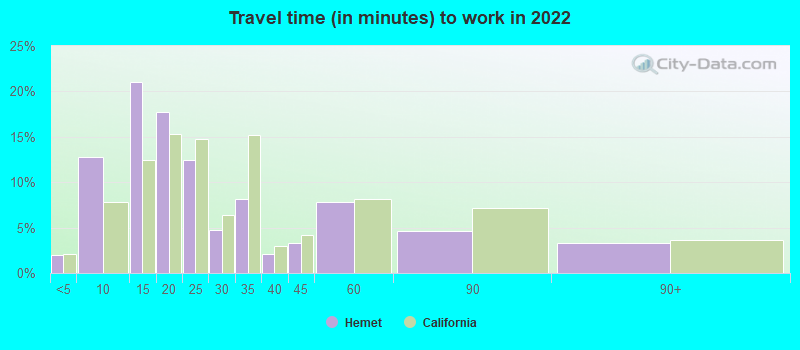
Travel time to work (commute)
Less than 5 minutes: 131
5 to 9 minutes: 2,348
10 to 14 minutes: 3,763
15 to 19 minutes: 2,433
20 to 24 minutes: 665
25 to 29 minutes: 1,268
30 to 34 minutes: 3,048
35 to 39 minutes: 443
40 to 44 minutes: 2,758
45 to 59 minutes: 4,717
60 to 89 minutes: 2,702
90 or more minutes: 2,470
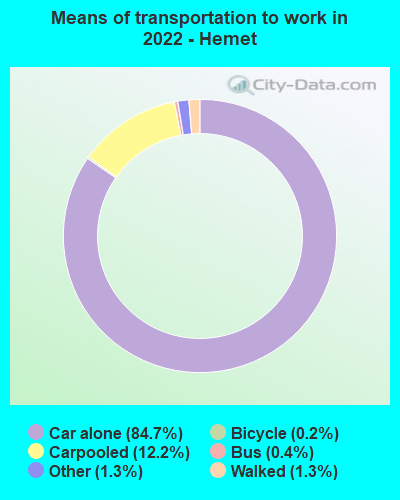
Means of transportation to work:
Drove a car alone: 18,181 (73.0%)
Carpooled: 2,834 (11.4%)
Bus: 73 (0.3%)
Taxi: 296 (1.2%)
Bicycle: 61 (0.2%)
Walked: 268 (1.1%)
Worked at home: 3,135 (12.6%)
Unemployment by race in 2022
Unemployment rate for White non-Hispanic residents
5.5%Males
5.3%Females
Unemployment rate for Black residents
4.1%Males
11.3%Females
Unemployment rate for American Indian and Alaska Native residents
8.4%Males
Unemployment rate for Asian residents
7.3%Females
Unemployment rate for other race residents
4.0%Females
Unemployment rate for two or more race residents
10.8%Males
7.1%Females
Unemployment rate for Hispanic or Latino residents
3.3%Males
6.0%Females
Year of entry for the foreign-born population in Hemet, California
2,5362010 or later
4,0282000 to 2009
3,1971990 to 1999
1,7701980 to 1989
1,2931970 to 1979
1,839Before 1970
First ancestries reported:
American: 2,443 (4.4%)
English: 2,375 (4.3%)
German: 1,840 (3.3%)
Irish: 1,410 (2.5%)
Italian: 1,130 (2.0%)
European: 571 (1.0%)
Scottish: 556 (1.0%)
Norwegian: 477 (0.9%)
Eastern European: 316 (0.6%)
Egyptian: 296 (0.5%)
Swedish: 272 (0.5%)
African: 225 (0.4%)
Danish: 213 (0.4%)
Polish: 198 (0.4%)
Scotch-Irish: 181 (0.3%)
Romanian: 157 (0.3%)
Hungarian: 136 (0.2%)
French: 117 (0.2%)
British: 108 (0.2%)
French Canadian: 100 (0.2%)
Czech: 87 (0.2%)
Dutch: 86 (0.2%)
Portuguese: 85 (0.2%)
Liberian: 85 (0.2%)
Canadian: 64 (0.1%)
Welsh: 64 (0.1%)
Russian: 63 (0.1%)
Serbian: 62 (0.1%)
Scandinavian: 53 (0.10%)
Palestinian: 49 (0.09%)
Swiss: 44 (0.08%)
Ukrainian: 42 (0.08%)
Pennsylvania German: 38 (0.07%)
Armenian: 34 (0.06%)
Iranian: 33 (0.06%)
Belizean: 32 (0.06%)
Greek: 26 (0.05%)
Lebanese: 25 (0.04%)
Austrian: 23 (0.04%)
British West Indian: 23 (0.04%)
Bulgarian: 20 (0.04%)
Iraqi: 12 (0.02%)
Czechoslovakian: 12 (0.02%)
Brazilian: 12 (0.02%)
Australian: 10 (0.02%)
Slavic: 10 (0.02%)
Finnish: 5 (0.01%)
Turkish: 5 (0.01%)
Basque: 4 (0.01%)
Afghan: 3 (0.01%)
Most common places of birth for foreign-born residents (%):
Mexico
Hemet:
64.5% (11,155)
California:
37.2% (3,881,193)
Philippines
Hemet:
5.6% (968)
California:
7.8% (818,297)
El Salvador
Hemet:
2.6% (450)
California:
4.2% (440,287)
Canada
Hemet:
1.9% (332)
California:
1.2% (127,477)
Cuba
Hemet:
1.7% (295)
California:
0.3% (30,441)
Guatemala
Hemet:
1.7% (292)
California:
2.8% (290,436)
Colombia
Hemet:
1.6% (280)
California:
0.5% (55,249)
Place of birth for U.S.-born residents:
This state: 55,444
Other state: 17,688
Northeast: 1,692
Midwest: 7,861
South: 5,191
West: 2,944
89.1% of Hemet residents lived in the same house 1 years ago. Out of people who lived in different houses, 39.3% lived in this county. Out of people who lived in different counties, 72.6% lived in California.
Hemet:
89.1%
State average:
88.9%
Education attainment for males 25 years and older:
No schooling: 1,084
Nursery to 4th grade: 71
5th and 6th grade: 811
7th and 8th grade: 194
9th grade: 1,190
10th grade: 88
11th grade: 1,112
12th grade, no diploma: 1,089
High school graduate (or equivalency): 10,090
Less than 1 year of college: 2,817
Some college more than 1 year, no degree: 4,242
Associate degree: 1,219
Bachelor's degree: 4,012
Master's degree: 1,063
Professional school degree: 208
Doctorate degree: 28
Education attainment for females 25 years and older:
No schooling: 1,374
Nursery to 4th grade: 116
5th and 6th grade: 862
7th and 8th grade: 884
9th grade: 757
10th grade: 1,116
11th grade: 500
12th grade, no diploma: 880
High school graduate (or equivalency): 10,221
Less than 1 year of college: 2,990
Some college more than 1 year, no degree: 6,789
Associate degree: 2,770
Bachelor's degree: 3,396
Master's degree: 911
Professional school degree: 122
Doctorate degree: 191
Housing units in structures:
One, detached: 18,619
One, attached: 2,110
Two: 263
3 or 4: 1,155
5 to 9: 1,457
10 to 19: 589
20 to 49: 547
50 or more: 2,491
Mobile homes: 8,489
Boats, RVs, vans, etc.: 267
Median worth of mobile homes: $87,100
Housing units lacking complete plumbing facilities in 2022: 0.3%
Housing units lacking complete kitchen facilities in 2022: 1.9%