Helena, MT (Montana) Houses and Residents
| Helena: | $382,654 |
| Montana: | $366,400 |
Mean price in 2022:
Detached houses: $489,182
Here: $489,182 State: $518,333 Townhouses or other attached units: $410,507
Here: $410,507 State: $468,033 In 2-unit structures: $85,489
Here: $85,489 State: $254,784 In 3-to-4-unit structures: $307,999
Here: $307,999 State: $383,074 In 5-or-more-unit structures: $218,166
Here: $218,166 State: $373,935 Mobile homes: $110,802
Here: $110,802 State: $139,111
Total population: 29,943 (Urban population: 25,381 (all inside urban clusters), Rural population: 182 (all nonfarm))
Houses: 16,495 (15,470 occupied: 8,475 owner occupied, 6,888 renter occupied)
| % of renters here: | 45% |
| State: | 31% |
Housing density: 1,178 houses/condos per square mile
Median price asked for vacant for-sale houses and condos in 2022: $321,863.
Median contract rent in 2022: $932 (lower quartile is $623, upper quartile is $1,286)
Median rent asked for vacant for-rent units in 2022: $1,573
Median gross rent in Helena, MT in 2022: $1,012
Housing units in Helena with a mortgage: 4,516 (351 second mortgage, 36 home equity loan, 325 both second mortgage and home equity loan)
Houses without a mortgage: 39
Median household income for houses/condos with a mortgage: $98,532
Median household income for apartments without a mortgage: $78,851
Median monthly housing costs: $1,031
Compare current foreclosures in Helena, MT:
| Photo | Address | Area | Beds / Baths | Price | Details |
|---|---|---|---|---|---|

|
#1
Wilder Ave
Helena, MT 59602
|
2,814 sq. feet
|
4 baths 6 beds |
show details | |

|
#2
Elk Run Rd
Helena, MT 59602
|
1,596 sq. feet
|
2 baths 4 beds |
show details | |

|
#3
Stacia Ave
Helena, MT 59601
|
1,057 sq. feet
|
1 baths 2 beds |
show details | |

|
#4
Dutchman Ct
Helena, MT 59602
|
1,170 sq. feet
|
2 baths 3 beds |
show details | |

|
#5
Griffin Rd
Helena, MT 59602
|
1,716 sq. feet
|
3 baths 5 beds |
show details | |

|
#6
Buckskin Dr
Helena, MT 59602
|
2,128 sq. feet
|
2 baths 4 beds |
show details | |

|
#7
Kt Ln
Helena, MT 59602
|
2,816 sq. feet
|
2 baths 2 beds |
show details | |

|
#8
Lariat Rd
Helena, MT 59602
|
3,436 sq. feet
|
3 baths 5 beds |
show details | |

|
#9
Riviera Dr
Helena, MT 59602
|
924 sq. feet
|
1 baths 2 beds |
show details | |

|
#10
Western Dr
Helena, MT 59602
|
1,216 sq. feet
|
2 baths 3 beds |
show details |
| Photo | Address | Area | Beds / Baths | Price | Details |
|---|---|---|---|---|---|

|
#11
Concord Rd
Helena, MT 59602
|
1,839 sq. feet
|
2 baths 3 beds |
show details | |

|
#12
E 13th St
Helena, MT 59601
|
908 sq. feet
|
1 baths 1 beds |
show details | |

|
#13
Ferry Dr
Helena, MT 59602
|
1,232 sq. feet
|
1 baths 3 beds |
show details | |

|
#14
Joslyn St, Trlr 110
Helena, MT 59601
|
576 sq. feet
|
1 baths 2 beds |
show details | |

|
#15
N Hill Rd
Helena, MT 59602
|
1,288 sq. feet
|
2 baths 3 beds |
show details | |

|
#16
Lone Pine Rd
Helena, MT 59602
|
1,836 sq. feet
|
2 baths 3 beds |
show details | |

|
#17
Last Straw Dr
Helena, MT 59602
|
2,281 sq. feet
|
2 baths 3 beds |
show details | |

|
#18
Kelly Rd
Helena, MT 59602
|
1,008 sq. feet
|
1 baths 3 beds |
show details | |

|
#19
1/2 South Rodney Street
Helena, MT 59601
|
- sq. feet
|
- baths - beds |
show details | |

|
#20
E Broadway St Apt 11d
Helena, MT 59601
|
- sq. feet
|
- baths - beds |
show details |
| Photo | Address | Area | Beds / Baths | Price | Details |
|---|---|---|---|---|---|

|
#21
N Benton Ave
Helena, MT 59601
|
- sq. feet
|
- baths - beds |
show details | |

|
#22
Cole Ave Apt 3
Helena, MT 59601
|
- sq. feet
|
- baths - beds |
show details | |

|
#23
Claim Jumper Dr
Helena, MT 59602
|
- sq. feet
|
- baths - beds |
show details | |

|
#24
Green Meadow Dr
Helena, MT 59602
|
- sq. feet
|
- baths - beds |
show details | |

|
#25
Encore Way
Helena, MT 59602
|
- sq. feet
|
- baths - beds |
show details | |

|
#26
Quail Dr Apt D
Helena, MT 59602
|
- sq. feet
|
- baths - beds |
show details | |

|
#27
Waukesha Ave
Helena, MT 59601
|
- sq. feet
|
- baths - beds |
show details | |

|
#28
Scott Dr
Helena, MT 59601
|
- sq. feet
|
- baths - beds |
show details | |

|
#29
N Cooke St # 146
Helena, MT 59601
|
- sq. feet
|
- baths - beds |
show details | |

|
#30
Poplar St
Helena, MT 59601
|
- sq. feet
|
- baths - beds |
show details |
| Photo | Address | Area | Beds / Baths | Price | Details |
|---|---|---|---|---|---|

|
#31
Saint John Rd E
Helena, MT 59601
|
- sq. feet
|
- baths - beds |
show details | |

|
#32
N Washington St Apt 103
Helena, MT 59601
|
- sq. feet
|
- baths - beds |
show details | |

|
Check over 1 million property listings on Foreclosure.com!
|
browse all offers | |||

Latest news about housing in Helena, MT collected exclusively by city-data.com from local newspapers, TV, and radio stations

 | Home Rentals in Helena (4 replies) |
| Houses for rent in Helena (4 replies) |
| Got a job offer in Helena, looking for rental housing help (7 replies) |
| Advice on a good apt., condo, townhouse for rent in Helena? (8 replies) |
| A Different Perspective (20 replies) |
| Recent thoughts on Townsend MT (and/or Helena area in general) (10 replies) |

Median year apartment built: 1977
Household type by relationship:
Households: 33,596- Male householders: 7,219 (2,698 living alone), Female householders: 8,513 (4,125 living alone)
5,675 spouses (5,660 opposite-sex spouses), 1,297 unmarried partners, (1,263 opposite-sex unmarried partners), 7,051 children (6,629 natural, 156 adopted, 265 stepchildren), 226 grandchildren, 307 brothers or sisters, 181 parents, 12 foster children, 137 other relatives, 1,454 non-relatives
- In group quarters: 1,519
Size of family households: 4,359 2-persons, 1,570 3-persons, 1,075 4-persons, 657 5-persons, 196 6-persons, 58 7-or-more-persons.
Size of nonfamily households: 6,035 1-person, 888 2-persons, 160 3-persons, 49 4-persons, 152 5-persons.
4,419 married couples with children.
1,547 single-parent households (128 men, 1,419 women).
95.9% of residents of Helena speak English at home.
1.0% of residents speak Spanish at home (93% speak English very well, 4% speak English well, 3% don't speak English at all).
2.6% of residents speak other Indo-European language at home (75% speak English very well, 25% speak English well).
0.8% of residents speak Asian or Pacific Island language at home (71% speak English very well, 24% speak English well, 5% speak English not well).
Foreign born population: 629 (1.9%)
(56.3% of them are naturalized citizens)
| Here: | 6.9 |
| State: | 6.4 |
| Here: | 4.1 |
| State: | 4.2 |

- Bedrooms in owner-occupied houses and condos in Helena, Montana
- 28no bedroom
- 1861 bedroom
- 1,8512 bedrooms
- 3,1553 bedrooms
- 2,1974 bedrooms
- 1,0595+ bedrooms

- Bedrooms in renter-occupied apartments in Helena, Montana
- 690no bedroom
- 1,7521 bedroom
- 2,9792 bedrooms
- 1,0673 bedrooms
- 3014 bedrooms
- 1005+ bedrooms

- Cars and other vehicles available in Helena in owner-occupied houses/condos
- 187no vehicle
- 2,9081 vehicle
- 3,3552 vehicles
- 1,5033 vehicles
- 3704 vehicles
- 1535+ vehicles

- Cars and other vehicles available in Helena in renter-occupied apartments
- 1,126no vehicle
- 3,4911 vehicle
- 1,7182 vehicles
- 4413 vehicles
- 514 vehicles
- 635+ vehicles

- Rooms in owner-occupied houses in Helena, Montana
- 281 room
- 282 rooms
- 723 rooms
- 9304 rooms
- 1,3605 rooms
- 1,5096 rooms
- 1,1987 rooms
- 1,2138 rooms
- 2,1379+ rooms

- Rooms in renter-occupied apartments in Helena, Montana
- 5731 room
- 4202 rooms
- 1,5623 rooms
- 2,1914 rooms
- 1,0195 rooms
- 4276 rooms
- 2277 rooms
- 2268 rooms
- 2459+ rooms


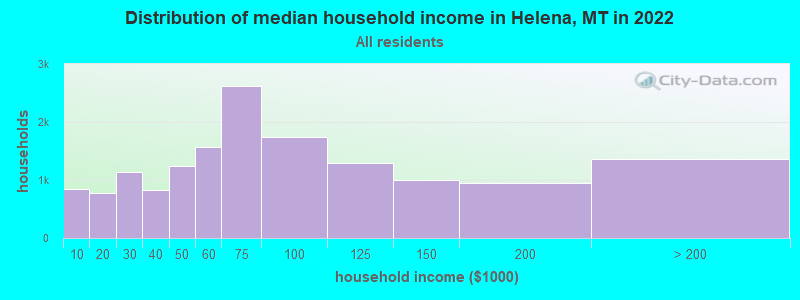
Helena, MT household income distribution

- 850Less than $10,000
- 782$10,000 to $19,999
- 1,143$20,000 to $29,999
- 832$30,000 to $39,999
- 1,245$40,000 to $49,999
- 1,574$50,000 to $59,999
- 2,625$60,000 to $74,999
- 1,741$75,000 to $99,999
- 1,285$100,000 to $124,999
- 1,000$125,000 to $149,999
- 955$150,000 to $199,999
- 1,355$200,000 or more
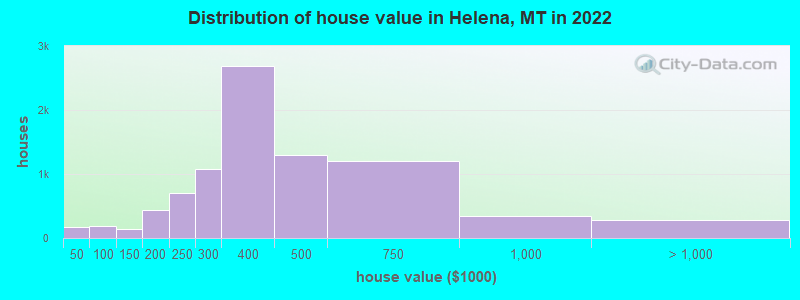
Home value of owner - occupied houses in 2022 in Helena, MT
-
- 53Less than $10,000
- 40$15,000 to $19,999
- 35$25,000 to $29,999
- 9$30,000 to $34,999
- 13$35,000 to $39,999
- 15$40,000 to $49,999
- 64$50,000 to $59,999
- 18$60,000 to $69,999
- 48$70,000 to $79,999
- 36$80,000 to $89,999
- 9$90,000 to $99,999
- 95$100,000 to $124,999
- 39$125,000 to $149,999
- 244$150,000 to $174,999
- 195$175,000 to $199,999
- 708$200,000 to $249,999
- 1,082$250,000 to $299,999
- 2,693$300,000 to $399,999
- 1,300$400,000 to $499,999
- 1,201$500,000 to $749,999
- 347$750,000 to $999,999
- 247$1,000,000 to $1,499,999
- 30$1,500,000 to $1,999,999
Rent paid by renters in 2022 in Helena, MT
-
- 102Less than $100
- 30$100 to $149
- 43$150 to $199
- 78$200 to $249
- 55$250 to $299
- 150$300 to $349
- 120$350 to $399
- 330$400 to $449
- 33$450 to $499
- 178$500 to $549
- 378$550 to $599
- 240$600 to $649
- 181$650 to $699
- 505$700 to $749
- 382$750 to $799
- 611$800 to $899
- 738$900 to $999
- 1,185$1,000 to $1,249
- 769$1,250 to $1,499
- 531$1,500 to $1,999
- 140$2,000 to $2,499
- 55$3,500 or more
- 200No cash rent


Percentage of workers working in this county: 98.0%
Number of people working at home: 2,819 (16.3% of all workers)
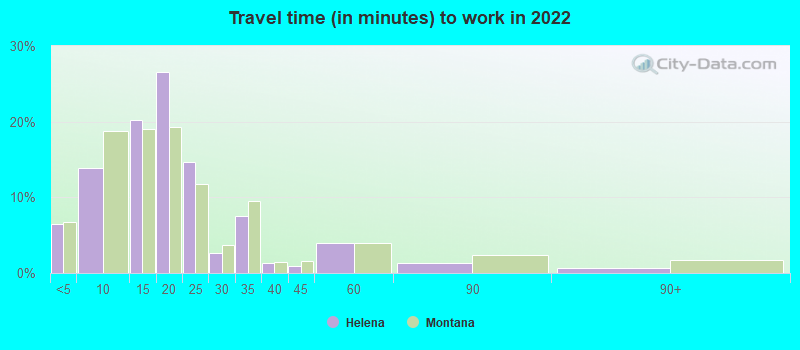
Travel time to work (commute)
- Less than 5 minutes: 1,441
- 5 to 9 minutes: 3,393
- 10 to 14 minutes: 3,898
- 15 to 19 minutes: 3,133
- 20 to 24 minutes: 1,181
- 25 to 29 minutes: 85
- 30 to 34 minutes: 577
- 35 to 39 minutes: 69
- 40 to 44 minutes: 89
- 45 to 59 minutes: 137
- 60 to 89 minutes: 102
- 90 or more minutes: 82
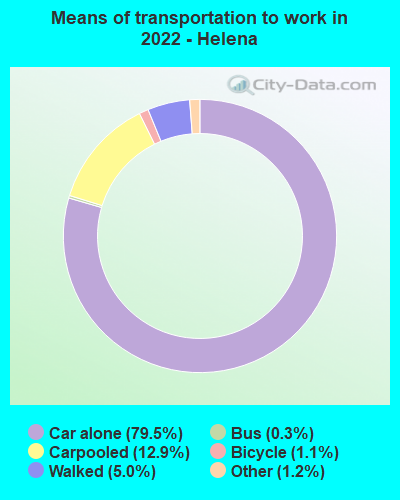
Means of transportation to work:
- Drove a car alone: 20,999 (69.8%)
- Carpooled: 4,028 (13.4%)
- Bus: 62 (0.2%)
- Taxi: 391 (1.3%)
- Bicycle: 270 (0.9%)
- Walked: 1,457 (4.8%)
- Worked at home: 2,819 (9.4%)

- Unemployment by race in 2022
- Unemployment rate for White non-Hispanic residents
- 3.7%Males
- 2.9%Females
- Unemployment rate for other race residents
- 32.4%Males
- Unemployment rate for two or more race residents
- 5.0%Males
- 8.5%Females
- Unemployment rate for Hispanic or Latino residents
- 8.3%Males
- 1.4%Females

- Year of entry for the foreign-born population in Helena, Montana
- 2902010 or later
- 312000 to 2009
- 741990 to 1999
- 541980 to 1989
- 211970 to 1979
- 194Before 1970
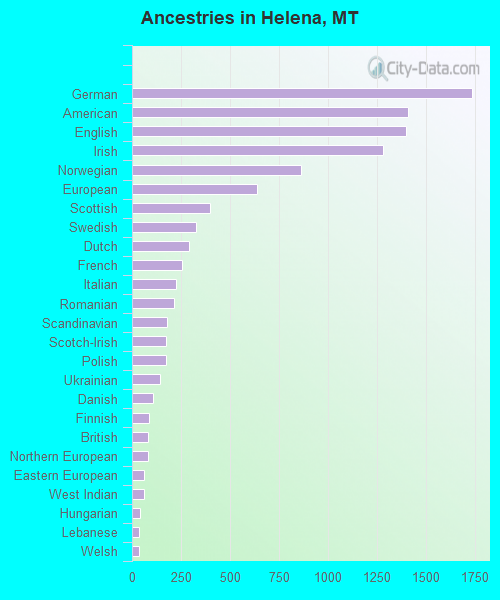
First ancestries reported:
- German: 1,737 (13.4%)
- American: 1,410 (10.8%)
- English: 1,399 (10.8%)
- Irish: 1,283 (9.9%)
- Norwegian: 861 (6.6%)
- European: 638 (4.9%)
- Scottish: 400 (3.1%)
- Swedish: 327 (2.5%)
- Dutch: 293 (2.3%)
- French: 257 (2.0%)
- Italian: 223 (1.7%)
- Romanian: 216 (1.7%)
- Scandinavian: 181 (1.4%)
- Scotch-Irish: 174 (1.3%)
- Polish: 174 (1.3%)
- Ukrainian: 142 (1.1%)
- Danish: 105 (0.8%)
- Finnish: 87 (0.7%)
- British: 84 (0.6%)
- Northern European: 83 (0.6%)
- Eastern European: 63 (0.5%)
- West Indian: 61 (0.5%)
- Hungarian: 41 (0.3%)
- Lebanese: 38 (0.3%)
- Welsh: 35 (0.3%)
- Jamaican: 31 (0.2%)
- Swiss: 29 (0.2%)
- Czech: 28 (0.2%)
- Iranian: 23 (0.2%)
- Russian: 22 (0.2%)
- Belgian: 19 (0.1%)
- French Canadian: 19 (0.1%)
- Slavic: 18 (0.1%)
- Armenian: 16 (0.1%)
- Brazilian: 16 (0.1%)
- Slovene: 15 (0.1%)
- Portuguese: 14 (0.1%)
- Slovak: 12 (0.09%)
- Macedonian: 10 (0.08%)
- Basque: 8 (0.06%)
- Croatian: 4 (0.03%)
- Canadian: 3 (0.02%)
Most common places of birth for foreign-born residents (%):
| Helena: | 18.3% (108) |
| Montana: | 1.7% (415) |
| Helena: | 13.7% (81) |
| Montana: | 2.7% (666) |
| Helena: | 12.9% (76) |
| Montana: | 9.3% (2,310) |
| Helena: | 12.7% (75) |
| Montana: | 10.6% (2,608) |
| Helena: | 9.2% (54) |
| Montana: | 14.2% (3,503) |
| Helena: | 5.3% (31) |
| Montana: | 0.2% (44) |
| Helena: | 4.2% (25) |
| Montana: | 0.8% (189) |
| Helena: | 3.7% (22) |
| Montana: | 0.7% (172) |
| Helena: | 2.7% (16) |
| Montana: | 1.1% (268) |
| Helena: | 2.5% (15) |
| Montana: | 0.6% (147) |
| Helena: | 2.2% (13) |
| Montana: | 2.3% (578) |
| Helena: | 1.9% (11) |
| Montana: | 1.7% (425) |
| Helena: | 1.5% (9) |
| Montana: | 0.4% (107) |
| Helena: | 1.5% (9) |
| Montana: | 1.0% (255) |
Place of birth for U.S.-born residents:
- This state: 15,511
- Other state: 17,354
- Northeast: 1,418
- Midwest: 4,868
- South: 2,468
- West: 8,599
81.6% of Helena residents lived in the same house 1 years ago.
Out of people who lived in different houses, 32.7% lived in this county.
Out of people who lived in different counties, 52.1% lived in Montana.
| Helena: | 81.6% |
| State average: | 86.7% |
Education attainment for males 25 years and older:
- No schooling: 11
- Nursery to 4th grade: 13
- 5th and 6th grade: 0
- 7th and 8th grade: 24
- 9th grade: 0
- 10th grade: 63
- 11th grade: 92
- 12th grade, no diploma: 156
- High school graduate (or equivalency): 2,021
- Less than 1 year of college: 484
- Some college more than 1 year, no degree: 1,144
- Associate degree: 1,370
- Bachelor's degree: 3,807
- Master's degree: 1,601
- Professional school degree: 381
- Doctorate degree: 234

Education attainment for females 25 years and older:
- No schooling: 13
- Nursery to 4th grade: 90
- 5th and 6th grade: 9
- 7th and 8th grade: 126
- 9th grade: 15
- 10th grade: 276
- 11th grade: 106
- 12th grade, no diploma: 241
- High school graduate (or equivalency): 2,406
- Less than 1 year of college: 737
- Some college more than 1 year, no degree: 1,293
- Associate degree: 1,176
- Bachelor's degree: 4,213
- Master's degree: 1,731
- Professional school degree: 342
- Doctorate degree: 214


Housing units in structures:
- One, detached: 8,832
- One, attached: 1,203
- Two: 922
- 3 or 4: 2,203
- 5 to 9: 831
- 10 to 19: 692
- 20 to 49: 679
- 50 or more: 596
- Mobile homes: 534
Median worth of mobile homes: $106,190
Housing units lacking complete kitchen facilities in 2022: 2.2%
House/condo owner moved in on average 9 years ago
Renter moved in on average 3 years ago

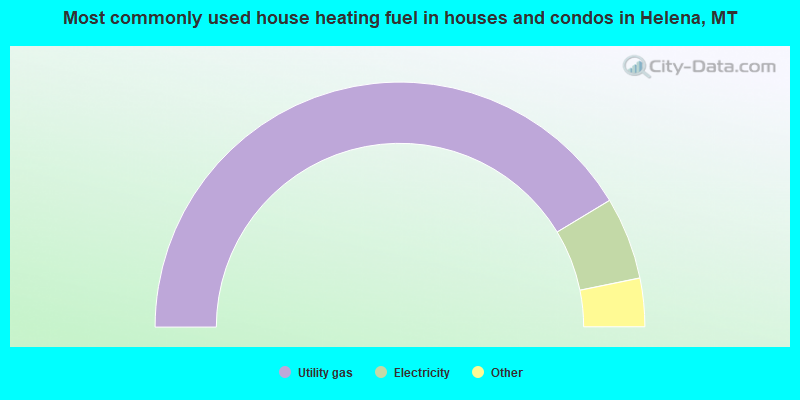
- 82.7%Utility gas
- 10.9%Electricity
- 3.2%Wood
- 2.7%Bottled, tank, or LP gas
- 0.4%Other fuel
- 0.2%Solar energy
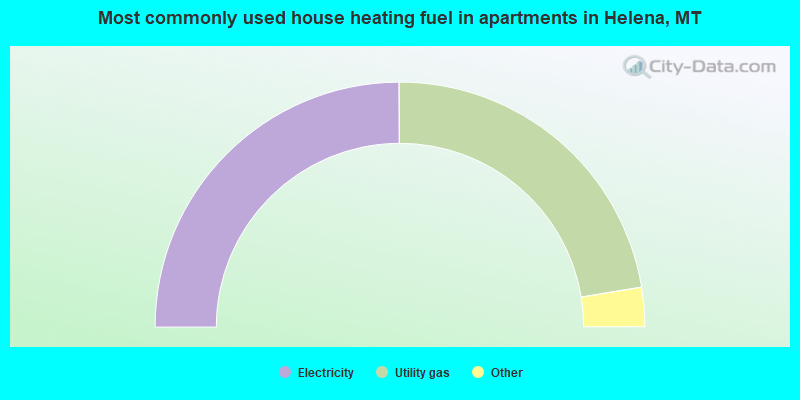
- 49.9%Electricity
- 44.9%Utility gas
- 2.5%No fuel used
- 1.7%Bottled, tank, or LP gas
- 0.5%Other fuel
- 0.5%Solar energy
Private vs. public school enrollment:
| Here: | 5.6% |
| Montana: | 15.3% |
| Here: | 1.2% |
| Montana: | 12.2% |
| Here: | 79.0% |
| Montana: | 15.0% |


