Hebron, CT (Connecticut) Houses and Residents
| Hebron: | $368,603 |
| Connecticut: | $347,200 |
Total population: 9,686 (Urban population: 1,092, Rural population: 7,518 (58 farm, 7,460 nonfarm))
Houses: 3,110 (2,993 occupied: 2,670 owner occupied, 323 renter occupied)
| % of renters here: | 11% |
| State: | 34% |
Housing density: 84 houses/condos per square mile
Median price asked for vacant for-sale houses and condos in 2022 in this county: $251,692.
Median contract rent in 2022: $1,224 (lower quartile is $839, upper quartile is $1,482)
Median rent asked for vacant for-rent units in 2022: $1,329
Median gross rent in Hebron, CT in 2022: $1,423
Housing units in Hebron with a mortgage: 2,033 (148 second mortgage, 246 home equity loan, 0 both second mortgage and home equity loan)
Houses without a mortgage: 387
Compare current foreclosures near Hebron, CT:
| Photo | Address | Area | Beds / Baths | Price | Details |
|---|---|---|---|---|---|

|
#1
Wall St
Hebron, CT 06248
|
- sq. feet
|
- baths - beds |
show details | |

|
#2
Newberry Rd
South Windsor, CT 06074
|
3,386 sq. feet
|
2 baths 4 beds |
$649,900
|
show details |

|
#3
Irving St
Manchester, CT 06042
|
1,335 sq. feet
|
2 baths 3 beds |
$251,750
|
show details |

|
#4
Reservoir Rd
Vernon Rockville, CT 06066
|
1,288 sq. feet
|
2 baths 3 beds |
$379,900
|
show details |

|
#5
Kozley Rd
Tolland, CT 06084
|
1,132 sq. feet
|
2 baths 3 beds |
$264,900
|
show details |

|
#6
Lake Dr E
Oakdale, CT 06370
|
1,346 sq. feet
|
1 baths 3 beds |
$349,900
|
show details |

|
#7
Winthrop Blvd
Cromwell, CT 06416
|
1,092 sq. feet
|
1 baths 3 beds |
$220,000
|
show details |

|
#8
Shares Ln
South Windsor, CT 06074
|
1,850 sq. feet
|
2 baths 4 beds |
$365,000
|
show details |

|
#9
Pleasant St
Willimantic, CT 06226
|
2,836 sq. feet
|
3 baths 6 beds |
show details | |

|
#10
Mount Parnassus Rd
East Haddam, CT 06423
|
2,328 sq. feet
|
3 baths 3 beds |
show details |
| Photo | Address | Area | Beds / Baths | Price | Details |
|---|---|---|---|---|---|

|
#11
Blvd Rd
Windham, CT 06280
|
1,322 sq. feet
|
1 baths 3 beds |
show details | |

|
#12
Llynwood Dr
Bolton, CT 06043
|
1,335 sq. feet
|
1 baths 4 beds |
show details | |

|
#13
Middletown Ave
Wethersfield, CT 06109
|
1,372 sq. feet
|
1 baths 4 beds |
show details | |

|
#14
Huntington Rd
Scotland, CT 06264
|
960 sq. feet
|
1 baths 3 beds |
show details | |

|
#15
Thompson Rd # 2g
Manchester, CT 06040
|
734 sq. feet
|
1 baths 1 beds |
show details | |

|
#16
Greenwood Dr
Manchester, CT 06042
|
750 sq. feet
|
1 baths 2 beds |
show details | |

|
#17
Mansfield Ave
Willimantic, CT 06226
|
920 sq. feet
|
1 baths 3 beds |
show details | |

|
#18
Butternut Ln
Rocky Hill, CT 06067
|
1,176 sq. feet
|
1 baths 2 beds |
show details | |

|
#19
Holbrook Ave
Willimantic, CT 06226
|
1,536 sq. feet
|
2 baths 4 beds |
show details | |

|
#20
Park Rd
Marlborough, CT 06447
|
1,134 sq. feet
|
1 baths 3 beds |
show details |
| Photo | Address | Area | Beds / Baths | Price | Details |
|---|---|---|---|---|---|

|
#21
Jones Hollow Rd
Marlborough, CT 06447
|
1,984 sq. feet
|
2 baths 3 beds |
show details | |

|
#22
Circle Dr
Mansfield Center, CT 06250
|
1,152 sq. feet
|
1 baths 3 beds |
show details | |

|
#23
Bell Ct Apt C1
East Hartford, CT 06108
|
890 sq. feet
|
1 baths 2 beds |
show details | |

|
#24
Florida Rd
East Haddam, CT 06423
|
1,734 sq. feet
|
2 baths 3 beds |
show details | |

|
#25
Hope Valley Rd
Amston, CT 06231
|
2,128 sq. feet
|
2 baths 3 beds |
show details | |

|
#26
New London Rd
Colchester, CT 06415
|
1,938 sq. feet
|
3 baths 3 beds |
show details | |

|
#27
Willimantic Rd
Chaplin, CT 06235
|
2,332 sq. feet
|
3 baths 5 beds |
show details | |

|
#28
High St
South Windsor, CT 06074
|
1,338 sq. feet
|
2 baths 3 beds |
show details | |

|
#29
Summer St
Manchester, CT 06040
|
2,418 sq. feet
|
2 baths 6 beds |
show details | |

|
#30
Lumber Yard Rd
East Haddam, CT 06423
|
2,400 sq. feet
|
2 baths 6 beds |
show details |
| Photo | Address | Area | Beds / Baths | Price | Details |
|---|---|---|---|---|---|

|
#31
Talcottville Rd Apt 7
Vernon Rockville, CT 06066
|
1,018 sq. feet
|
1 baths 2 beds |
show details | |

|
#32
Old Post Rd
Tolland, CT 06084
|
1,961 sq. feet
|
2 baths 4 beds |
show details | |

|
#33
South St
Cromwell, CT 06416
|
2,272 sq. feet
|
3 baths 3 beds |
show details | |

|
#34
Eastern Dr
Middletown, CT 06457
|
1,554 sq. feet
|
2 baths 3 beds |
show details | |

|
#35
Dekoven Dr # 901
Middletown, CT 06457
|
1,034 sq. feet
|
2 baths 2 beds |
show details | |

|
#36
Dekoven 901
Middletown, CT 06457
|
1,034 sq. feet
|
2 baths 2 beds |
show details | |

|
#37
Frisbie St
Middletown, CT 06457
|
1,296 sq. feet
|
2 baths 3 beds |
show details | |

|
#38
Leverich Dr
East Hartford, CT 06108
|
1,977 sq. feet
|
1 baths 3 beds |
show details | |

|
#39
College Dr
East Hartford, CT 06108
|
1,735 sq. feet
|
2 baths 3 beds |
show details | |

|
#40
Whiting Rd
East Hartford, CT 06118
|
1,500 sq. feet
|
1 baths 3 beds |
show details |
| Photo | Address | Area | Beds / Baths | Price | Details |
|---|---|---|---|---|---|

|
#41
Maiden Ln
Vernon Rockville, CT 06066
|
1,665 sq. feet
|
2 baths 5 beds |
show details | |

|
#42
Boulter Rd
Wethersfield, CT 06109
|
2,056 sq. feet
|
2 baths 3 beds |
show details | |

|
#43
Washington Rd
Cromwell, CT 06416
|
1,316 sq. feet
|
1 baths 2 beds |
show details | |

|
#44
Longvue Dr
Wethersfield, CT 06109
|
2,179 sq. feet
|
1 baths 3 beds |
show details | |

|
#45
Saybrook Rd
Middletown, CT 06457
|
1,587 sq. feet
|
2 baths 4 beds |
show details | |

|
#46
Anthony Rd
Tolland, CT 06084
|
1,584 sq. feet
|
1 baths 3 beds |
show details | |

|
#47
Forbes St
East Hartford, CT 06118
|
1,274 sq. feet
|
1 baths 3 beds |
show details | |

|
#48
Raymond Rd
Rocky Hill, CT 06067
|
1,150 sq. feet
|
1 baths 2 beds |
show details | |

|
#49
Winesap Cir
Rocky Hill, CT 06067
|
1,304 sq. feet
|
1 baths 2 beds |
show details | |

|
Check over 1 million property listings on Foreclosure.com!
|
browse all offers | |||
Latest news about housing in Hebron, CT collected exclusively by city-data.com from local newspapers, TV, and radio stations


Household type by relationship:
Households: 136,574- In family households: 112,649 (26,574 male householders, 10,133 female householders)
29,922 spouses, 38,844 children (36,460 natural, 1,015 adopted, 1,369 stepchildren), 1,606 grandchildren, 688 brothers or sisters, 931 parents, foster children, 693 other relatives, 2,519 non-relatives
- In nonfamily households: 23,925 (8,485 male householders (5,980 living alone)), 9,285 female householders (7,198 living alone)), 6,155 nonrelatives
- In group quarters: 16,117 (4,028 institutionalized population)
24,754 married couples with children.
5,247 single-parent households (1,309 men, 3,938 women).
95.8% of residents of Hebron speak English at home.
1.4% of residents speak Spanish at home (77% speak English very well, 9% speak English well, 14% speak English not well).
2.2% of residents speak other Indo-European language at home (79% speak English very well, 21% speak English well).
0.3% of residents speak Asian or Pacific Island language at home (100% speak English very well).
0.3% of residents speak other language at home (30% speak English very well, 70% speak English well).
Foreign born population: 378 (3.7%)
(82.0% of them are naturalized citizens)
| Here: | 8.3 |
| State: | 6.5 |
| Here: | 4.6 |
| State: | 4.0 |

- Bedrooms in owner-occupied houses and condos in Hebron, Connecticut
- 0no bedroom
- 241 bedroom
- 2262 bedrooms
- 1,7603 bedrooms
- 5984 bedrooms
- 625+ bedrooms

- Bedrooms in renter-occupied apartments in Hebron, Connecticut
- 0no bedroom
- 341 bedroom
- 1712 bedrooms
- 853 bedrooms
- 334 bedrooms
- 05+ bedrooms

- Cars and other vehicles available in Hebron in owner-occupied houses/condos
- 27no vehicle
- 4001 vehicle
- 1,5592 vehicles
- 5203 vehicles
- 1204 vehicles
- 445+ vehicles

- Cars and other vehicles available in Hebron in renter-occupied apartments
- 8no vehicle
- 771 vehicle
- 1772 vehicles
- 423 vehicles
- 194 vehicles
- 05+ vehicles

- Rooms in owner-occupied houses in Hebron, Connecticut
- 01 room
- 02 rooms
- 153 rooms
- 664 rooms
- 2465 rooms
- 6236 rooms
- 7327 rooms
- 6468 rooms
- 3429+ rooms

- Rooms in renter-occupied apartments in Hebron, Connecticut
- 01 room
- 02 rooms
- 343 rooms
- 1334 rooms
- 645 rooms
- 186 rooms
- 307 rooms
- 08 rooms
- 449+ rooms


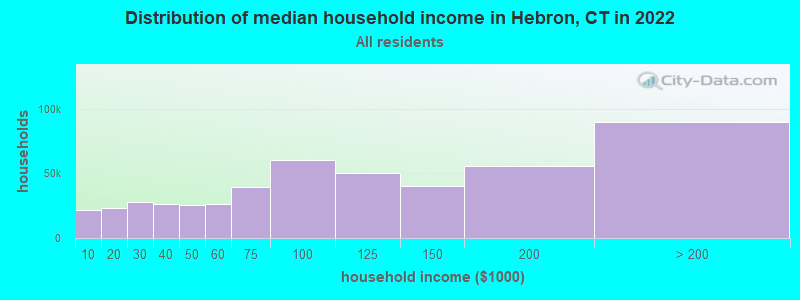
Hebron, CT household income distribution

- 16,387Less than $10,000
- 17,100$10,000 to $19,999
- 20,885$20,000 to $29,999
- 20,915$30,000 to $39,999
- 19,467$40,000 to $49,999
- 20,425$50,000 to $59,999
- 32,361$60,000 to $74,999
- 48,954$75,000 to $99,999
- 41,543$100,000 to $124,999
- 33,316$125,000 to $149,999
- 46,652$150,000 to $199,999
- 77,175$200,000 or more
Percentage of workers working in this county: 22.7%
Number of people working at home: 1,011 (18.4% of all workers)
Travel time to work (commute)
- Less than 5 minutes: 98
- 5 to 9 minutes: 144
- 10 to 14 minutes: 320
- 15 to 19 minutes: 392
- 20 to 24 minutes: 485
- 25 to 29 minutes: 413
- 30 to 34 minutes: 1,183
- 35 to 39 minutes: 377
- 40 to 44 minutes: 457
- 45 to 59 minutes: 470
- 60 to 89 minutes: 165
- 90 or more minutes: 42
Means of transportation to work:
- Drove a car alone: 4,036 (85.5%)
- Carpooled: 389 (8.2%)
- Bus or trolley bus: 93 (2.0%)
- Walked: 18 (0.4%)
- Other means: 10 (0.2%)
- Worked at home: 174 (3.7%)


- Year of entry for the foreign-born population in Hebron, Connecticut
- 381995 to March 2000
- 241990 to 1994
- 121985 to 1989
- 01980 to 1984
- 221975 to 1979
- 91970 to 1974
- 271965 to 1969
- 98Before 1965

First ancestries reported:
- Irish: 2,212 (18.8%)
- Italian: 1,719 (14.6%)
- English: 1,377 (11.7%)
- French: 1,146 (9.7%)
- Polish: 1,107 (9.4%)
- German: 1,000 (8.5%)
- Other: 732 (6.2%)
- French Canadian: 481 (4.1%)
- Swedish: 339 (2.9%)
- Scottish: 298 (2.5%)
- United States: 222 (1.9%)
- Ukrainian: 177 (1.5%)
- Russian: 128 (1.1%)
- Hungarian: 125 (1.1%)
- Czech: 113 (1.0%)
- Welsh: 106 (0.9%)
- Dutch: 85 (0.7%)
- Swiss: 81 (0.7%)
- Scotch-Irish: 79 (0.7%)
- Lithuanian: 57 (0.5%)
- Greek: 49 (0.4%)
- Portuguese: 44 (0.4%)
- Norwegian: 28 (0.2%)
- Danish: 24 (0.2%)
- Slovak: 22 (0.2%)
- Arab: 19 (0.2%)
Most common places of birth for foreign-born residents (%):
| Hebron: | 20.4% (47) |
| Connecticut: | 5.2% (19,083) |
| Hebron: | 16.1% (37) |
| Connecticut: | 4.4% (16,395) |
| Hebron: | 10.4% (24) |
| Connecticut: | 2.5% (9,358) |
| Hebron: | 8.3% (19) |
| Connecticut: | 7.0% (26,023) |
| Hebron: | 7.8% (18) |
| Connecticut: | 1.7% (6,247) |
| Hebron: | 7.0% (16) |
| Connecticut: | 3.1% (11,432) |
| Hebron: | 7.0% (16) |
| Connecticut: | 0.7% (2,646) |
| Hebron: | 5.2% (12) |
| Connecticut: | 1.1% (3,919) |
| Hebron: | 4.3% (10) |
| Connecticut: | 1.5% (5,508) |
| Hebron: | 4.3% (10) |
| Connecticut: | 1.7% (6,181) |
| Hebron: | 3.5% (8) |
| Connecticut: | 6.9% (25,507) |
| Hebron: | 3.0% (7) |
| Connecticut: | 0.7% (2,465) |
| Hebron: | 2.6% (6) |
| Connecticut: | 1.2% (4,344) |
Place of birth for U.S.-born residents:
- This state: 6,013
- Other state: 2,329
- Northeast: 1,680
- Midwest: 346
- South: 216
- West: 87
68% of Hebron residents lived in the same house 5 years ago.
Out of people who lived in different houses, 29% lived in this county.
Out of people who lived in different counties, 72% lived in Connecticut.
Education attainment for males 25 years and older:
- No schooling: 0
- Nursery to 4th grade: 0
- 5th and 6th grade: 0
- 7th and 8th grade: 41
- 9th grade: 50
- 10th grade: 24
- 11th grade: 48
- 12th grade, no diploma: 53
- High school graduate (or equivalency): 535
- Less than 1 year of college: 197
- Some college more than 1 year, no degree: 339
- Associate degree: 206
- Bachelor's degree: 653
- Master's degree: 463
- Professional school degree: 89
- Doctorate degree: 33

Education attainment for females 25 years and older:
- No schooling: 0
- Nursery to 4th grade: 0
- 5th and 6th grade: 0
- 7th and 8th grade: 16
- 9th grade: 29
- 10th grade: 30
- 11th grade: 33
- 12th grade, no diploma: 27
- High school graduate (or equivalency): 641
- Less than 1 year of college: 230
- Some college more than 1 year, no degree: 330
- Associate degree: 382
- Bachelor's degree: 783
- Master's degree: 319
- Professional school degree: 47
- Doctorate degree: 31


Housing units in structures:
- One, detached: 2,849
- One, attached: 27
- Two: 54
- 3 or 4: 97
- 5 to 9: 74
- Mobile homes: 9

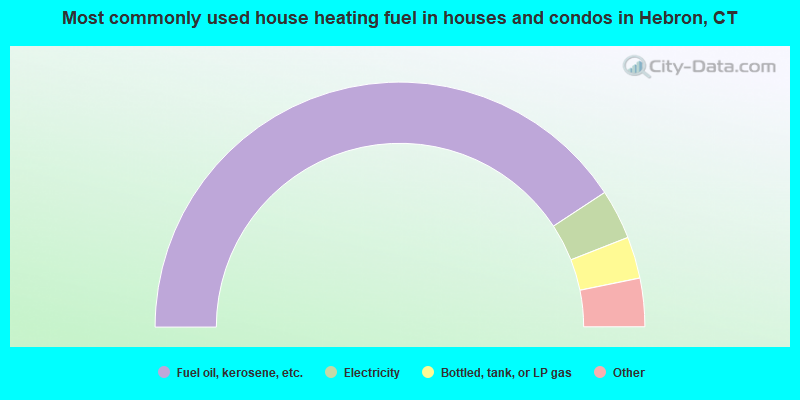
- 81.5%Fuel oil, kerosene, etc.
- 6.6%Electricity
- 5.5%Bottled, tank, or LP gas
- 3.6%Wood
- 2.1%Utility gas
- 0.4%Solar energy
- 0.3%Coal or coke
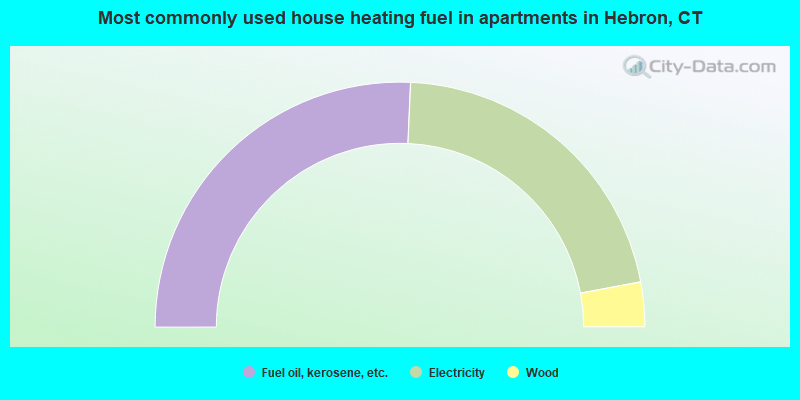
- 51.4%Fuel oil, kerosene, etc.
- 42.7%Electricity
- 5.9%Wood
Private vs. public school enrollment:
| Here: | 1.8% |
| Connecticut: | 9.9% |
| Here: | 5.1% |
| Connecticut: | 11.0% |
| Here: | 26.2% |
| Connecticut: | 33.4% |


