Harrisburg, PA (Pennsylvania) Houses and Residents
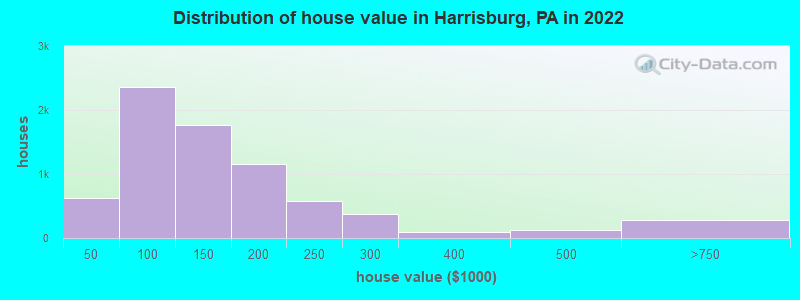
Estimated median house or condo value in 2022: $117,054 (it was $56,900 in 2000 )
Harrisburg:
$117,054Pennsylvania:
$245,500
Lower value quartile - upper value quartile: $77,064 - $186,510Mean price in 2022: Detached houses: $198,798 Here:
$198,798State:
$317,202
Townhouses or other attached units: $138,134 Here:
$138,134State:
$254,369
In 2-unit structures: $204,514 Here:
$204,514State:
$249,182
In 3-to-4-unit structures: $164,720 Here:
$164,720State:
$297,446
In 5-or-more-unit structures: $196,803 Here:
$196,803State:
$320,068
Total population: 49,082 (Urban population: 49,070, Rural population: 30 (all nonfarm) )
Houses: 24,619 (21,677 occupied: 7,914 owner occupied, 14,378 renter occupied )
% of renters here:
64%State:
31%
Housing density: 3,036 houses/condos per square mile
Median price asked for vacant for-sale houses and condos in 2022: $184,913.
Median contract rent in 2022: $792 (lower quartile is $623, upper quartile is $963)
Median rent asked for vacant for-rent units in 2022: $969
Median gross rent in Harrisburg, PA in 2022: $937
Housing units in Harrisburg with a mortgage: 4,639 (237 second mortgage, 15 home equity loan, 177 both second mortgage and home equity loan )Houses without a mortgage: 372
Median household income for houses/condos with a mortgage: $67,328
Median household income for apartments without a mortgage: $59,354
Median monthly housing costs: $917
Data:
Median house or condo value ($)
Median house or condo value ($ change since 2000)
Median house or condo value ($) - White
Median house or condo value ($) - Black or African American
Median house or condo value ($) - Asian
Median house or condo value ($) - Hispanic or Latino
Median house or condo value ($) - American Indian and Alaska Native
Median house or condo value ($) - Multirace
Median house or condo value ($) - Other Race
Median price asked for mobile homes ($)
Household density (households per square mile)
Mean house or condo value by units in structure - 1, detached ($)
Mean house or condo value by units in structure - 1, attached ($)
Mean house or condo value by units in structure - 2 ($)
Mean house or condo value by units in structure by units in structure - 3 or 4 ($)
Mean house or condo value by units in structure - 5 or more ($)
Mean house or condo value by units in structure - Boat, RV, van, etc. ($)
Mean house or condo value by units in structure - Mobile home ($)
Median contract rent ($)
Median contract rent - Lower quartile ($)
Median contract rent - Upper quartile ($)
Median gross rent ($)
Urban houses (%)
Rural houses (%)
Houses occupied (%)
Houses occupied (% change since 2000)
Houses owner occupied (%)
Houses owner occupied (% change since 2000)
Houses renter occupied (%)
Houses renter occupied (% change since 2000)
Vacant housing units - For rent (%)
Vacant housing units - For rent (% change since 2000)
Vacant housing units - For sale only (%)
Vacant housing units - For sale only (% change since 2000)
Vacant housing units - Rented or sold, not occupied (%)
Vacant housing units - Rented or sold, not occupied (% change since 2000)
Vacant housing units - For seasonal, recreational, or occasional use (%)
Vacant housing units - For seasonal, recreational, or occasional use (% change since 2000)
Vacant housing units - For migrant workers (%)
Vacant housing units - For migrant workers (% change since 2000)
Vacant housing units - Other vacant (%)
Vacant housing units - Other vacant (% change since 2000)
Median monthly housing costs ($)
Median household income for houses/condos with a mortgage ($)
Median household income for houses/condos without a mortgage ($)
Median household income ($)
Median household income ($) - White
Median household income ($) - Black or African American
Median household income ($) - Asian
Median household income ($) - Hispanic or Latino
Median household income ($) - American Indian and Alaska Native
Median household income ($) - Multirace
Median household income ($) - Other Race
Mortgage status - with mortgage (%)
Mortgage status - with second mortgage (%)
Mortgage status - with home equity loan (%)
Mortgage status - with both second mortgage and home equity loan (%)
Mortgage status - without a mortgage (%)
Median year house/condo built
Median year apartment built
Household type by relationship - Male householder living alone (%)
Household type by relationship - Male householder not living alone (%)
Household type by relationship - Female householder living alone (%)
Household type by relationship - Female householder not living alone (%)
Household type by relationship - Opposite-Sex spouse (%)
Household type by relationship - Same-Sex spouse (%)
Household type by relationship - Opposite-Sex unmarried partner (%)
Household type by relationship - Same-Sex unmarried partner (%)
Household type by relationship - In group quarters (%)
Size of family households - 2-person household (%)
Size of family households - 3-person household (%)
Size of family households - 4-person household (%)
Size of family households - 5-person household (%)
Size of family households - 6-person household (%)
Size of family households - 7-or-more-person household (%)
Size of nonfamily households - 1-person household (%)
Size of nonfamily households - 2-person household (%)
Size of nonfamily households - 3-person household (%)
Size of nonfamily households - 4-person household (%)
Size of nonfamily households - 5-person household (%)
Size of nonfamily households - 6-person household (%)
Size of nonfamily households - 7-or-moreperson household (%)
Year house built - Built 2010 or later (%)
Year house built - Built 2000 to 2009 (%)
Year house built - Built 1990 to 1999 (%)
Year house built - Built 1980 to 1989 (%)
Year house built - Built 1970 to 1979 (%)
Year house built - Built 1960 to 1969 (%)
Year house built - Built 1950 to 1959 (%)
Year house built - Built 1940 to 1949 (%)
Year house built - Built 1939 or earlier (%)
Median number of rooms in houses and condos
Median number of rooms in apartments
Median number of bedrooms in owner occupied houses
Mean number of bedrooms in owner occupied houses
Median number of bedrooms in renter occupied houses
Mean number of bedrooms in renter occupied houses
Median number of vehichles in owner occupied houses
Mean number of vehichles in owner occupied houses
Median number of vehichles in renter occupied houses
Mean number of vehichles in renter occupied houses
Rooms in owner-occupied houses - 1 room (%)
Rooms in owner-occupied houses - 2 rooms (%)
Rooms in owner-occupied houses - 3 rooms (%)
Rooms in owner-occupied houses - 4 rooms (%)
Rooms in owner-occupied houses - 5 rooms (%)
Rooms in owner-occupied houses - 6 rooms (%)
Rooms in owner-occupied houses - 7 rooms (%)
Rooms in owner-occupied houses - 8 rooms (%)
Rooms in owner-occupied houses - 9+ rooms (%)
Rooms in renter-occupied houses - 1 room (%)
Rooms in renter-occupied houses - 2 rooms (%)
Rooms in renter-occupied houses - 3 rooms (%)
Rooms in renter-occupied houses - 4 rooms (%)
Rooms in renter-occupied houses - 5 rooms (%)
Rooms in renter-occupied houses - 6 rooms (%)
Rooms in renter-occupied houses - 7 rooms (%)
Rooms in renter-occupied houses - 8 rooms (%)
Rooms in renter-occupied houses - 9+ rooms (%)
Bedrooms in owner-occupied houses - no bedrooms (%)
Bedrooms in owner-occupied houses - 1 bedroom (%)
Bedrooms in owner-occupied houses - 2 bedrooms (%)
Bedrooms in owner-occupied houses - 3 bedrooms (%)
Bedrooms in owner-occupied houses - 4 bedrooms (%)
Bedrooms in owner-occupied houses - 5+ bedrooms (%)
Bedrooms in renter-occupied houses - no bedrooms (%)
Bedrooms in renter-occupied houses - 1 bedroom (%)
Bedrooms in renter-occupied houses - 2 bedrooms (%)
Bedrooms in renter-occupied houses - 3 bedrooms (%)
Bedrooms in renter-occupied houses - 4 bedrooms (%)
Bedrooms in renter-occupied houses - 5+ bedrooms (%)
Vehicles available in owner-occupied houses - no vehicle available (%)
Vehicles available in owner-occupied houses - 1 vehicle available(%)
Vehicles available in owner-occupied houses - 2 Vehicles available (%)
Vehicles available in owner-occupied houses - 3 Vehicles available (%)
Vehicles available in owner-occupied houses - 4 Vehicles available (%)
Vehicles available in owner-occupied houses - 5+ Vehicles available (%)
Vehicles available in renter-occupied houses - no vehicle available (%)
Vehicles available in renter-occupied houses - 1 vehicle available (%)
Vehicles available in renter-occupied houses - 2 Vehicles available (%)
Vehicles available in renter-occupied houses - 3 Vehicles available (%)
Vehicles available in renter-occupied houses - 4 Vehicles available (%)
Vehicles available in renter-occupied houses - 5+ Vehicles available (%)
Housing units in structures - 1, detached (%)
Housing units in structures - 1, attached (%)
Housing units in structures - 2 (%)
Housing units in structures - 3 or 4 (%)
Housing units in structures - 5 to 9 (%)
Housing units in structures - 10 to 19 (%)
Housing units in structures - 20 to 49 (%)
Housing units in structures - 50 or more (%)
Housing units in structures - Mobile home (%)
Housing units in structures - Boat, RV, van, etc. (%)
Housing units in structures - Owners - 1, detached (%)
Housing units in structures - Owners - 1, attached (%)
Housing units in structures - Owners - 2 (%)
Housing units in structures - Owners - 3 or 4 (%)
Housing units in structures - Owners - 5 to 9 (%)
Housing units in structures - Owners - 10 to 19 (%)
Housing units in structures - Owners - 20 to 49 (%)
Housing units in structures - Owners - 50 or more (%)
Housing units in structures - Owners - Mobile home (%)
Housing units in structures - Owners - Boat, RV, van, etc. (%)
Housing units in structures - Renters - 1, detached (%)
Housing units in structures - Renters - 1, attached (%)
Housing units in structures - Renters - 2 (%)
Housing units in structures - Renters - 3 or 4 (%)
Housing units in structures - Renters - 5 to 9 (%)
Housing units in structures - Renters - 10 to 19 (%)
Housing units in structures - Renters - 20 to 49 (%)
Housing units in structures - Renters - 50 or more (%)
Housing units in structures - Renters - Mobile home (%)
Housing units in structures - Renters - Boat, RV, van, etc. (%)
House/condo owner moved in on average (years ago)
Renter moved in on average (years ago)
Year householder moved into unit - Moved in 1999 to March 2000 (%)
Year householder moved into unit - Moved in 1999 to March 2000 (%) - White
Year householder moved into unit - Moved in 1999 to March 2000 (%) - Black or African American
Year householder moved into unit - Moved in 1999 to March 2000 (%) - Asian
Year householder moved into unit - Moved in 1999 to March 2000 (%) - Hispanic or Latino
Year householder moved into unit - Moved in 1999 to March 2000 (%) - American Indian and Alaska Native
Year householder moved into unit - Moved in 1999 to March 2000 (%) - Multirace
Year householder moved into unit - Moved in 1999 to March 2000 (%) - Other Race
Year householder moved into unit - Moved in 1995 to 1998 (%)
Year householder moved into unit - Moved in 1995 to 1998 (%) - White
Year householder moved into unit - Moved in 1995 to 1998 (%) - Black or African American
Year householder moved into unit - Moved in 1995 to 1998 (%) - Asian
Year householder moved into unit - Moved in 1995 to 1998 (%) - Hispanic or Latino
Year householder moved into unit - Moved in 1995 to 1998 (%) - American Indian and Alaska Native
Year householder moved into unit - Moved in 1995 to 1998 (%) - Multirace
Year householder moved into unit - Moved in 1995 to 1998 (%) - Other Race
Year householder moved into unit - Moved in 1990 to 1994 (%)
Year householder moved into unit - Moved in 1990 to 1994 (%) - White
Year householder moved into unit - Moved in 1990 to 1994 (%) - Black or African American
Year householder moved into unit - Moved in 1990 to 1994 (%) - Asian
Year householder moved into unit - Moved in 1990 to 1994 (%) - Hispanic or Latino
Year householder moved into unit - Moved in 1990 to 1994 (%) - American Indian and Alaska Native
Year householder moved into unit - Moved in 1990 to 1994 (%) - Multirace
Year householder moved into unit - Moved in 1990 to 1994 (%) - Other Race
Year householder moved into unit - Moved in 1980 to 1989 (%)
Year householder moved into unit - Moved in 1980 to 1989 (%) - White
Year householder moved into unit - Moved in 1980 to 1989 (%) - Black or African American
Year householder moved into unit - Moved in 1980 to 1989 (%) - Asian
Year householder moved into unit - Moved in 1980 to 1989 (%) - Hispanic or Latino
Year householder moved into unit - Moved in 1980 to 1989 (%) - American Indian and Alaska Native
Year householder moved into unit - Moved in 1980 to 1989 (%) - Multirace
Year householder moved into unit - Moved in 1980 to 1989 (%) - Other Race
Year householder moved into unit - Moved in 1970 to 1979 (%)
Year householder moved into unit - Moved in 1970 to 1979 (%) - White
Year householder moved into unit - Moved in 1970 to 1979 (%) - Black or African American
Year householder moved into unit - Moved in 1970 to 1979 (%) - Asian
Year householder moved into unit - Moved in 1970 to 1979 (%) - Hispanic or Latino
Year householder moved into unit - Moved in 1970 to 1979 (%) - American Indian and Alaska Native
Year householder moved into unit - Moved in 1970 to 1979 (%) - Multirace
Year householder moved into unit - Moved in 1970 to 1979 (%) - Other Race
Year householder moved into unit - Moved in 1969 or earlier (%)
Year householder moved into unit - Moved in 1969 or earlier (%) - White
Year householder moved into unit - Moved in 1969 or earlier (%) - Black or African American
Year householder moved into unit - Moved in 1969 or earlier (%) - Asian
Year householder moved into unit - Moved in 1969 or earlier (%) - Hispanic or Latino
Year householder moved into unit - Moved in 1969 or earlier (%) - American Indian and Alaska Native
Year householder moved into unit - Moved in 1969 or earlier (%) - Multirace
Year householder moved into unit - Moved in 1969 or earlier (%) - Other Race
Housing units lacking complete plumbing facilities (%)
Housing units lacking complete kitchen facilities (%)
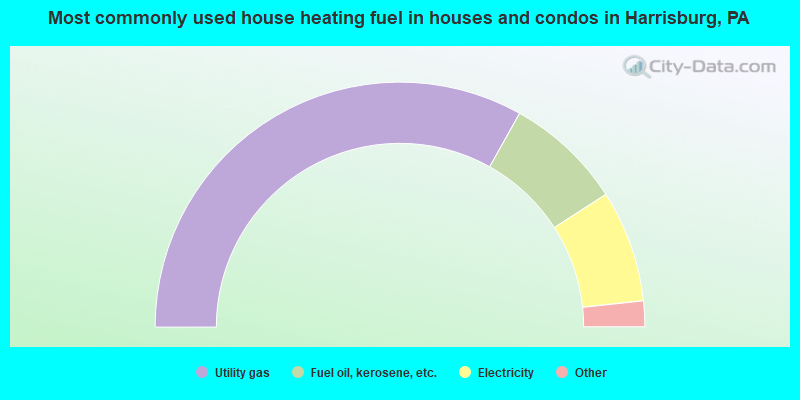
House heating fuel used in houses and condos - Utility gas (%)
House heating fuel used in houses and condos - Bottled, tank, or LP gas (%)
House heating fuel used in houses and condos - Electricity (%)
House heating fuel used in houses and condos - Fuel oil, kerosene, etc. (%)
House heating fuel used in houses and condos - Coal or coke (%)
House heating fuel used in houses and condos - Wood (%)
House heating fuel used in houses and condos - Solar energy (%)
House heating fuel used in houses and condos - Other fuel (%)
House heating fuel used in houses and condos - No fuel used (%)
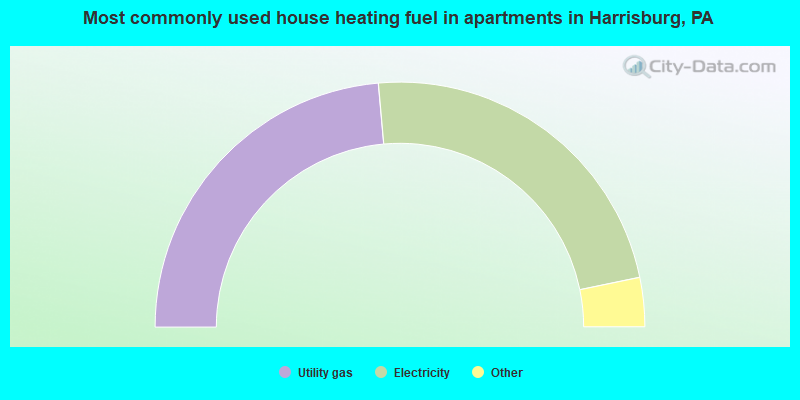
House heating fuel used in apartments - Utility gas (%)
House heating fuel used in apartments - Bottled, tank, or LP gas (%)
House heating fuel used in apartments - Electricity (%)
House heating fuel used in apartments - Fuel oil, kerosene, etc. (%)
House heating fuel used in apartments - Coal or coke (%)
House heating fuel used in apartments - Wood (%)
House heating fuel used in apartments - Solar energy (%)
House heating fuel used in apartments - Other fuel (%)
House heating fuel used in apartments - No fuel used (%)
Latest news about housing in Harrisburg, PA collected exclusively by city-data.com from local newspapers, TV, and radio stations
Median year house/condo built: 1938Median year apartment built: 1955Household type by relationship:
Households: 50,525
Male householders: 9,047 (4,899 living alone ), Female householders: 12,628 (3,976 living alone )4,724 spouses (4,536 opposite-sex spouses ), 1,805 unmarried partners , (1,602 opposite-sex unmarried partners ), 15,315 children (14,914 natural , 170 adopted , 231 stepchildren ), 1,759 grandchildren , 677 brothers or sisters , 584 parents , 105 foster children , 963 other relatives , 1,856 non-relatives In group quarters: 1,056
Size of family households: 5,252 2-persons , 2,730 3-persons , 1,339 4-persons , 969 5-persons , 290 6-persons , 257 7-or-more-persons .
Size of nonfamily households: 9,117 1-person , 2,054 2-persons , 248 3-persons , 76 4-persons , 35 5-persons , 27 6-persons .
4,475 married couples with children. single-parent households (1,071 men , 6,028 women ).
78.2% of residents of Harrisburg speak English at home. of residents speak Spanish at home (39% speak English very well , 28% speak English well , 24% speak English not well , 9% don't speak English at all ).of residents speak other Indo-European language at home (46% speak English very well , 43% speak English well , 10% speak English not well ).of residents speak Asian or Pacific Island language at home (44% speak English very well , 35% speak English well , 20% speak English not well , 2% don't speak English at all ).of residents speak other language at home (53% speak English very well , 37% speak English well , 9% speak English not well , 1% don't speak English at all ).
Foreign born population: 5,091 (10.1%)of them are naturalized citizens )
Median number of rooms in houses and condos:
Median number of rooms in apartments
Owner-occupied Renter-occupied
Bedrooms in owner-occupied houses and condos in Harrisburg, Pennsylvania
55 no bedroom 201 1 bedroom 1,114 2 bedrooms 3,973 3 bedrooms 1,248 4 bedrooms 1,324 5+ bedrooms
Bedrooms in renter-occupied apartments in Harrisburg, Pennsylvania
1,268 no bedroom 4,336 1 bedroom 4,259 2 bedrooms 2,987 3 bedrooms 704 4 bedrooms 824 5+ bedrooms
Owner-occupied Renter-occupied
Rooms in owner-occupied houses in Harrisburg, Pennsylvania
0 1 room 11 2 rooms 141 3 rooms 521 4 rooms 805 5 rooms 2,214 6 rooms 1,180 7 rooms 1,768 8 rooms 1,274 9+ rooms
Rooms in renter-occupied apartments in Harrisburg, Pennsylvania
971 1 room 922 2 rooms 2,797 3 rooms 3,758 4 rooms 1,861 5 rooms 2,015 6 rooms 729 7 rooms 884 8 rooms 441 9+ rooms
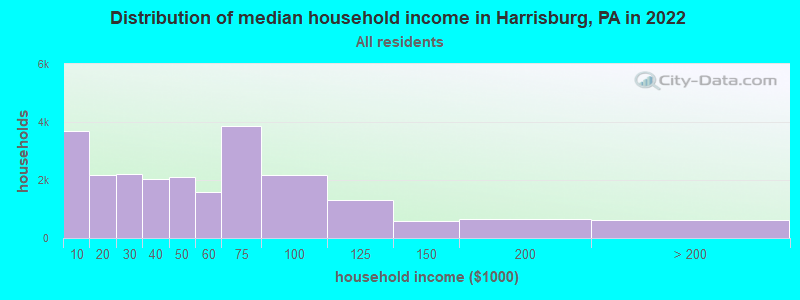
Harrisburg, PA household income distribution 3,700 Less than $10,0002,187 $10,000 to $19,9992,195 $20,000 to $29,9992,041 $30,000 to $39,9992,088 $40,000 to $49,9991,601 $50,000 to $59,9993,875 $60,000 to $74,9992,158 $75,000 to $99,9991,314 $100,000 to $124,999601 $125,000 to $149,999660 $150,000 to $199,999631 $200,000 or more
Home value of owner - occupied houses in 2022 in Harrisburg, PA 52 Less than $10,00075 $10,000 to $14,99962 $15,000 to $19,99941 $20,000 to $24,99920 $25,000 to $29,99964 $30,000 to $34,999136 $35,000 to $39,999176 $40,000 to $49,999190 $50,000 to $59,999357 $60,000 to $69,999318 $70,000 to $79,999853 $80,000 to $89,999468 $90,000 to $99,9991,137 $100,000 to $124,999623 $125,000 to $149,999734 $150,000 to $174,999413 $175,000 to $199,999572 $200,000 to $249,999375 $250,000 to $299,99996 $300,000 to $399,999131 $400,000 to $499,999244 $500,000 to $749,99942 $1,000,000 to $1,499,999Rent paid by renters in 2022 in Harrisburg, PA 555 Less than $100473 $100 to $149490 $150 to $19950 $200 to $249220 $250 to $299204 $300 to $349146 $350 to $39937 $400 to $449373 $450 to $499273 $500 to $549529 $550 to $599578 $600 to $6491,227 $650 to $699633 $700 to $7491,063 $750 to $7993,392 $800 to $8991,868 $900 to $9992,150 $1,000 to $1,249481 $1,250 to $1,499145 $1,500 to $1,999164 $2,000 to $2,499335 No cash rent
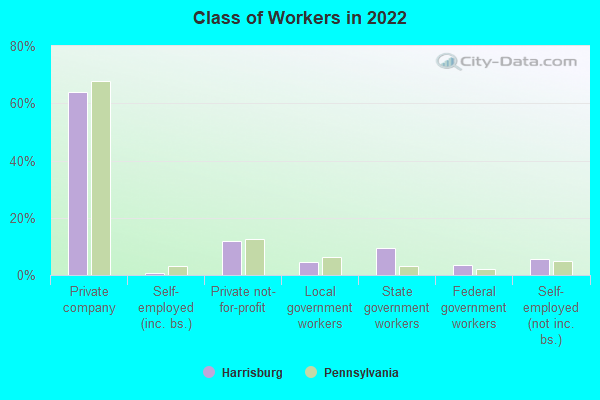
Percentage of workers working in this county: 77.0%Number of people working at home: 3,335 (14.7% of all workers )
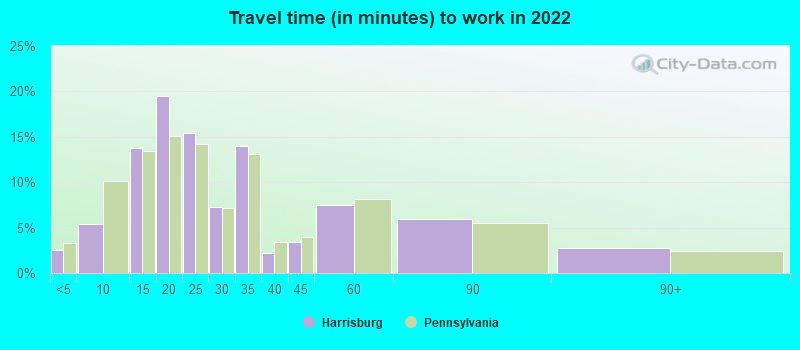
Travel time to work (commute)
Less than 5 minutes: 7005 to 9 minutes: 1,97510 to 14 minutes: 4,03115 to 19 minutes: 4,18920 to 24 minutes: 2,91725 to 29 minutes: 94330 to 34 minutes: 2,21235 to 39 minutes: 24340 to 44 minutes: 32545 to 59 minutes: 78060 to 89 minutes: 46090 or more minutes: 208
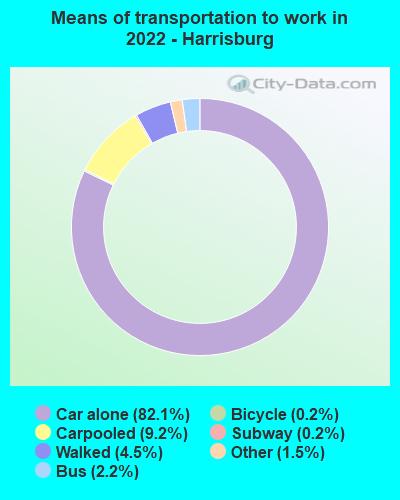
Means of transportation to work:
Drove a car alone: 36,933 (74.7%)Carpooled: 3,606 (7.3%)Bus : 982 (2.0%)Subway or elevated rail : 28 (0.1%)Long-distance train or commuter rail : 109 (0.2%)Light rail, streetcar or trolley : 14 (0.0%)Taxi: 897 (1.8%)Bicycle: 70 (0.1%)Walked: 2,163 (4.4%)Worked at home: 3,335 (6.7%)
Unemployment by race in 2022
Unemployment rate for White non-Hispanic residents 1.8% Males4.0% FemalesUnemployment rate for Black residents 16.4% Males19.4% FemalesUnemployment rate for Asian residents 0.9% MalesUnemployment rate for other race residents 0.9% Males4.1% FemalesUnemployment rate for two or more race residents 5.8% Males7.6% FemalesUnemployment rate for Hispanic or Latino residents 6.7% Males4.6% Females
Year of entry for the foreign-born population in Harrisburg, Pennsylvania
2,315 2010 or later 937 2000 to 2009 769 1990 to 1999 633 1980 to 1989 333 1970 to 1979 250 Before 1970
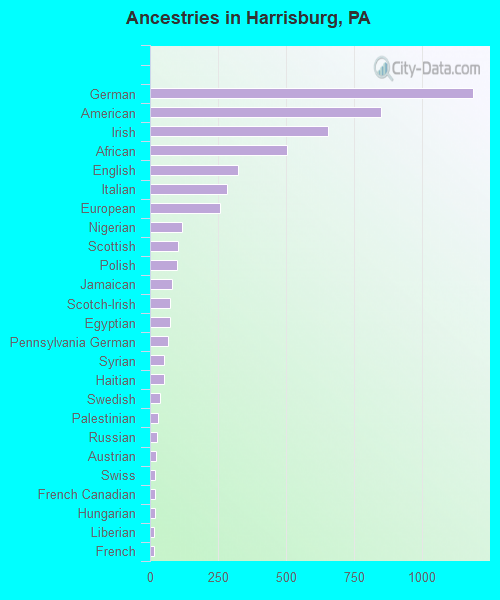
First ancestries reported:
German: 1,189 (4.6%)
American: 851 (3.3%)
Irish: 657 (2.5%)
African: 504 (1.9%)
English: 323 (1.2%)
Italian: 283 (1.1%)
European: 256 (1.0%)
Nigerian: 118 (0.5%)
Scottish: 104 (0.4%)
Polish: 100 (0.4%)
Jamaican: 80 (0.3%)
Scotch-Irish: 75 (0.3%)
Egyptian: 74 (0.3%)
Pennsylvania German: 66 (0.3%)
Syrian: 50 (0.2%)
Haitian: 50 (0.2%)
Swedish: 38 (0.1%)
Palestinian: 30 (0.1%)
Russian: 27 (0.1%)
Austrian: 22 (0.09%)
Swiss: 20 (0.08%)
French Canadian: 19 (0.07%)
Hungarian: 18 (0.07%)
Liberian: 16 (0.06%)
French: 15 (0.06%)
Greek: 15 (0.06%)
Slavic: 14 (0.05%)
Carpatho Rusyn: 13 (0.05%)
Ukrainian: 12 (0.05%)
British West Indian: 12 (0.05%)
Eastern European: 11 (0.04%)
West Indian: 11 (0.04%)
Serbian: 10 (0.04%)
Iranian: 10 (0.04%)
German Russian: 8 (0.03%)
Northern European: 5 (0.02%)
British: 4 (0.02%)
Israeli: 4 (0.02%)
Scandinavian: 3 (0.01%) Most common places of birth for foreign-born residents (%): Dominican Republic Harrisburg:
42.3% (1,845)Pennsylvania:
9.2% (86,544)
Other Western Africa Harrisburg:
6.4% (278)Pennsylvania:
0.5% (5,099)
Peru Harrisburg:
4.3% (187)Pennsylvania:
0.7% (6,690)
Vietnam Harrisburg:
4.2% (184)Pennsylvania:
3.3% (31,542)
Nigeria Harrisburg:
3.8% (165)Pennsylvania:
1.1% (10,709)
Other Middle Africa Harrisburg:
3.5% (154)Pennsylvania:
0.1% (1,090)
Pakistan Harrisburg:
3.4% (149)Pennsylvania:
1.2% (11,211)
Cambodia Harrisburg:
3.0% (131)Pennsylvania:
1.0% (9,386)
Africa, n.e.c. Harrisburg:
2.8% (123)Pennsylvania:
0.6% (5,479)
Nepal Harrisburg:
2.7% (118)Pennsylvania:
0.7% (6,855)
India Harrisburg:
2.6% (113)Pennsylvania:
10.7% (100,596)
Philippines Harrisburg:
2.2% (97)Pennsylvania:
2.2% (21,039)
Ecuador Harrisburg:
2.1% (90)Pennsylvania:
1.1% (10,035)
Sierra Leone Harrisburg:
1.8% (80)Pennsylvania:
0.4% (3,949)
Mexico Harrisburg:
1.7% (76)Pennsylvania:
5.8% (54,190)
Egypt Harrisburg:
1.6% (68)Pennsylvania:
0.8% (7,272)
Place of birth for U.S.-born residents:
This state: 29,232Other state: 12,559Northeast: 4,594Midwest: 1,088South: 6,059West: 838 80.5% of Harrisburg residents lived in the same house 1 years ago.
Out of people who lived in different houses, 29.2% lived in this county.
Out of people who lived in different counties, 59.9% lived in Pennsylvania.
Harrisburg:
80.5%State average:
89.3%
Education attainment for males 25 years and older:
No schooling: 71Nursery to 4th grade: 1555th and 6th grade: 567th and 8th grade: 3219th grade: 6610th grade: 22611th grade: 40012th grade, no diploma: 501High school graduate (or equivalency): 5,234Less than 1 year of college: 937Some college more than 1 year, no degree: 1,864Associate degree: 724Bachelor's degree: 2,638Master's degree: 1,007Professional school degree: 326Doctorate degree: 172
Education attainment for females 25 years and older:
No schooling: 361Nursery to 4th grade: 495th and 6th grade: 1077th and 8th grade: 2989th grade: 64910th grade: 33811th grade: 26112th grade, no diploma: 312High school graduate (or equivalency): 5,757Less than 1 year of college: 772Some college more than 1 year, no degree: 2,170Associate degree: 1,460Bachelor's degree: 2,157Master's degree: 1,142Professional school degree: 555Doctorate degree: 202
Housing units in structures:
One, detached: 3,272One, attached: 11,066Two: 1,7833 or 4: 1,6485 to 9: 2,03510 to 19: 1,29620 to 49: 84050 or more: 2,503Mobile homes: 172Housing units lacking complete plumbing facilities in 2022: 2.1%Housing units lacking complete kitchen facilities in 2022: 3.0%House/condo owner moved in on average 13 years ago
Renter moved in on average 3 years ago
Private vs. public school enrollment:
Students in private schools in grades 1 to 8 (elementary and middle school): 1,697 Here:
27.6%Pennsylvania:
15.7%
Students in private schools in grades 9 to 12 (high school): 594 Here:
22.9%Pennsylvania:
13.4%
Students in private undergraduate colleges: 724 Here:
35.7%Pennsylvania:
39.8%