Hammonton, NJ (New Jersey) Houses and Residents
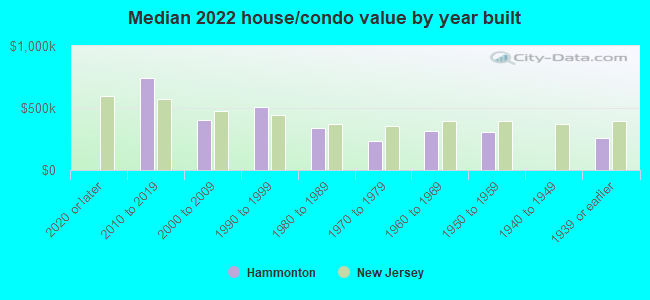
Estimated median house or condo value in 2022: $338,254 (it was $124,300 in 2000 )
Hammonton:
$338,254New Jersey:
$428,900
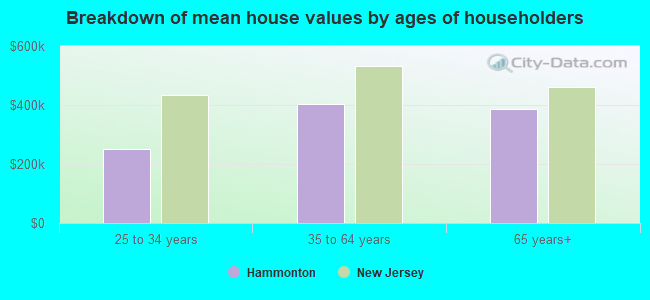
Lower value quartile - upper value quartile: $233,246 - $432,637Mean price in 2022: Detached houses: $329,318 Here:
$329,318State:
$537,591
Townhouses or other attached units: $280,805 Here:
$280,805State:
$381,113
In 3-to-4-unit structures: $206,144 Here:
$206,144State:
$457,463
In 5-or-more-unit structures: $133,131 Here:
$133,131State:
$368,745
Total population: 14,765 (Urban population: 9,886 (all inside urban clusters), Rural population: 2,718 (119 farm, 2,599 nonfarm ))
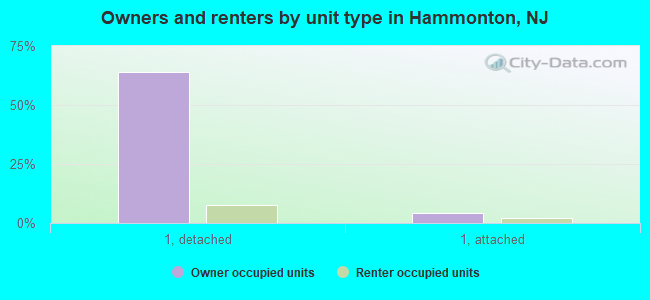
Houses: 6,376 (5,767 occupied: 4,323 owner occupied, 1,445 renter occupied )
% of renters here:
25%State:
35%
Housing density: 155 houses/condos per square mile
Median price asked for vacant for-sale houses and condos in 2022: $3,305,855.
Median contract rent in 2022: $1,230 (lower quartile is $908, upper quartile is $1,610)
Median rent asked for vacant for-rent units in 2022: $699
Median gross rent in Hammonton, NJ in 2022: $1,399
Housing units in Hammonton with a mortgage: 2,455 (147 second mortgage, 0 home equity loan, 165 both second mortgage and home equity loan )Houses without a mortgage: 119
Median household income for houses/condos with a mortgage: $122,367
Median household income for apartments without a mortgage: $51,375
Median monthly housing costs: $1,504
Data:
Median house or condo value ($)
Median house or condo value ($ change since 2000)
Median house or condo value ($) - White
Median house or condo value ($) - Black or African American
Median house or condo value ($) - Asian
Median house or condo value ($) - Hispanic or Latino
Median house or condo value ($) - American Indian and Alaska Native
Median house or condo value ($) - Multirace
Median house or condo value ($) - Other Race
Median price asked for mobile homes ($)
Household density (households per square mile)
Mean house or condo value by units in structure - 1, detached ($)
Mean house or condo value by units in structure - 1, attached ($)
Mean house or condo value by units in structure - 2 ($)
Mean house or condo value by units in structure by units in structure - 3 or 4 ($)
Mean house or condo value by units in structure - 5 or more ($)
Mean house or condo value by units in structure - Boat, RV, van, etc. ($)
Mean house or condo value by units in structure - Mobile home ($)
Median contract rent ($)
Median contract rent - Lower quartile ($)
Median contract rent - Upper quartile ($)
Median gross rent ($)
Urban houses (%)
Rural houses (%)
Houses occupied (%)
Houses occupied (% change since 2000)
Houses owner occupied (%)
Houses owner occupied (% change since 2000)
Houses renter occupied (%)
Houses renter occupied (% change since 2000)
Vacant housing units - For rent (%)
Vacant housing units - For rent (% change since 2000)
Vacant housing units - For sale only (%)
Vacant housing units - For sale only (% change since 2000)
Vacant housing units - Rented or sold, not occupied (%)
Vacant housing units - Rented or sold, not occupied (% change since 2000)
Vacant housing units - For seasonal, recreational, or occasional use (%)
Vacant housing units - For seasonal, recreational, or occasional use (% change since 2000)
Vacant housing units - For migrant workers (%)
Vacant housing units - For migrant workers (% change since 2000)
Vacant housing units - Other vacant (%)
Vacant housing units - Other vacant (% change since 2000)
Median monthly housing costs ($)
Median household income for houses/condos with a mortgage ($)
Median household income for houses/condos without a mortgage ($)
Median household income ($)
Median household income ($) - White
Median household income ($) - Black or African American
Median household income ($) - Asian
Median household income ($) - Hispanic or Latino
Median household income ($) - American Indian and Alaska Native
Median household income ($) - Multirace
Median household income ($) - Other Race
Mortgage status - with mortgage (%)
Mortgage status - with second mortgage (%)
Mortgage status - with home equity loan (%)
Mortgage status - with both second mortgage and home equity loan (%)
Mortgage status - without a mortgage (%)
Median year house/condo built
Median year apartment built
Household type by relationship - Male householder living alone (%)
Household type by relationship - Male householder not living alone (%)
Household type by relationship - Female householder living alone (%)
Household type by relationship - Female householder not living alone (%)
Household type by relationship - Opposite-Sex spouse (%)
Household type by relationship - Same-Sex spouse (%)
Household type by relationship - Opposite-Sex unmarried partner (%)
Household type by relationship - Same-Sex unmarried partner (%)
Household type by relationship - In group quarters (%)
Size of family households - 2-person household (%)
Size of family households - 3-person household (%)
Size of family households - 4-person household (%)
Size of family households - 5-person household (%)
Size of family households - 6-person household (%)
Size of family households - 7-or-more-person household (%)
Size of nonfamily households - 1-person household (%)
Size of nonfamily households - 2-person household (%)
Size of nonfamily households - 3-person household (%)
Size of nonfamily households - 4-person household (%)
Size of nonfamily households - 5-person household (%)
Size of nonfamily households - 6-person household (%)
Size of nonfamily households - 7-or-moreperson household (%)
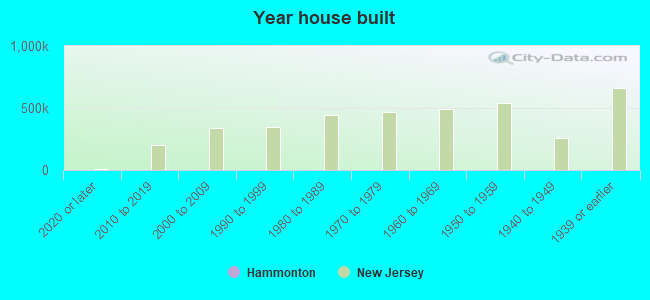
Year house built - Built 2010 or later (%)
Year house built - Built 2000 to 2009 (%)
Year house built - Built 1990 to 1999 (%)
Year house built - Built 1980 to 1989 (%)
Year house built - Built 1970 to 1979 (%)
Year house built - Built 1960 to 1969 (%)
Year house built - Built 1950 to 1959 (%)
Year house built - Built 1940 to 1949 (%)
Year house built - Built 1939 or earlier (%)
Median number of rooms in houses and condos
Median number of rooms in apartments
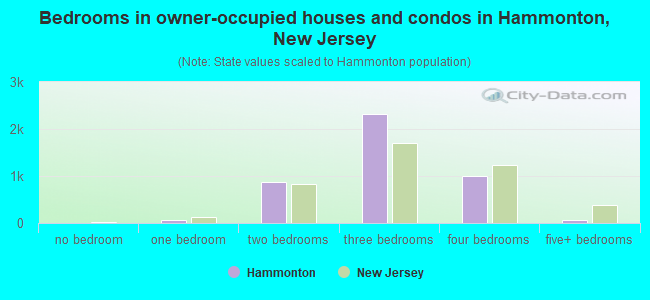
Median number of bedrooms in owner occupied houses
Mean number of bedrooms in owner occupied houses
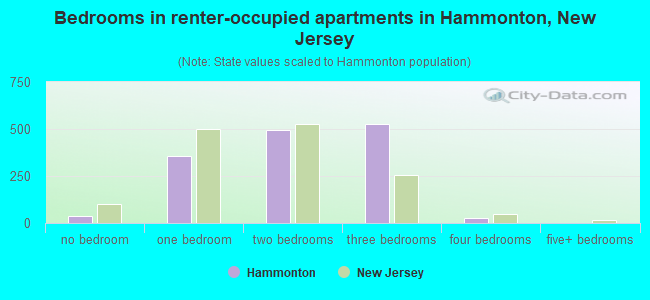
Median number of bedrooms in renter occupied houses
Mean number of bedrooms in renter occupied houses
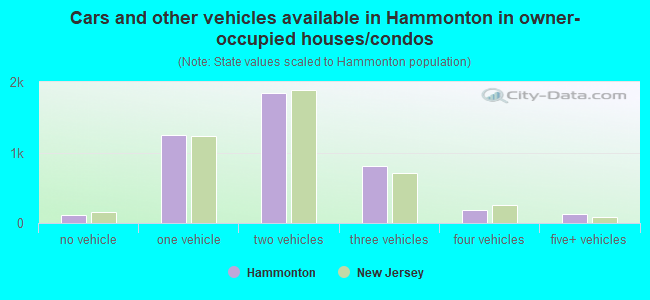
Median number of vehichles in owner occupied houses
Mean number of vehichles in owner occupied houses
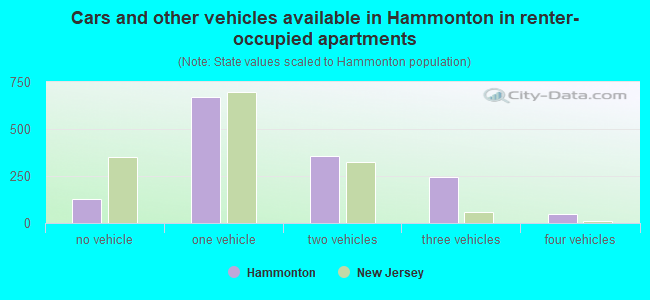
Median number of vehichles in renter occupied houses
Mean number of vehichles in renter occupied houses
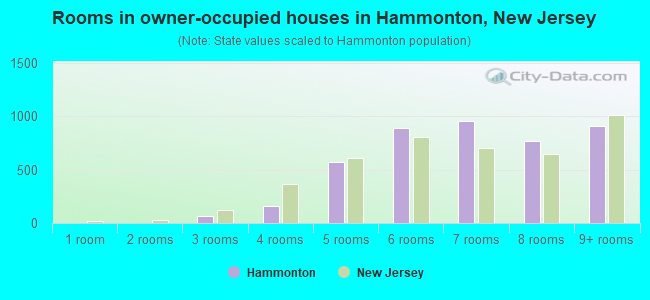
Rooms in owner-occupied houses - 1 room (%)
Rooms in owner-occupied houses - 2 rooms (%)
Rooms in owner-occupied houses - 3 rooms (%)
Rooms in owner-occupied houses - 4 rooms (%)
Rooms in owner-occupied houses - 5 rooms (%)
Rooms in owner-occupied houses - 6 rooms (%)
Rooms in owner-occupied houses - 7 rooms (%)
Rooms in owner-occupied houses - 8 rooms (%)
Rooms in owner-occupied houses - 9+ rooms (%)
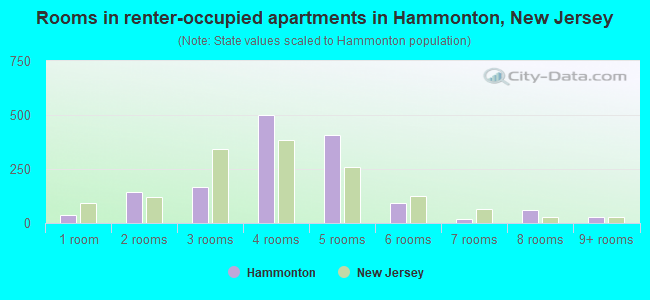
Rooms in renter-occupied houses - 1 room (%)
Rooms in renter-occupied houses - 2 rooms (%)
Rooms in renter-occupied houses - 3 rooms (%)
Rooms in renter-occupied houses - 4 rooms (%)
Rooms in renter-occupied houses - 5 rooms (%)
Rooms in renter-occupied houses - 6 rooms (%)
Rooms in renter-occupied houses - 7 rooms (%)
Rooms in renter-occupied houses - 8 rooms (%)
Rooms in renter-occupied houses - 9+ rooms (%)
Bedrooms in owner-occupied houses - no bedrooms (%)
Bedrooms in owner-occupied houses - 1 bedroom (%)
Bedrooms in owner-occupied houses - 2 bedrooms (%)
Bedrooms in owner-occupied houses - 3 bedrooms (%)
Bedrooms in owner-occupied houses - 4 bedrooms (%)
Bedrooms in owner-occupied houses - 5+ bedrooms (%)
Bedrooms in renter-occupied houses - no bedrooms (%)
Bedrooms in renter-occupied houses - 1 bedroom (%)
Bedrooms in renter-occupied houses - 2 bedrooms (%)
Bedrooms in renter-occupied houses - 3 bedrooms (%)
Bedrooms in renter-occupied houses - 4 bedrooms (%)
Bedrooms in renter-occupied houses - 5+ bedrooms (%)
Vehicles available in owner-occupied houses - no vehicle available (%)
Vehicles available in owner-occupied houses - 1 vehicle available(%)
Vehicles available in owner-occupied houses - 2 Vehicles available (%)
Vehicles available in owner-occupied houses - 3 Vehicles available (%)
Vehicles available in owner-occupied houses - 4 Vehicles available (%)
Vehicles available in owner-occupied houses - 5+ Vehicles available (%)
Vehicles available in renter-occupied houses - no vehicle available (%)
Vehicles available in renter-occupied houses - 1 vehicle available (%)
Vehicles available in renter-occupied houses - 2 Vehicles available (%)
Vehicles available in renter-occupied houses - 3 Vehicles available (%)
Vehicles available in renter-occupied houses - 4 Vehicles available (%)
Vehicles available in renter-occupied houses - 5+ Vehicles available (%)
Housing units in structures - 1, detached (%)
Housing units in structures - 1, attached (%)
Housing units in structures - 2 (%)
Housing units in structures - 3 or 4 (%)
Housing units in structures - 5 to 9 (%)
Housing units in structures - 10 to 19 (%)
Housing units in structures - 20 to 49 (%)
Housing units in structures - 50 or more (%)
Housing units in structures - Mobile home (%)
Housing units in structures - Boat, RV, van, etc. (%)
Housing units in structures - Owners - 1, detached (%)
Housing units in structures - Owners - 1, attached (%)
Housing units in structures - Owners - 2 (%)
Housing units in structures - Owners - 3 or 4 (%)
Housing units in structures - Owners - 5 to 9 (%)
Housing units in structures - Owners - 10 to 19 (%)
Housing units in structures - Owners - 20 to 49 (%)
Housing units in structures - Owners - 50 or more (%)
Housing units in structures - Owners - Mobile home (%)
Housing units in structures - Owners - Boat, RV, van, etc. (%)
Housing units in structures - Renters - 1, detached (%)
Housing units in structures - Renters - 1, attached (%)
Housing units in structures - Renters - 2 (%)
Housing units in structures - Renters - 3 or 4 (%)
Housing units in structures - Renters - 5 to 9 (%)
Housing units in structures - Renters - 10 to 19 (%)
Housing units in structures - Renters - 20 to 49 (%)
Housing units in structures - Renters - 50 or more (%)
Housing units in structures - Renters - Mobile home (%)
Housing units in structures - Renters - Boat, RV, van, etc. (%)
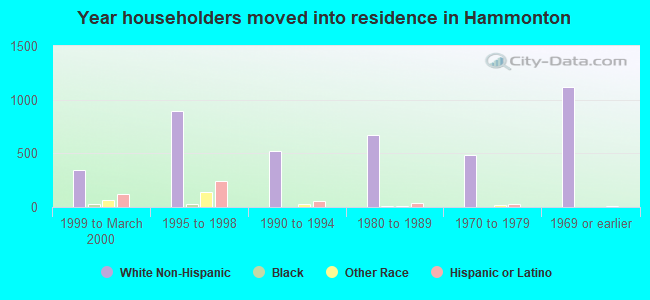
House/condo owner moved in on average (years ago)
Renter moved in on average (years ago)
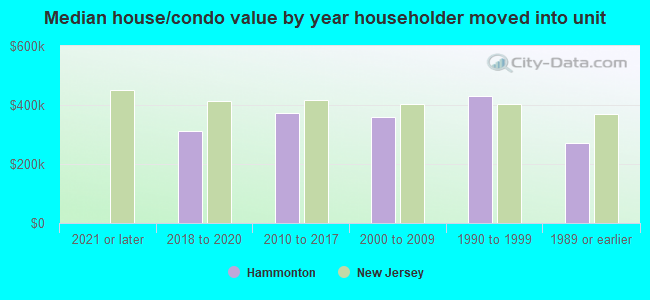
Year householder moved into unit - Moved in 1999 to March 2000 (%)
Year householder moved into unit - Moved in 1999 to March 2000 (%) - White
Year householder moved into unit - Moved in 1999 to March 2000 (%) - Black or African American
Year householder moved into unit - Moved in 1999 to March 2000 (%) - Asian
Year householder moved into unit - Moved in 1999 to March 2000 (%) - Hispanic or Latino
Year householder moved into unit - Moved in 1999 to March 2000 (%) - American Indian and Alaska Native
Year householder moved into unit - Moved in 1999 to March 2000 (%) - Multirace
Year householder moved into unit - Moved in 1999 to March 2000 (%) - Other Race
Year householder moved into unit - Moved in 1995 to 1998 (%)
Year householder moved into unit - Moved in 1995 to 1998 (%) - White
Year householder moved into unit - Moved in 1995 to 1998 (%) - Black or African American
Year householder moved into unit - Moved in 1995 to 1998 (%) - Asian
Year householder moved into unit - Moved in 1995 to 1998 (%) - Hispanic or Latino
Year householder moved into unit - Moved in 1995 to 1998 (%) - American Indian and Alaska Native
Year householder moved into unit - Moved in 1995 to 1998 (%) - Multirace
Year householder moved into unit - Moved in 1995 to 1998 (%) - Other Race
Year householder moved into unit - Moved in 1990 to 1994 (%)
Year householder moved into unit - Moved in 1990 to 1994 (%) - White
Year householder moved into unit - Moved in 1990 to 1994 (%) - Black or African American
Year householder moved into unit - Moved in 1990 to 1994 (%) - Asian
Year householder moved into unit - Moved in 1990 to 1994 (%) - Hispanic or Latino
Year householder moved into unit - Moved in 1990 to 1994 (%) - American Indian and Alaska Native
Year householder moved into unit - Moved in 1990 to 1994 (%) - Multirace
Year householder moved into unit - Moved in 1990 to 1994 (%) - Other Race
Year householder moved into unit - Moved in 1980 to 1989 (%)
Year householder moved into unit - Moved in 1980 to 1989 (%) - White
Year householder moved into unit - Moved in 1980 to 1989 (%) - Black or African American
Year householder moved into unit - Moved in 1980 to 1989 (%) - Asian
Year householder moved into unit - Moved in 1980 to 1989 (%) - Hispanic or Latino
Year householder moved into unit - Moved in 1980 to 1989 (%) - American Indian and Alaska Native
Year householder moved into unit - Moved in 1980 to 1989 (%) - Multirace
Year householder moved into unit - Moved in 1980 to 1989 (%) - Other Race
Year householder moved into unit - Moved in 1970 to 1979 (%)
Year householder moved into unit - Moved in 1970 to 1979 (%) - White
Year householder moved into unit - Moved in 1970 to 1979 (%) - Black or African American
Year householder moved into unit - Moved in 1970 to 1979 (%) - Asian
Year householder moved into unit - Moved in 1970 to 1979 (%) - Hispanic or Latino
Year householder moved into unit - Moved in 1970 to 1979 (%) - American Indian and Alaska Native
Year householder moved into unit - Moved in 1970 to 1979 (%) - Multirace
Year householder moved into unit - Moved in 1970 to 1979 (%) - Other Race
Year householder moved into unit - Moved in 1969 or earlier (%)
Year householder moved into unit - Moved in 1969 or earlier (%) - White
Year householder moved into unit - Moved in 1969 or earlier (%) - Black or African American
Year householder moved into unit - Moved in 1969 or earlier (%) - Asian
Year householder moved into unit - Moved in 1969 or earlier (%) - Hispanic or Latino
Year householder moved into unit - Moved in 1969 or earlier (%) - American Indian and Alaska Native
Year householder moved into unit - Moved in 1969 or earlier (%) - Multirace
Year householder moved into unit - Moved in 1969 or earlier (%) - Other Race
Housing units lacking complete plumbing facilities (%)
Housing units lacking complete kitchen facilities (%)
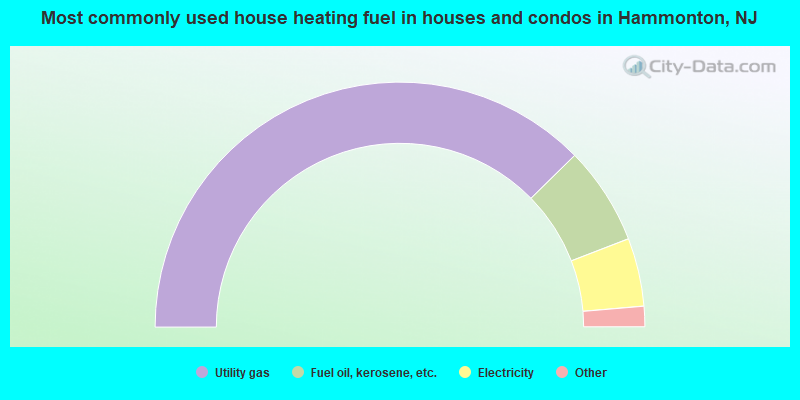
House heating fuel used in houses and condos - Utility gas (%)
House heating fuel used in houses and condos - Bottled, tank, or LP gas (%)
House heating fuel used in houses and condos - Electricity (%)
House heating fuel used in houses and condos - Fuel oil, kerosene, etc. (%)
House heating fuel used in houses and condos - Coal or coke (%)
House heating fuel used in houses and condos - Wood (%)
House heating fuel used in houses and condos - Solar energy (%)
House heating fuel used in houses and condos - Other fuel (%)
House heating fuel used in houses and condos - No fuel used (%)
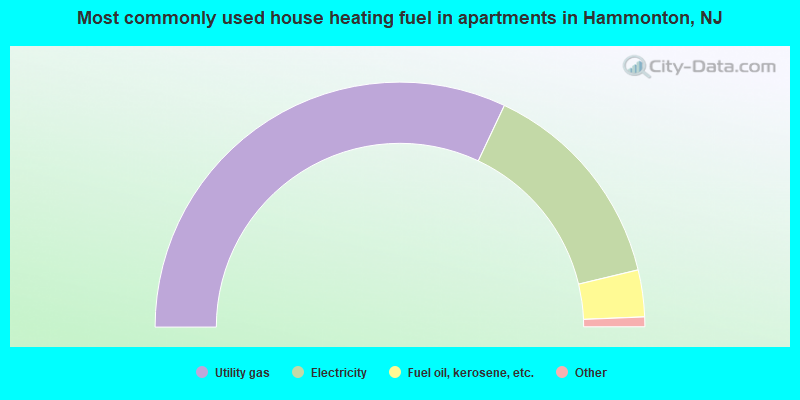
House heating fuel used in apartments - Utility gas (%)
House heating fuel used in apartments - Bottled, tank, or LP gas (%)
House heating fuel used in apartments - Electricity (%)
House heating fuel used in apartments - Fuel oil, kerosene, etc. (%)
House heating fuel used in apartments - Coal or coke (%)
House heating fuel used in apartments - Wood (%)
House heating fuel used in apartments - Solar energy (%)
House heating fuel used in apartments - Other fuel (%)
House heating fuel used in apartments - No fuel used (%)
Latest news about housing in Hammonton, NJ collected exclusively by city-data.com from local newspapers, TV, and radio stations
Median year house/condo built: 1976Median year apartment built: 1967Household type by relationship:
Households: 14,801
Male householders: 2,939 (780 living alone ), Female householders: 2,838 (645 living alone )2,693 spouses (2,693 opposite-sex spouses ), 635 unmarried partners , (635 opposite-sex unmarried partners ), 4,080 children (3,937 natural , 32 adopted , 110 stepchildren ), 27 grandchildren , 121 brothers or sisters , 201 parents , 0 foster children , 311 other relatives , 496 non-relatives In group quarters: 455
Size of family households: 1,744 2-persons , 676 3-persons , 1,031 4-persons , 352 5-persons , 83 6-persons .
Size of nonfamily households: 1,381 1-person , 265 2-persons , 154 3-persons , 35 4-persons .
2,073 married couples with children. single-parent households (176 men , 530 women ).
75.8% of residents of Hammonton speak English at home. of residents speak Spanish at home (65% speak English very well , 15% speak English well , 9% speak English not well , 11% don't speak English at all ).of residents speak other Indo-European language at home (86% speak English very well , 12% speak English well , 2% speak English not well ).of residents speak Asian or Pacific Island language at home (34% speak English very well , 62% speak English well , 3% speak English not well ).of residents speak other language at home (100% speak English very well ).
Foreign born population: 1,395 (9.4%)of them are naturalized citizens )
Median number of rooms in houses and condos:
Median number of rooms in apartments
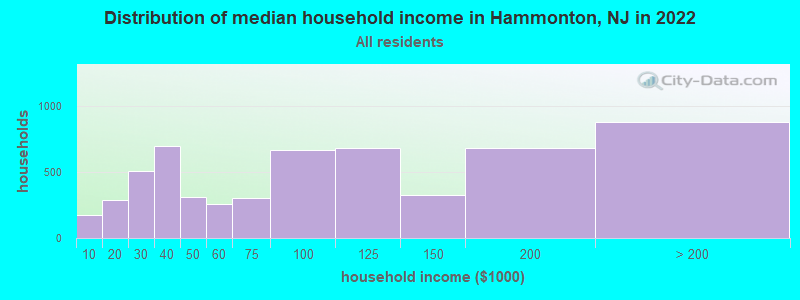
Hammonton, NJ household income distribution 177 Less than $10,000290 $10,000 to $19,999512 $20,000 to $29,999696 $30,000 to $39,999313 $40,000 to $49,999261 $50,000 to $59,999305 $60,000 to $74,999672 $75,000 to $99,999686 $100,000 to $124,999325 $125,000 to $149,999683 $150,000 to $199,999881 $200,000 or more
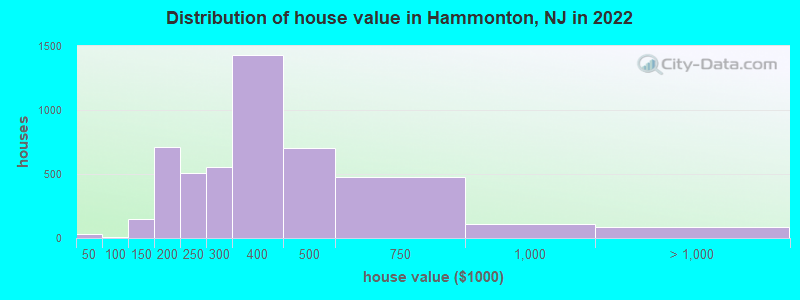
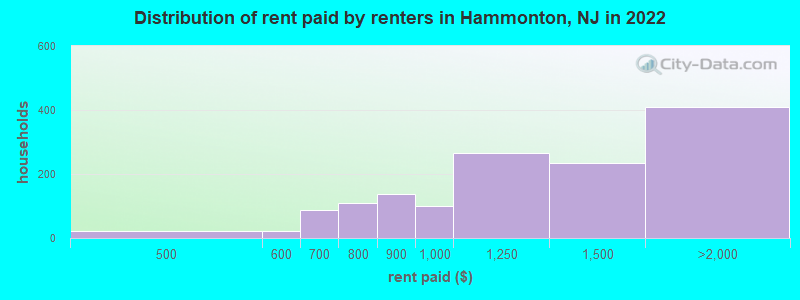
Home value of owner - occupied houses in 2022 in Hammonton, NJ 29 Less than $10,0004 $20,000 to $24,9999 $90,000 to $99,99926 $100,000 to $124,999123 $125,000 to $149,999240 $150,000 to $174,999468 $175,000 to $199,999507 $200,000 to $249,999551 $250,000 to $299,9991,426 $300,000 to $399,999702 $400,000 to $499,999472 $500,000 to $749,999106 $750,000 to $999,99962 $1,000,000 to $1,499,99919 $2,000,000 or moreRent paid by renters in 2022 in Hammonton, NJ 12 $400 to $4498 $450 to $49921 $550 to $59988 $650 to $69912 $700 to $74996 $750 to $799137 $800 to $89998 $900 to $999267 $1,000 to $1,249233 $1,250 to $1,499407 $1,500 to $1,999
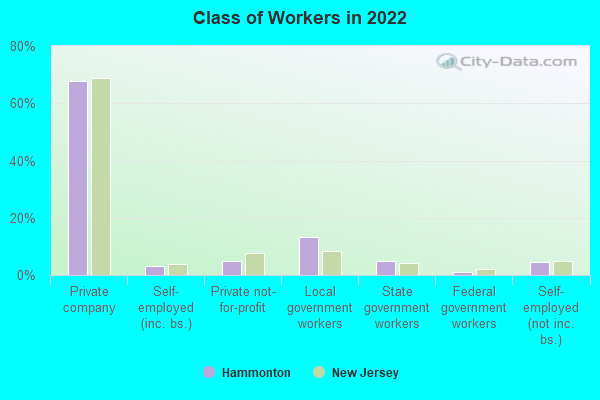
Percentage of workers working in this county: 63.3%Number of people working at home: 777 (10.5% of all workers )
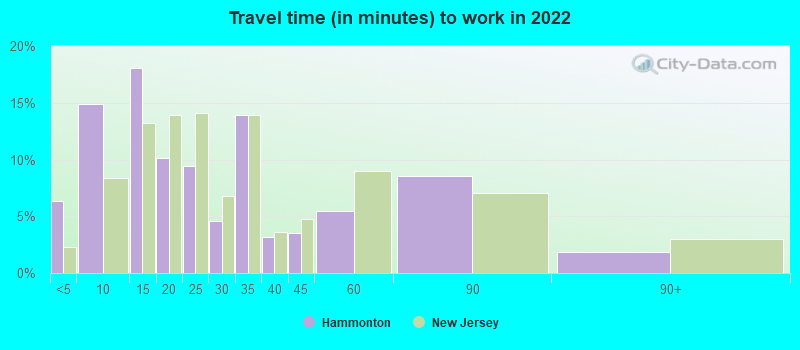
Travel time to work (commute)
Less than 5 minutes: 4025 to 9 minutes: 1,08710 to 14 minutes: 66115 to 19 minutes: 36720 to 24 minutes: 25825 to 29 minutes: 47630 to 34 minutes: 1,20735 to 39 minutes: 20340 to 44 minutes: 43345 to 59 minutes: 84360 to 89 minutes: 45990 or more minutes: 165
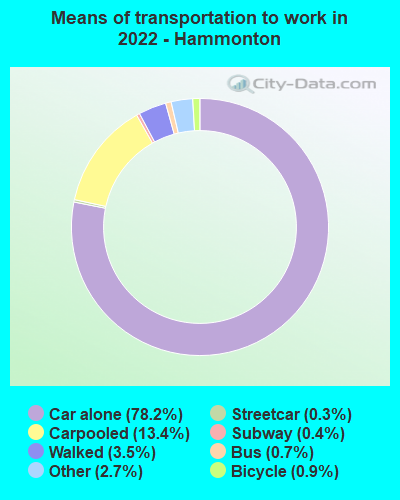
Means of transportation to work:
Drove a car alone: 5,133 (68.5%)Carpooled: 994 (13.3%)Bus : 42 (0.6%)Subway or elevated rail : 17 (0.2%)Long-distance train or commuter rail : 22 (0.3%)Taxi: 203 (2.7%)Bicycle: 57 (0.8%)Walked: 252 (3.4%)Worked at home: 777 (10.4%)
Unemployment by race in 2022
Unemployment rate for White non-Hispanic residents 7.2% Males2.4% FemalesUnemployment rate for Black residents 28.5% FemalesUnemployment rate for other race residents 3.4% Males23.1% FemalesUnemployment rate for two or more race residents 1.8% MalesUnemployment rate for Hispanic or Latino residents 2.8% Males14.1% Females
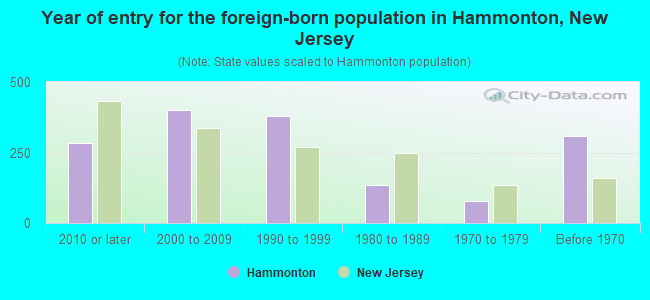
Year of entry for the foreign-born population in Hammonton, New Jersey
284 2010 or later 399 2000 to 2009 380 1990 to 1999 135 1980 to 1989 77 1970 to 1979 307 Before 1970
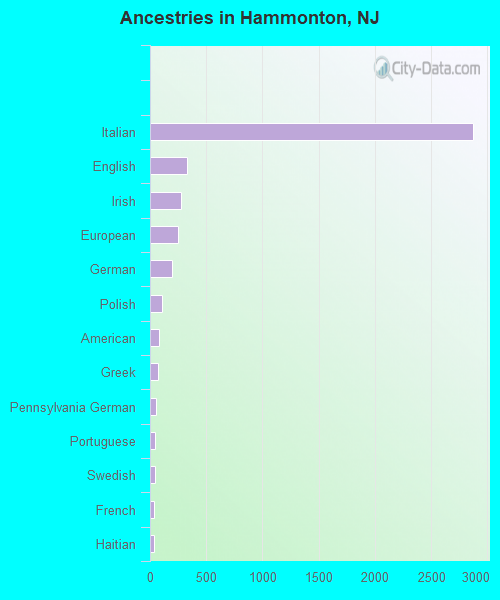
First ancestries reported:
Italian: 2,872 (36.9%)
English: 330 (4.2%)
Irish: 277 (3.6%)
European: 251 (3.2%)
German: 200 (2.6%)
Polish: 107 (1.4%)
American: 78 (1.0%)
Greek: 69 (0.9%)
Pennsylvania German: 52 (0.7%)
Portuguese: 45 (0.6%)
Swedish: 42 (0.5%)
French: 38 (0.5%)
Haitian: 38 (0.5%)
British: 16 (0.2%)
Austrian: 12 (0.2%)
Czech: 12 (0.2%)
Ukrainian: 12 (0.2%)
Croatian: 11 (0.1%)
Dutch: 10 (0.1%)
Maltese: 9 (0.1%)
Eastern European: 8 (0.1%)
Nigerian: 8 (0.1%)
Russian: 7 (0.09%)
Swiss: 7 (0.09%)
French Canadian: 6 (0.08%)
Scottish: 5 (0.06%)
Guyanese: 4 (0.05%) Most common places of birth for foreign-born residents (%): Mexico Hammonton:
62.7% (961)New Jersey:
4.8% (102,527)
Guatemala Hammonton:
8.0% (123)New Jersey:
2.2% (46,813)
Philippines Hammonton:
3.8% (59)New Jersey:
4.0% (85,934)
Japan Hammonton:
3.5% (53)New Jersey:
0.5% (10,042)
Germany Hammonton:
2.8% (43)New Jersey:
0.8% (17,217)
Dominican Republic Hammonton:
2.4% (37)New Jersey:
9.7% (209,055)
Cuba Hammonton:
2.2% (33)New Jersey:
2.1% (45,435)
Portugal Hammonton:
2.0% (31)New Jersey:
1.3% (28,871)
Haiti Hammonton:
1.7% (26)New Jersey:
2.3% (49,491)
Italy Hammonton:
1.6% (24)New Jersey:
1.5% (33,198)
Place of birth for U.S.-born residents:
This state: 9,534Other state: 2,926Northeast: 2,196Midwest: 183South: 473West: 34 95.0% of Hammonton residents lived in the same house 1 years ago.
Out of people who lived in different houses, 46.4% lived in this county.
Out of people who lived in different counties, 69.8% lived in New Jersey.
Hammonton:
95.0%State average:
90.4%
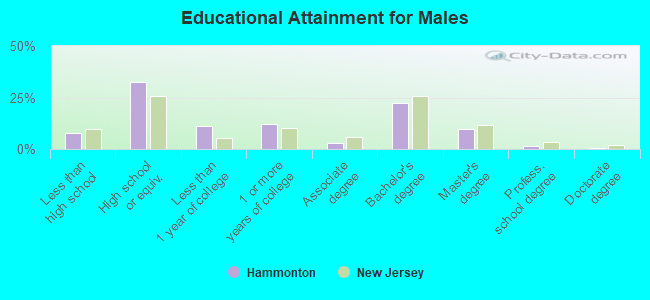
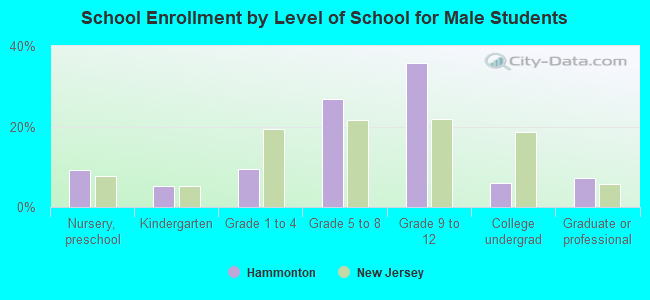
Education attainment for males 25 years and older:
No schooling: 75Nursery to 4th grade: 225th and 6th grade: 797th and 8th grade: 539th grade: 2610th grade: 6911th grade: 2112th grade, no diploma: 101High school graduate (or equivalency): 1,848Less than 1 year of college: 625Some college more than 1 year, no degree: 689Associate degree: 153Bachelor's degree: 1,248Master's degree: 539Professional school degree: 80Doctorate degree: 16
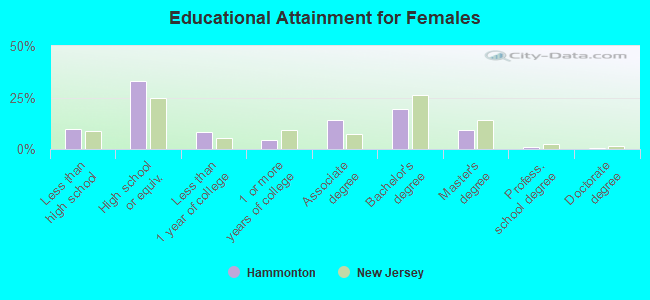
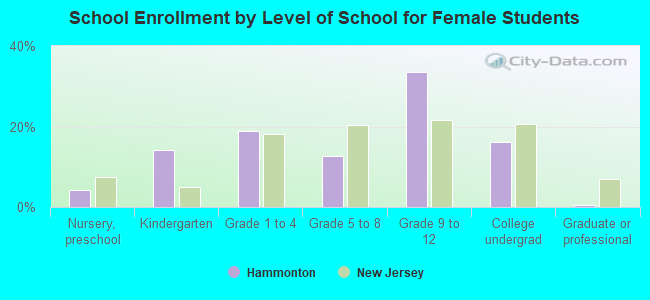
Education attainment for females 25 years and older:
No schooling: 213Nursery to 4th grade: 05th and 6th grade: 287th and 8th grade: 349th grade: 510th grade: 8611th grade: 12312th grade, no diploma: 35High school graduate (or equivalency): 1,762Less than 1 year of college: 445Some college more than 1 year, no degree: 237Associate degree: 737Bachelor's degree: 1,026Master's degree: 479Professional school degree: 58Doctorate degree: 31
Housing units in structures:
One, detached: 4,493One, attached: 434Two: 6783 or 4: 2335 to 9: 18010 to 19: 17320 to 49: 10750 or more: 58Mobile homes: 17Housing units lacking complete plumbing facilities in 2022: 0.4%Housing units lacking complete kitchen facilities in 2022: 1.2%House/condo owner moved in on average 18 years ago
Renter moved in on average 4 years ago
Private vs. public school enrollment:
Students in private schools in grades 1 to 8 (elementary and middle school): 85 Here:
8.4%New Jersey:
12.3%
Students in private schools in grades 9 to 12 (high school): 364 Here:
31.7%New Jersey:
13.1%
Students in private undergraduate colleges: 113 Here:
35.3%New Jersey:
33.2%