Hackettstown, NJ (New Jersey) Houses and Residents
| Hackettstown: | $363,083 |
| New Jersey: | $428,900 |
Mean price in 2022:
Detached houses: $418,442
Here: $418,442 State: $537,591 Townhouses or other attached units: $339,229
Here: $339,229 State: $381,113 In 2-unit structures: $361,374
Here: $361,374 State: $444,476
Total population: 9,551 (All urban)
Houses: 3,823 (3,721 occupied: 2,374 owner occupied, 1,418 renter occupied)
| % of renters here: | 37% |
| State: | 35% |
Housing density: 1,032 houses/condos per square mile
Median price asked for vacant for-sale houses and condos in 2022 in this county: $157,680.
Median contract rent in 2022: $1,344 (lower quartile is $1,131, upper quartile is $1,605)
Median rent asked for vacant for-rent units in 2022: $11,442
Median gross rent in Hackettstown, NJ in 2022: $1,455
Housing units in Hackettstown with a mortgage: 1,833 (131 second mortgage, 0 home equity loan, 111 both second mortgage and home equity loan)
Houses without a mortgage: 116
Median household income for houses/condos with a mortgage: $132,097
Median household income for apartments without a mortgage: $75,695
Median monthly housing costs: $1,582
Compare current foreclosures in Hackettstown, NJ:
| Photo | Address | Area | Beds / Baths | Price | Details |
|---|---|---|---|---|---|

|
#1
Indian Ln
Hackettstown, NJ 07840
|
1,196 sq. feet
|
1 baths 3 beds |
show details | |

|
#2
W Baldwin St
Hackettstown, NJ 07840
|
1,778 sq. feet
|
2 baths 3 beds |
show details | |

|
#3
Carnegie Ct
Hackettstown, NJ 07840
|
1,410 sq. feet
|
- baths - beds |
show details | |

|
#4
Marsh Hawk # 2
Hackettstown, NJ 07840
|
552 sq. feet
|
1 baths - beds |
show details | |

|
#5
Hurley Dr
Hackettstown, NJ 07840
|
1,668 sq. feet
|
- baths - beds |
show details | |

|
#6
Ajax Ct
Hackettstown, NJ 07840
|
984 sq. feet
|
- baths - beds |
show details | |

|
#7
Petersburg Rd
Hackettstown, NJ 07840
|
1,531 sq. feet
|
- baths - beds |
show details | |

|
#8
Mill St
Hackettstown, NJ 07840
|
- sq. feet
|
- baths - beds |
show details | |

|
#9
Rockport Rd
Hackettstown, NJ 07840
|
1,704 sq. feet
|
- baths - beds |
show details | |

|
#10
Old Allamuchy Rd # 8
Hackettstown, NJ 07840
|
- sq. feet
|
- baths - beds |
show details |
| Photo | Address | Area | Beds / Baths | Price | Details |
|---|---|---|---|---|---|

|
#11
Richard Dr
Hackettstown, NJ 07840
|
- sq. feet
|
- baths - beds |
show details | |

|
#12
Monroe St
Hackettstown, NJ 07840
|
1,431 sq. feet
|
- baths - beds |
show details | |

|
#13
Arthur Ter Apt E20
Hackettstown, NJ 07840
|
- sq. feet
|
- baths - beds |
show details | |

|
#14
Mansfield Vlg
Hackettstown, NJ 07840
|
- sq. feet
|
- baths - beds |
show details | |

|
#15
Barkers Mill Rd
Hackettstown, NJ 07840
|
1,420 sq. feet
|
- baths - beds |
show details | |

|
#16
Wild Iris Ln
Hackettstown, NJ 07840
|
- sq. feet
|
- baths - beds |
show details | |

|
#17
Old Allamuchy Rd # 3
Hackettstown, NJ 07840
|
- sq. feet
|
- baths - beds |
show details | |

|
#18
Lawrence Dr
Hackettstown, NJ 07840
|
1,044 sq. feet
|
- baths - beds |
show details | |

|
#19
Winding Hill Dr
Hackettstown, NJ 07840
|
2,166 sq. feet
|
- baths - beds |
show details | |

|
#20
Grand Ave
Hackettstown, NJ 07840
|
1,616 sq. feet
|
- baths - beds |
show details |
| Photo | Address | Area | Beds / Baths | Price | Details |
|---|---|---|---|---|---|

|
#21
Delbarton Ct
Hackettstown, NJ 07840
|
1,485 sq. feet
|
- baths - beds |
show details | |

|
#22
County Road 517
Hackettstown, NJ 07840
|
- sq. feet
|
- baths - beds |
show details | |

|
#23
Mission Rd
Hackettstown, NJ 07840
|
1,924 sq. feet
|
- baths - beds |
show details | |

|
#24
Mansfield Vlg
Hackettstown, NJ 07840
|
- sq. feet
|
- baths - beds |
show details | |

|
#25
Mansfield Vlg
Hackettstown, NJ 07840
|
- sq. feet
|
- baths - beds |
show details | |

|
#26
John St
Hackettstown, NJ 07840
|
2,030 sq. feet
|
- baths - beds |
show details | |

|
#27
Lafayette St
Hackettstown, NJ 07840
|
1,178 sq. feet
|
- baths - beds |
show details | |

|
#28
Canterbury Ln
Hackettstown, NJ 07840
|
2,604 sq. feet
|
- baths - beds |
show details | |

|
#29
Water St
Hackettstown, NJ 07840
|
- sq. feet
|
- baths - beds |
show details | |

|
#30
House Wren
Hackettstown, NJ 07840
|
4,264 sq. feet
|
- baths - beds |
show details |
| Photo | Address | Area | Beds / Baths | Price | Details |
|---|---|---|---|---|---|

|
#31
Arthur Ter
Hackettstown, NJ 07840
|
1,044 sq. feet
|
- baths - beds |
show details | |

|
#32
Monroe St
Hackettstown, NJ 07840
|
1,596 sq. feet
|
- baths - beds |
show details | |

|
#33
Hamilton Dr
Hackettstown, NJ 07840
|
2,046 sq. feet
|
- baths - beds |
show details | |

|
#34
Edinborough Ct
Hackettstown, NJ 07840
|
1,569 sq. feet
|
- baths - beds |
show details | |

|
#35
Pheasant Run
Hackettstown, NJ 07840
|
2,978 sq. feet
|
- baths - beds |
show details | |

|
#36
Willow Grove St
Hackettstown, NJ 07840
|
1,680 sq. feet
|
- baths - beds |
show details | |

|
#37
Catswamp Rd
Hackettstown, NJ 07840
|
2,202 sq. feet
|
- baths - beds |
show details | |

|
#38
Durham Ct
Hackettstown, NJ 07840
|
1,624 sq. feet
|
- baths - beds |
show details | |

|
#39
Winding Hill Dr
Hackettstown, NJ 07840
|
2,166 sq. feet
|
- baths - beds |
show details | |

|
#40
Ridge Rd
Hackettstown, NJ 07840
|
2,182 sq. feet
|
- baths - beds |
show details |
| Photo | Address | Area | Beds / Baths | Price | Details |
|---|---|---|---|---|---|

|
#41
Morgan Ter
Hackettstown, NJ 07840
|
2,292 sq. feet
|
- baths - beds |
show details | |

|
#42
Grand Ave
Hackettstown, NJ 07840
|
1,664 sq. feet
|
- baths - beds |
show details | |

|
#43
Route 157
Hackettstown, NJ 07840
|
- sq. feet
|
- baths - beds |
show details | |

|
#44
Winding Hill Dr
Hackettstown, NJ 07840
|
2,166 sq. feet
|
- baths - beds |
show details | |

|
#45
Hamilton Dr
Hackettstown, NJ 07840
|
2,046 sq. feet
|
- baths - beds |
show details | |

|
#46
Indigo Rd
Hackettstown, NJ 07840
|
- sq. feet
|
- baths - beds |
show details | |

|
#47
Willow Grove St
Hackettstown, NJ 07840
|
1,233 sq. feet
|
- baths - beds |
show details | |

|
#48
1st Ave
Hackettstown, NJ 07840
|
1,228 sq. feet
|
- baths - beds |
show details | |

|
#49
House Wren
Hackettstown, NJ 07840
|
2,780 sq. feet
|
- baths - beds |
show details | |

|
Check over 1 million property listings on Foreclosure.com!
|
browse all offers | |||

Latest news about housing in Hackettstown, NJ collected exclusively by city-data.com from local newspapers, TV, and radio stations


Median year apartment built: 1980
Household type by relationship:
Households: 10,220- Male householders: 1,905 (371 living alone), Female householders: 1,832 (595 living alone)
1,925 spouses (1,909 opposite-sex spouses), 250 unmarried partners, (236 opposite-sex unmarried partners), 2,995 children (2,722 natural, 42 adopted, 230 stepchildren), 41 grandchildren, 107 brothers or sisters, 121 parents, 0 foster children, 82 other relatives, 167 non-relatives
- In group quarters: 790
Size of family households: 1,133 2-persons, 620 3-persons, 709 4-persons, 262 5-persons, 26 6-persons, 11 7-or-more-persons.
Size of nonfamily households: 851 1-person, 194 2-persons, 1 5-persons.
1,183 married couples with children.
695 single-parent households (358 men, 337 women).
76.9% of residents of Hackettstown speak English at home.
15.8% of residents speak Spanish at home (52% speak English very well, 19% speak English well, 17% speak English not well, 12% don't speak English at all).
3.9% of residents speak other Indo-European language at home (78% speak English very well, 19% speak English well, 3% speak English not well).
3.1% of residents speak Asian or Pacific Island language at home (79% speak English very well, 15% speak English well, 7% speak English not well).
0.4% of residents speak other language at home (64% speak English very well, 36% speak English well).
Foreign born population: 1,992 (19.5%)
(42.3% of them are naturalized citizens)
| Here: | 7.3 |
| State: | 6.8 |
| Here: | 3.8 |
| State: | 3.9 |

- Bedrooms in owner-occupied houses and condos in Hackettstown, New Jersey
- 0no bedroom
- 391 bedroom
- 3712 bedrooms
- 9633 bedrooms
- 8704 bedrooms
- 1315+ bedrooms

- Bedrooms in renter-occupied apartments in Hackettstown, New Jersey
- 98no bedroom
- 5581 bedroom
- 4702 bedrooms
- 2113 bedrooms
- 814 bedrooms
- 05+ bedrooms

- Cars and other vehicles available in Hackettstown in owner-occupied houses/condos
- 48no vehicle
- 5571 vehicle
- 1,1502 vehicles
- 4153 vehicles
- 1574 vehicles
- 475+ vehicles

- Cars and other vehicles available in Hackettstown in renter-occupied apartments
- 153no vehicle
- 6481 vehicle
- 4072 vehicles
- 1303 vehicles
- 464 vehicles
- 345+ vehicles

- Rooms in owner-occupied houses in Hackettstown, New Jersey
- 01 room
- 122 rooms
- 133 rooms
- 714 rooms
- 2565 rooms
- 4366 rooms
- 5387 rooms
- 6038 rooms
- 4449+ rooms

- Rooms in renter-occupied apartments in Hackettstown, New Jersey
- 981 room
- 302 rooms
- 3783 rooms
- 4474 rooms
- 1945 rooms
- 1226 rooms
- 917 rooms
- 578 rooms
- 09+ rooms


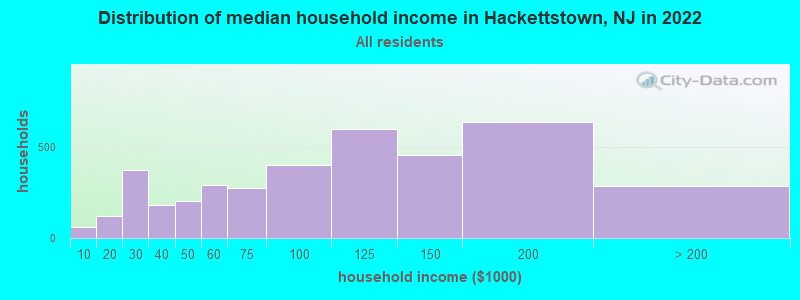
Hackettstown, NJ household income distribution

- 58Less than $10,000
- 120$10,000 to $19,999
- 370$20,000 to $29,999
- 181$30,000 to $39,999
- 201$40,000 to $49,999
- 292$50,000 to $59,999
- 273$60,000 to $74,999
- 398$75,000 to $99,999
- 594$100,000 to $124,999
- 452$125,000 to $149,999
- 635$150,000 to $199,999
- 286$200,000 or more
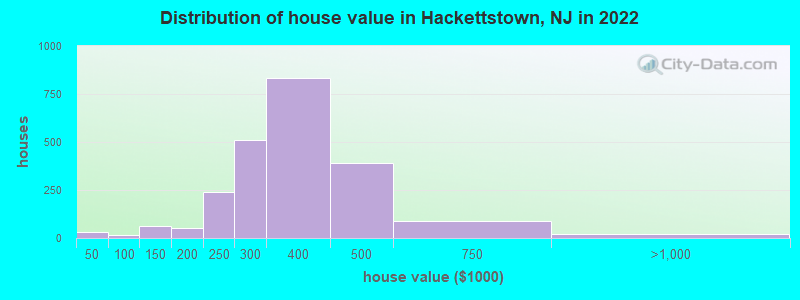
Home value of owner - occupied houses in 2022 in Hackettstown, NJ
-
- 28Less than $10,000
- 14$80,000 to $89,999
- 21$100,000 to $124,999
- 39$125,000 to $149,999
- 25$150,000 to $174,999
- 27$175,000 to $199,999
- 237$200,000 to $249,999
- 512$250,000 to $299,999
- 835$300,000 to $399,999
- 392$400,000 to $499,999
- 90$500,000 to $749,999
- 8$750,000 to $999,999
- 13$1,500,000 to $1,999,999
Rent paid by renters in 2022 in Hackettstown, NJ
-
- 30$250 to $299
- 73$500 to $549
- 14$600 to $649
- 17$650 to $699
- 26$700 to $749
- 13$750 to $799
- 27$800 to $899
- 64$900 to $999
- 397$1,000 to $1,249
- 393$1,250 to $1,499
- 215$1,500 to $1,999
- 66$2,000 to $2,499
- 38No cash rent


Percentage of workers working in this county: 45.1%
Number of people working at home: 570 (11.1% of all workers)
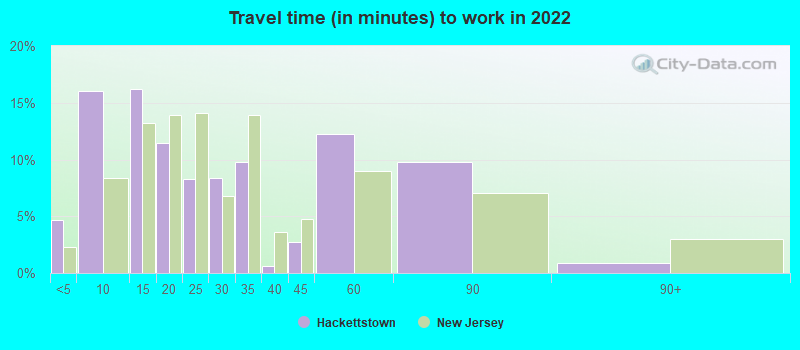
Travel time to work (commute)
- Less than 5 minutes: 301
- 5 to 9 minutes: 580
- 10 to 14 minutes: 663
- 15 to 19 minutes: 454
- 20 to 24 minutes: 261
- 25 to 29 minutes: 242
- 30 to 34 minutes: 568
- 35 to 39 minutes: 109
- 40 to 44 minutes: 112
- 45 to 59 minutes: 655
- 60 to 89 minutes: 533
- 90 or more minutes: 212
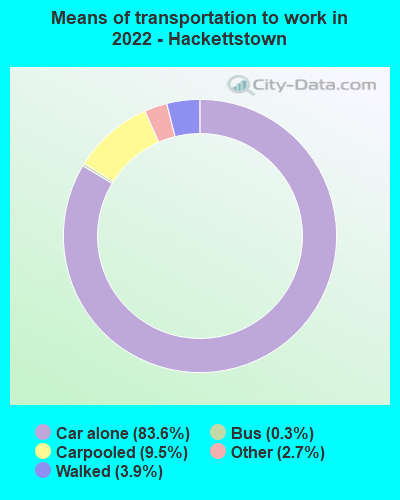
Means of transportation to work:
- Drove a car alone: 4,298 (72.3%)
- Carpooled: 562 (9.5%)
- Bus: 15 (0.3%)
- Taxi: 160 (2.7%)
- Walked: 238 (4.0%)
- Worked at home: 570 (9.6%)

- Unemployment by race in 2022
- Unemployment rate for White non-Hispanic residents
- 3.4%Males
- 10.0%Females
- Unemployment rate for other race residents
- 2.5%Males
- Unemployment rate for two or more race residents
- 8.5%Males
- Unemployment rate for Hispanic or Latino residents
- 4.6%Males
- 4.4%Females

- Year of entry for the foreign-born population in Hackettstown, New Jersey
- 7242010 or later
- 3942000 to 2009
- 2551990 to 1999
- 1511980 to 1989
- 941970 to 1979
- 266Before 1970

First ancestries reported:
- Italian: 544 (12.2%)
- Irish: 504 (11.3%)
- American: 283 (6.3%)
- European: 234 (5.2%)
- German: 175 (3.9%)
- Polish: 153 (3.4%)
- English: 105 (2.4%)
- Ukrainian: 62 (1.4%)
- Lithuanian: 55 (1.2%)
- Yugoslavian: 52 (1.2%)
- Norwegian: 28 (0.6%)
- Scotch-Irish: 25 (0.6%)
- Lebanese: 23 (0.5%)
- Czech: 23 (0.5%)
- Hungarian: 20 (0.4%)
- Bahamian: 18 (0.4%)
- Eastern European: 17 (0.4%)
- British: 16 (0.4%)
- Greek: 16 (0.4%)
- Jamaican: 16 (0.4%)
- Portuguese: 13 (0.3%)
- Swedish: 13 (0.3%)
- Slovak: 11 (0.2%)
- Austrian: 10 (0.2%)
- Brazilian: 9 (0.2%)
- French: 9 (0.2%)
- Scandinavian: 9 (0.2%)
- Egyptian: 6 (0.1%)
- Danish: 6 (0.1%)
- Russian: 4 (0.09%)
- Turkish: 3 (0.07%)
- Finnish: 2 (0.04%)
- Scottish: 2 (0.04%)
- Pennsylvania German: 1 (0.02%)
Most common places of birth for foreign-born residents (%):
| Hackettstown: | 23.0% (381) |
| New Jersey: | 4.2% (90,817) |
| Hackettstown: | 14.5% (240) |
| New Jersey: | 0.7% (14,848) |
| Hackettstown: | 7.5% (124) |
| New Jersey: | 1.7% (37,335) |
| Hackettstown: | 7.2% (119) |
| New Jersey: | 12.8% (274,609) |
| Hackettstown: | 5.8% (97) |
| New Jersey: | 2.2% (46,813) |
| Hackettstown: | 5.5% (92) |
| New Jersey: | 4.0% (85,934) |
| Hackettstown: | 4.3% (72) |
| New Jersey: | 4.4% (95,275) |
| Hackettstown: | 3.8% (63) |
| New Jersey: | 0.1% (1,406) |
| Hackettstown: | 3.5% (58) |
| New Jersey: | 0.1% (1,189) |
| Hackettstown: | 3.4% (57) |
| New Jersey: | 9.7% (209,055) |
| Hackettstown: | 3.2% (53) |
| New Jersey: | 0.3% (5,500) |
| Hackettstown: | 2.5% (42) |
| New Jersey: | 3.7% (78,969) |
| Hackettstown: | 2.1% (35) |
| New Jersey: | 2.7% (58,563) |
| Hackettstown: | 1.7% (29) |
| New Jersey: | 0.2% (4,324) |
| Hackettstown: | 1.7% (28) |
| New Jersey: | 1.6% (33,678) |
| Hackettstown: | 1.6% (26) |
| New Jersey: | 0.0% (892) |
Place of birth for U.S.-born residents:
- This state: 5,539
- Other state: 2,614
- Northeast: 1,716
- Midwest: 169
- South: 550
- West: 185
86.3% of Hackettstown residents lived in the same house 1 years ago.
Out of people who lived in different houses, 23.5% lived in this county.
Out of people who lived in different counties, 79.5% lived in New Jersey.
| Hackettstown: | 86.3% |
| State average: | 90.4% |
Education attainment for males 25 years and older:
- No schooling: 44
- Nursery to 4th grade: 12
- 5th and 6th grade: 89
- 7th and 8th grade: 48
- 9th grade: 3
- 10th grade: 6
- 11th grade: 22
- 12th grade, no diploma: 47
- High school graduate (or equivalency): 973
- Less than 1 year of college: 187
- Some college more than 1 year, no degree: 468
- Associate degree: 110
- Bachelor's degree: 947
- Master's degree: 383
- Professional school degree: 31
- Doctorate degree: 33

Education attainment for females 25 years and older:
- No schooling: 28
- Nursery to 4th grade: 11
- 5th and 6th grade: 32
- 7th and 8th grade: 21
- 9th grade: 5
- 10th grade: 16
- 11th grade: 14
- 12th grade, no diploma: 33
- High school graduate (or equivalency): 849
- Less than 1 year of college: 197
- Some college more than 1 year, no degree: 335
- Associate degree: 381
- Bachelor's degree: 1,070
- Master's degree: 436
- Professional school degree: 75
- Doctorate degree: 29


Housing units in structures:
- One, detached: 2,207
- One, attached: 345
- Two: 174
- 3 or 4: 150
- 5 to 9: 265
- 10 to 19: 247
- 20 to 49: 151
- 50 or more: 211
- Mobile homes: 69
House/condo owner moved in on average 13 years ago
Renter moved in on average 2 years ago

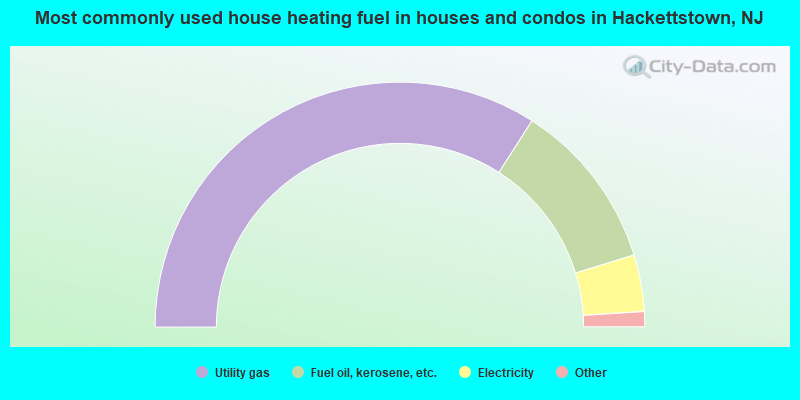
- 68.2%Utility gas
- 22.4%Fuel oil, kerosene, etc.
- 7.5%Electricity
- 1.4%Bottled, tank, or LP gas
- 0.5%Other fuel
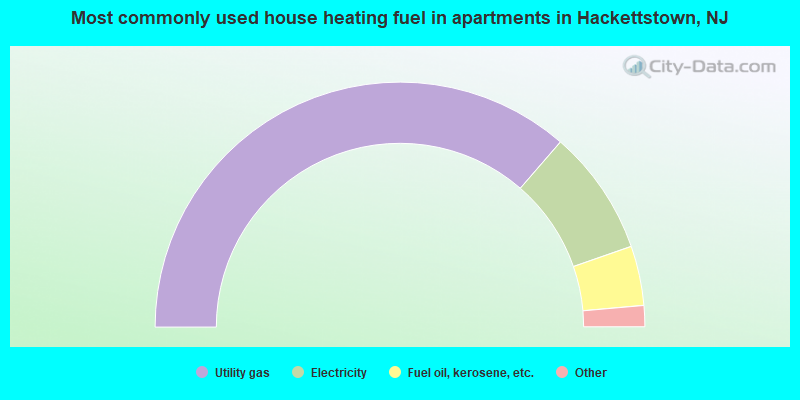
- 72.9%Utility gas
- 16.6%Electricity
- 7.9%Fuel oil, kerosene, etc.
- 1.7%No fuel used
- 0.9%Bottled, tank, or LP gas
Private vs. public school enrollment:
| Here: | 2.6% |
| New Jersey: | 12.3% |
| Here: | 12.6% |
| New Jersey: | 13.1% |
| Here: | 43.5% |
| New Jersey: | 33.2% |


