Guttenberg, NJ (New Jersey) Houses and Residents
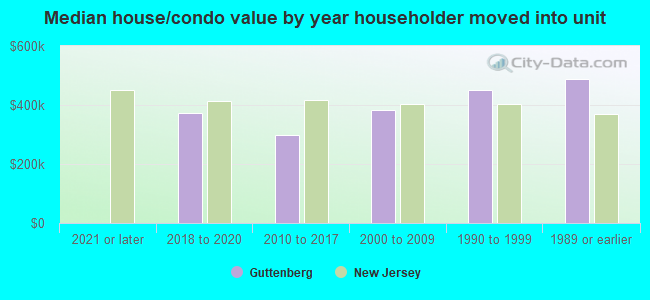
| Guttenberg: | $393,921 |
| New Jersey: | $428,900 |
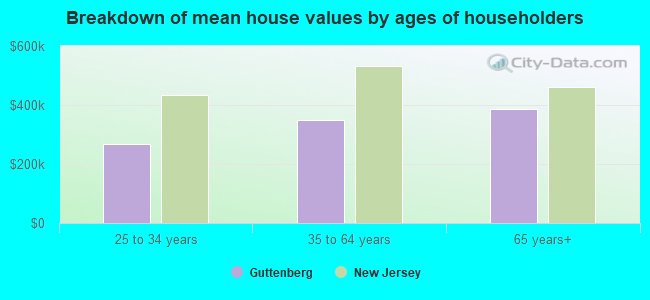
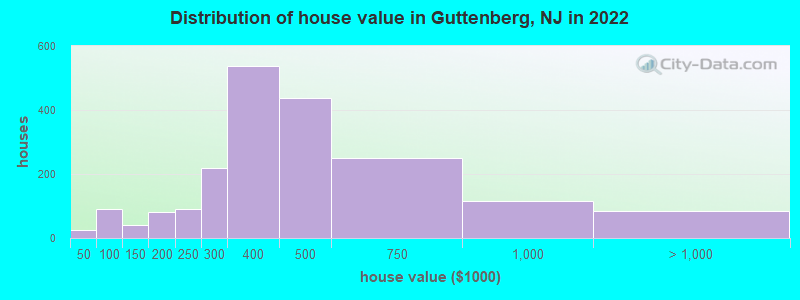
Mean price in 2022:
Detached houses: $553,355
Here: $553,355 State: $537,591 Townhouses or other attached units: $470,040
Here: $470,040 State: $381,113 In 2-unit structures: $446,884
Here: $446,884 State: $444,476 In 3-to-4-unit structures: $475,040
Here: $475,040 State: $457,463 In 5-or-more-unit structures: $406,651
Here: $406,651 State: $368,745
Total population: 11,481 (Urban population: 10,693, Rural population: 0)
Houses: 5,440 (5,094 occupied: 2,147 owner occupied, 3,074 renter occupied)
| % of renters here: | 59% |
| State: | 35% |
Housing density: 28,195 houses/condos per square mile
Median price asked for vacant for-sale houses and condos in 2022: $552,313.
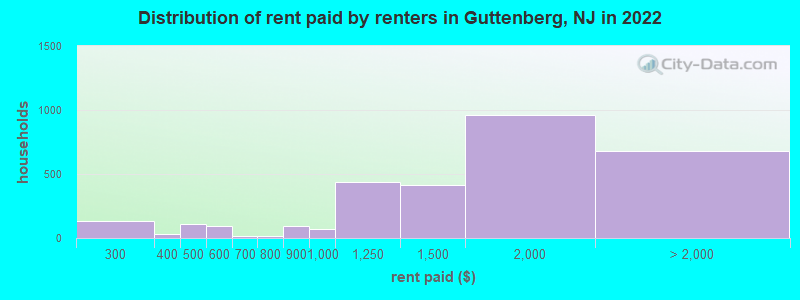
Median contract rent in 2022: $1,568 (lower quartile is $1,120, upper quartile is $1,973)
Median rent asked for vacant for-rent units in 2022: $1,598
Median gross rent in Guttenberg, NJ in 2022: $1,706
Housing units in Guttenberg with a mortgage: 1,212 (52 second mortgage, 0 home equity loan, 54 both second mortgage and home equity loan)
Houses without a mortgage: 0
Median household income for houses/condos with a mortgage: $155,697
Median household income for apartments without a mortgage: $83,839
Median monthly housing costs: $1,795
Compare current foreclosures near Guttenberg, NJ:
| Photo | Address | Area | Beds / Baths | Price | Details |
|---|---|---|---|---|---|

|
#1
Tulip Ave # Gl2
Floral Park, NY 11001
|
1,200 sq. feet
|
1 baths 2 beds |
$409,900
|
show details |

|
#2
Swinton Ave
Bronx, NY 10465
|
1,938 sq. feet
|
2 baths 3 beds |
$789,900
|
show details |

|
#3
E 81st St Apt 4c
New York, NY 10028
|
696 sq. feet
|
1 baths 1 beds |
$745,000
|
show details |

|
#4
Park Ave Apt 12
North Bergen, NJ 07047
|
835 sq. feet
|
1 baths 2 beds |
$379,900
|
show details |

|
#5
Grand Concourse Apt 3c
Bronx, NY 10452
|
700 sq. feet
|
1 baths 1 beds |
$184,500
|
show details |

|
#6
123rd Ave
Jamaica, NY 11434
|
1,042 sq. feet
|
1 baths 3 beds |
$460,000
|
show details |

|
#7
7th St
Ridgefield Park, NJ 07660
|
1,382 sq. feet
|
1 baths 3 beds |
$539,900
|
show details |

|
#8
E 73rd St
New York, NY 10021
|
1,253 sq. feet
|
2 baths 2 beds |
$699,900
|
show details |

|
#9
17th Ave 1st Floor
Whitestone, NY 11357
|
610 sq. feet
|
1 baths 1 beds |
$229,900
|
show details |

|
#10
E 32nd St Apt C7
Brooklyn, NY 11210
|
670 sq. feet
|
1 baths 1 beds |
$299,900
|
show details |
| Photo | Address | Area | Beds / Baths | Price | Details |
|---|---|---|---|---|---|

|
#11
W Sidney Ave
Mount Vernon, NY 10550
|
2,800 sq. feet
|
3 baths 8 beds |
$454,900
|
show details |

|
#12
72nd Avenue
Bellerose, NY 11426
|
850 sq. feet
|
1 baths 1 beds |
$259,900
|
show details |

|
#13
Olinville Ave Apt 11c
Bronx, NY 10467
|
1,000 sq. feet
|
2 baths 3 beds |
$385,000
|
show details |

|
#14
Willow St
Bloomfield, NJ 07003
|
1,092 sq. feet
|
1 baths 3 beds |
$499,900
|
show details |

|
#15
Ackerman St
Maywood, NJ 07607
|
1,914 sq. feet
|
4 baths 5 beds |
$525,200
|
show details |

|
#16
Fordham Hill Oval Apt 12d
Bronx, NY 10468
|
850 sq. feet
|
1 baths 1 beds |
$179,900
|
show details |

|
#17
Central Park Ave Apt 9m
Yonkers, NY 10710
|
1,300 sq. feet
|
2 baths 3 beds |
$319,900
|
show details |

|
#18
90th St Apt 5d
Jackson Heights, NY 11372
|
1,000 sq. feet
|
1 baths 2 beds |
$269,900
|
show details |

|
#19
S Orange Ave
Newark, NJ 07103
|
989 sq. feet
|
1 baths 2 beds |
$289,900
|
show details |

|
#20
N Broadway Apt A6
Yonkers, NY 10701
|
950 sq. feet
|
2 baths 2 beds |
$219,900
|
show details |
| Photo | Address | Area | Beds / Baths | Price | Details |
|---|---|---|---|---|---|

|
#21
E 36th St Apt 9f
New York, NY 10016
|
700 sq. feet
|
1 baths 1 beds |
$499,900
|
show details |

|
#22
Bloomfield Ave
Caldwell, NJ 07006
|
1,216 sq. feet
|
2 baths 2 beds |
$400,000
|
show details |

|
#23
Martin Dr
Harrington Park, NJ 07640
|
1,746 sq. feet
|
3 baths 3 beds |
$950,000
|
show details |

|
#24
Fordham Hill Oval
Bronx, NY 10468
|
700 sq. feet
|
1 baths 1 beds |
$154,900
|
show details |

|
#25
Horizon Rd Apt 803
Fort Lee, NJ 07024
|
843 sq. feet
|
1 baths 1 beds |
$178,900
|
show details |

|
#26
Forest Ave
Paramus, NJ 07652
|
2,428 sq. feet
|
3 baths 5 beds |
$749,900
|
show details |

|
#27
Francis Lewis Blvd
Queens Village, NY 11429
|
844 sq. feet
|
1 baths 2 beds |
$589,900
|
show details |

|
#28
2nd Ave # 5c
New York, NY 10029
|
550 sq. feet
|
1 baths 1 beds |
$429,900
|
show details |

|
#29
96th St
Ozone Park, NY 11417
|
1,520 sq. feet
|
2 baths 3 beds |
$709,900
|
show details |

|
#30
Huntington Rd
Union, NJ 07083
|
1,532 sq. feet
|
2 baths 3 beds |
$539,900
|
show details |
| Photo | Address | Area | Beds / Baths | Price | Details |
|---|---|---|---|---|---|

|
#31
Ashland Ave
East Orange, NJ 07017
|
2,254 sq. feet
|
1 baths 5 beds |
$272,000
|
show details |

|
#32
Davenport Ave Apt 1b
New Rochelle, NY 10805
|
750 sq. feet
|
1 baths 1 beds |
$159,900
|
show details |

|
#33
177th St
Jamaica, NY 11433
|
1,156 sq. feet
|
1 baths 3 beds |
$450,000
|
show details |

|
#34
E 52nd St Apt 4f
New York, NY 10022
|
700 sq. feet
|
1 baths 1 beds |
$689,900
|
show details |

|
#35
Bay 19th St
Brooklyn, NY 11214
|
880 sq. feet
|
1 baths 2 beds |
$425,000
|
show details |

|
#36
Highland Ave
Cliffside Park, NJ 07010
|
2,451 sq. feet
|
3 baths 3 beds |
$832,000
|
show details |

|
#37
Jersey Ave
Fairview, NJ 07022
|
1,073 sq. feet
|
1 baths 3 beds |
$414,900
|
show details |

|
#38
Midland Ave Apt 4h
Bronxville, NY 10708
|
900 sq. feet
|
1 baths 1 beds |
$184,000
|
show details |

|
#39
Woodside Ave
Newark, NJ 07104
|
2,188 sq. feet
|
3 baths 4 beds |
$649,900
|
show details |

|
#40
E 221st St
Bronx, NY 10467
|
1,890 sq. feet
|
2 baths 3 beds |
$554,900
|
show details |
| Photo | Address | Area | Beds / Baths | Price | Details |
|---|---|---|---|---|---|

|
#41
W 110th St Apt 9-10
New York, NY 10025
|
- sq. feet
|
2 baths 2 beds |
$627,000
|
show details |

|
#42
Ocean Pkwy Apt 11k
Brooklyn, NY 11235
|
400 sq. feet
|
1 baths - beds |
$205,000
|
show details |

|
#43
Howe Ave
Passaic, NJ 07055
|
- sq. feet
|
2 baths 5 beds |
$332,800
|
show details |

|
#44
Main Street Unit 1b
Jamaica, NY 11435
|
- sq. feet
|
3 baths 3 beds |
$349,200
|
show details |

|
#45
Park Ave # 3w4c
New York, NY 10028
|
- sq. feet
|
4 baths 4 beds |
$8,250,000
|
show details |

|
#46
-31 88th St 6h
Howard Beach, NY 11414
|
- sq. feet
|
1 baths 2 beds |
$261,000
|
show details |

|
#47
Prospect Park SW 8
Brooklyn, NY 11218
|
- sq. feet
|
1 baths 1 beds |
$719,900
|
show details |

|
#48
Richmond Rd
Staten Island, NY 10304
|
- sq. feet
|
1 baths 3 beds |
$634,400
|
show details |

|
#49
W End Ave Apt 10d
New York, NY 10023
|
- sq. feet
|
1 baths 1 beds |
$429,900
|
show details |

|
Check over 1 million property listings on Foreclosure.com!
|
browse all offers | |||

Latest news about housing in Guttenberg, NJ collected exclusively by city-data.com from local newspapers, TV, and radio stations

 | Cheapest safe cities to rent an apartment in the state of New Jersey? (16 replies) |
| Port Imperial at WNY Condos (12 replies) |
| Renting in Jersey City or Guttenberg Surroundings (2 replies) |
| NJ Apartment or Rental Realtor Help Please (14 replies) |
| Guttenberg, NJ (7 replies) |
| Has anyone succeeded, or been involved in, having a speed bump installed? (39 replies) |

Median year apartment built: 1982
Household type by relationship:
Households: 11,621- Male householders: 1,856 (513 living alone), Female householders: 3,056 (1,141 living alone)
1,661 spouses (1,579 opposite-sex spouses), 401 unmarried partners, (360 opposite-sex unmarried partners), 2,466 children (2,406 natural, 0 adopted, 60 stepchildren), 117 grandchildren, 186 brothers or sisters, 487 parents, 0 foster children, 1,016 other relatives, 370 non-relatives
Size of family households: 1,227 2-persons, 796 3-persons, 289 4-persons, 461 5-persons, 155 6-persons, 87 7-or-more-persons.
Size of nonfamily households: 1,926 1-person, 270 2-persons.
960 married couples with children.
775 single-parent households (173 men, 602 women).
24.9% of residents of Guttenberg speak English at home.
61.2% of residents speak Spanish at home (50% speak English very well, 19% speak English well, 24% speak English not well, 7% don't speak English at all).
5.5% of residents speak other Indo-European language at home (81% speak English very well, 12% speak English well, 5% speak English not well, 2% don't speak English at all).
3.4% of residents speak Asian or Pacific Island language at home (72% speak English very well, 18% speak English well, 11% speak English not well).
3.0% of residents speak other language at home (89% speak English very well, 11% speak English well).
Foreign born population: 6,249 (53.8%)
(55.2% of them are naturalized citizens)
| Here: | 4.1 |
| State: | 6.8 |
| Here: | 3.2 |
| State: | 3.9 |
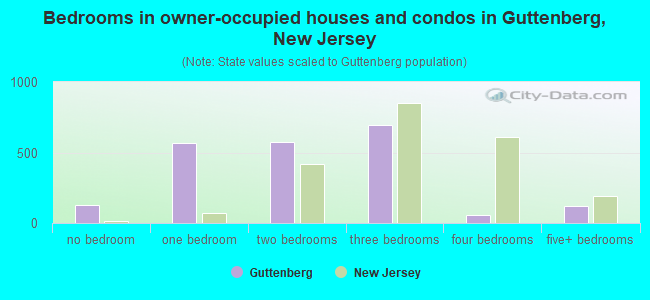
- Bedrooms in owner-occupied houses and condos in Guttenberg, New Jersey
- 129no bedroom
- 5661 bedroom
- 5742 bedrooms
- 6973 bedrooms
- 594 bedrooms
- 1225+ bedrooms
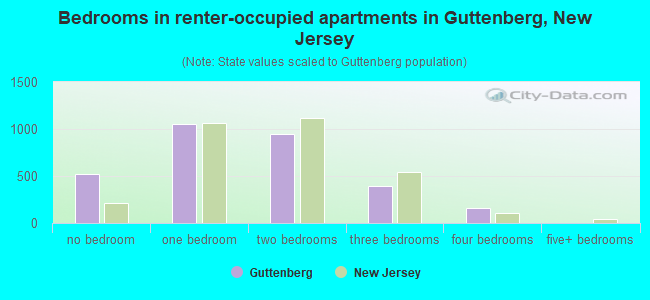
- Bedrooms in renter-occupied apartments in Guttenberg, New Jersey
- 523no bedroom
- 1,0541 bedroom
- 9432 bedrooms
- 3923 bedrooms
- 1634 bedrooms
- 05+ bedrooms
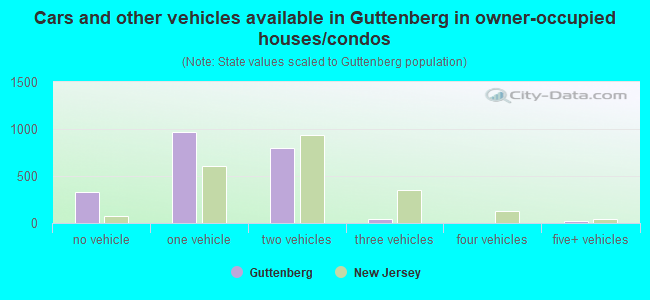
- Cars and other vehicles available in Guttenberg in owner-occupied houses/condos
- 325no vehicle
- 9671 vehicle
- 7972 vehicles
- 403 vehicles
- 04 vehicles
- 185+ vehicles
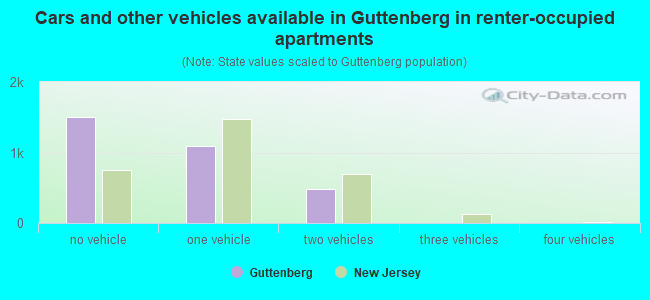
- Cars and other vehicles available in Guttenberg in renter-occupied apartments
- 1,498no vehicle
- 1,0911 vehicle
- 4852 vehicles
- 03 vehicles
- 04 vehicles
- 05+ vehicles
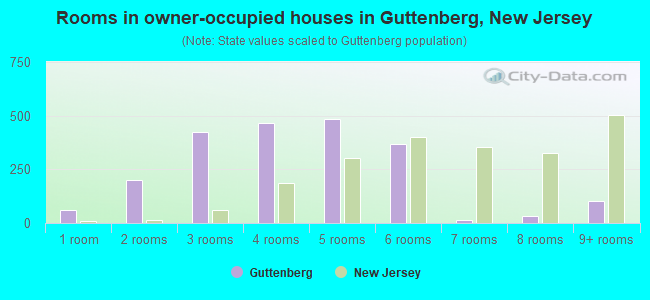
- Rooms in owner-occupied houses in Guttenberg, New Jersey
- 601 room
- 2012 rooms
- 4243 rooms
- 4644 rooms
- 4845 rooms
- 3666 rooms
- 137 rooms
- 318 rooms
- 1049+ rooms
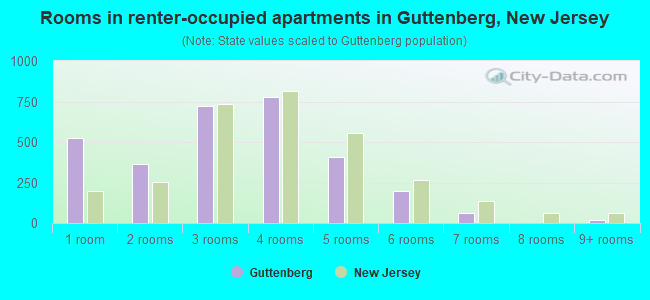
- Rooms in renter-occupied apartments in Guttenberg, New Jersey
- 5231 room
- 3662 rooms
- 7243 rooms
- 7764 rooms
- 4055 rooms
- 1996 rooms
- 627 rooms
- 08 rooms
- 189+ rooms
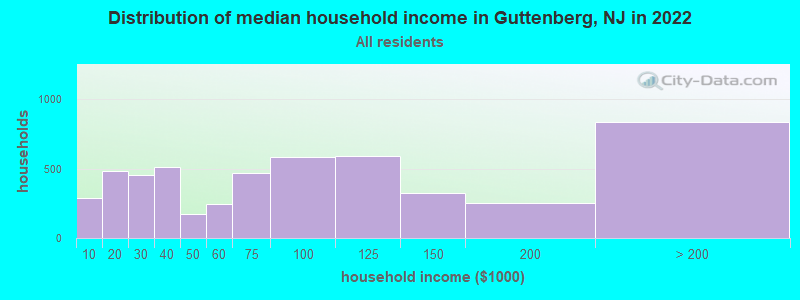
Guttenberg, NJ household income distribution

- 289Less than $10,000
- 480$10,000 to $19,999
- 451$20,000 to $29,999
- 510$30,000 to $39,999
- 171$40,000 to $49,999
- 247$50,000 to $59,999
- 470$60,000 to $74,999
- 584$75,000 to $99,999
- 589$100,000 to $124,999
- 324$125,000 to $149,999
- 255$150,000 to $199,999
- 835$200,000 or more
Home value of owner - occupied houses in 2022 in Guttenberg, NJ
-
- 26Less than $10,000
- 9$50,000 to $59,999
- 80$80,000 to $89,999
- 12$100,000 to $124,999
- 28$125,000 to $149,999
- 80$175,000 to $199,999
- 92$200,000 to $249,999
- 217$250,000 to $299,999
- 536$300,000 to $399,999
- 436$400,000 to $499,999
- 251$500,000 to $749,999
- 116$750,000 to $999,999
- 54$1,000,000 to $1,499,999
- 19$1,500,000 to $1,999,999
- 11$2,000,000 or more
Rent paid by renters in 2022 in Guttenberg, NJ
-
- 87$200 to $249
- 42$250 to $299
- 27$300 to $349
- 52$400 to $449
- 53$450 to $499
- 90$500 to $549
- 18$650 to $699
- 16$700 to $749
- 96$800 to $899
- 73$900 to $999
- 434$1,000 to $1,249
- 414$1,250 to $1,499
- 957$1,500 to $1,999
- 446$2,000 to $2,499
- 133$2,500 to $2,999
- 51$3,000 to $3,499
- 22$3,500 or more
- 24No cash rent
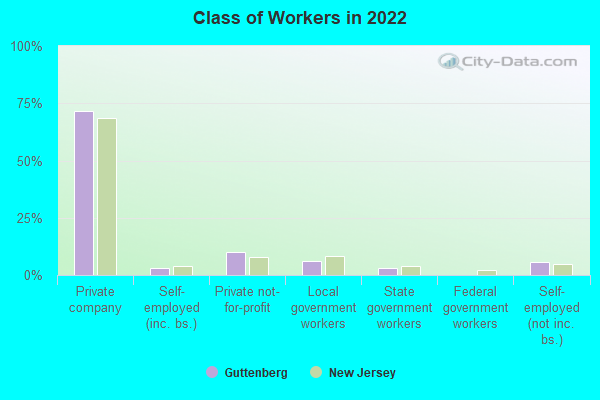
Percentage of workers working in this county: 47.5%
Number of people working at home: 913 (14.7% of all workers)
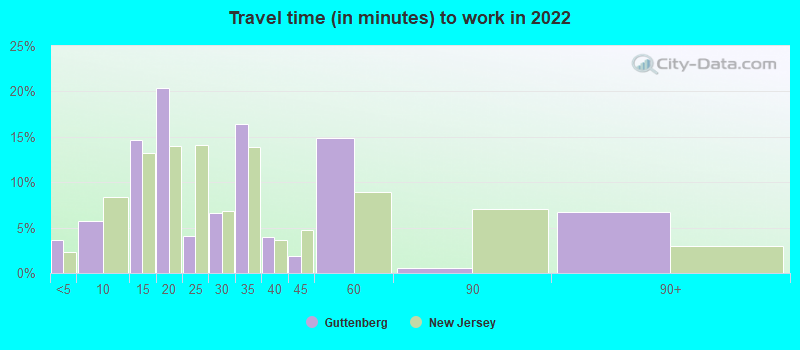
Travel time to work (commute)
- Less than 5 minutes: 33
- 5 to 9 minutes: 230
- 10 to 14 minutes: 339
- 15 to 19 minutes: 316
- 20 to 24 minutes: 655
- 25 to 29 minutes: 217
- 30 to 34 minutes: 1,004
- 35 to 39 minutes: 304
- 40 to 44 minutes: 284
- 45 to 59 minutes: 760
- 60 to 89 minutes: 763
- 90 or more minutes: 244
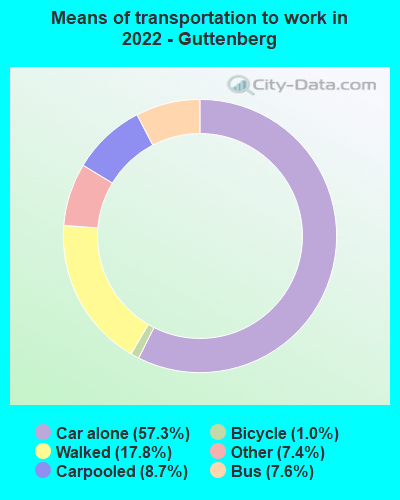
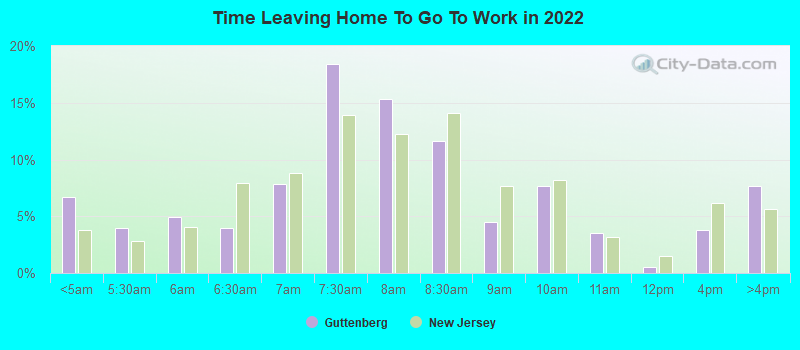
Means of transportation to work:
- Drove a car alone: 756 (35.5%)
- Carpooled: 120 (5.6%)
- Bus: 100 (4.7%)
- Taxi: 114 (5.3%)
- Bicycle: 10 (0.5%)
- Walked: 245 (11.5%)
- Worked at home: 913 (42.8%)
- Unemployment by race in 2022
- Unemployment rate for White non-Hispanic residents
- 1.2%Males
- Unemployment rate for Black residents
- 6.3%Males
- Unemployment rate for Asian residents
- 16.5%Males
- Unemployment rate for other race residents
- 16.6%Males
- 11.0%Females
- Unemployment rate for two or more race residents
- 8.0%Males
- 22.1%Females
- Unemployment rate for Hispanic or Latino residents
- 8.7%Males
- 8.8%Females
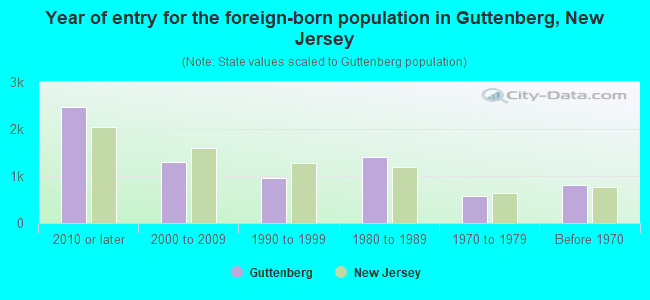
- Year of entry for the foreign-born population in Guttenberg, New Jersey
- 2,4752010 or later
- 1,2992000 to 2009
- 9671990 to 1999
- 1,4031980 to 1989
- 5681970 to 1979
- 810Before 1970
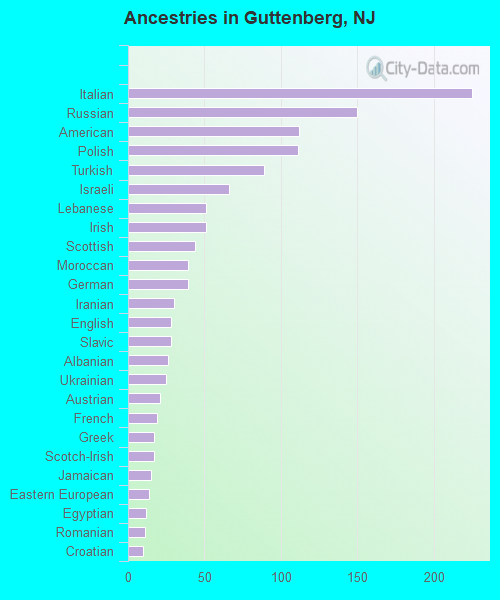
First ancestries reported:
- Italian: 225 (2.8%)
- Russian: 150 (1.9%)
- American: 112 (1.4%)
- Polish: 111 (1.4%)
- Turkish: 89 (1.1%)
- Israeli: 66 (0.8%)
- Lebanese: 51 (0.6%)
- Irish: 51 (0.6%)
- Scottish: 44 (0.6%)
- Moroccan: 39 (0.5%)
- German: 39 (0.5%)
- Iranian: 30 (0.4%)
- English: 28 (0.4%)
- Slavic: 28 (0.4%)
- Albanian: 26 (0.3%)
- Ukrainian: 25 (0.3%)
- Austrian: 21 (0.3%)
- French: 19 (0.2%)
- Greek: 17 (0.2%)
- Scotch-Irish: 17 (0.2%)
- Jamaican: 15 (0.2%)
- Eastern European: 14 (0.2%)
- Egyptian: 12 (0.2%)
- Romanian: 11 (0.1%)
- Croatian: 10 (0.1%)
- European: 9 (0.1%)
Most common places of birth for foreign-born residents (%):
| Guttenberg: | 22.1% (1,453) |
| New Jersey: | 9.7% (209,055) |
| Guttenberg: | 13.4% (879) |
| New Jersey: | 4.4% (95,275) |
| Guttenberg: | 11.6% (761) |
| New Jersey: | 2.1% (45,435) |
| Guttenberg: | 7.5% (492) |
| New Jersey: | 4.2% (90,817) |
| Guttenberg: | 5.0% (330) |
| New Jersey: | 0.8% (16,778) |
| Guttenberg: | 4.8% (319) |
| New Jersey: | 1.7% (37,335) |
| Guttenberg: | 4.1% (270) |
| New Jersey: | 2.2% (46,813) |
| Guttenberg: | 3.2% (209) |
| New Jersey: | 2.3% (48,885) |
| Guttenberg: | 3.1% (205) |
| New Jersey: | 0.9% (20,371) |
| Guttenberg: | 2.5% (167) |
| New Jersey: | 12.8% (274,609) |
| Guttenberg: | 2.4% (157) |
| New Jersey: | 2.7% (58,563) |
| Guttenberg: | 2.0% (134) |
| New Jersey: | 3.7% (78,969) |
| Guttenberg: | 1.7% (111) |
| New Jersey: | 0.3% (7,153) |
| Guttenberg: | 1.6% (104) |
| New Jersey: | 0.3% (5,500) |
| Guttenberg: | 1.6% (103) |
| New Jersey: | 3.3% (70,512) |
Place of birth for U.S.-born residents:
- This state: 3,167
- Other state: 1,643
- Northeast: 1,301
- Midwest: 97
- South: 214
- West: 40
91.6% of Guttenberg residents lived in the same house 1 years ago.
Out of people who lived in different houses, 42.9% lived in this county.
Out of people who lived in different counties, 43.1% lived in New Jersey.
| Guttenberg: | 91.6% |
| State average: | 90.4% |
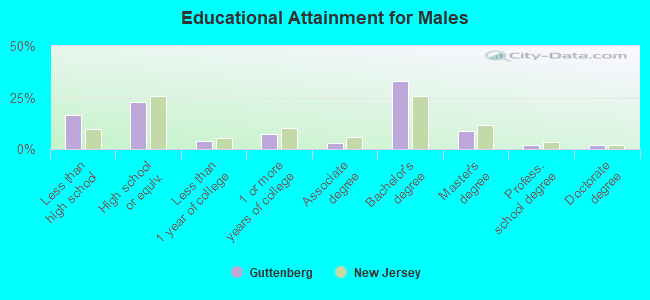
Education attainment for males 25 years and older:
- No schooling: 183
- Nursery to 4th grade: 0
- 5th and 6th grade: 90
- 7th and 8th grade: 58
- 9th grade: 29
- 10th grade: 37
- 11th grade: 179
- 12th grade, no diploma: 35
- High school graduate (or equivalency): 846
- Less than 1 year of college: 151
- Some college more than 1 year, no degree: 276
- Associate degree: 116
- Bachelor's degree: 1,208
- Master's degree: 315
- Professional school degree: 80
- Doctorate degree: 76
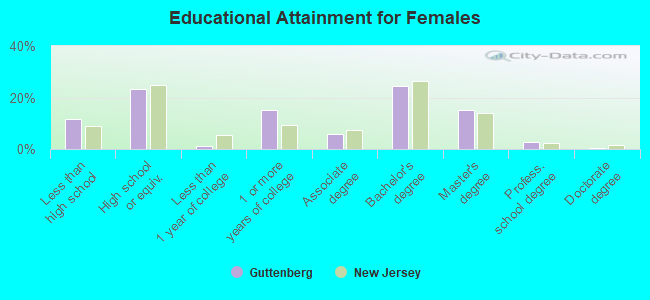
Education attainment for females 25 years and older:
- No schooling: 133
- Nursery to 4th grade: 29
- 5th and 6th grade: 104
- 7th and 8th grade: 85
- 9th grade: 0
- 10th grade: 24
- 11th grade: 28
- 12th grade, no diploma: 153
- High school graduate (or equivalency): 1,109
- Less than 1 year of college: 59
- Some college more than 1 year, no degree: 718
- Associate degree: 285
- Bachelor's degree: 1,176
- Master's degree: 728
- Professional school degree: 124
- Doctorate degree: 16


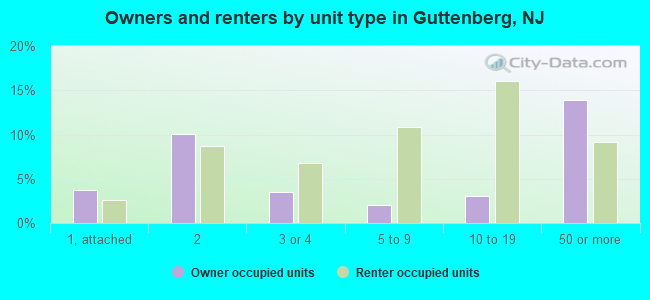
Housing units in structures:
- One, detached: 126
- One, attached: 308
- Two: 1,059
- 3 or 4: 663
- 5 to 9: 639
- 10 to 19: 981
- 20 to 49: 323
- 50 or more: 1,338
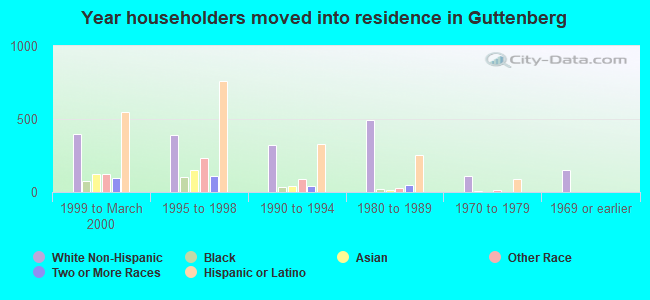
House/condo owner moved in on average 12 years ago
Renter moved in on average 6 years ago
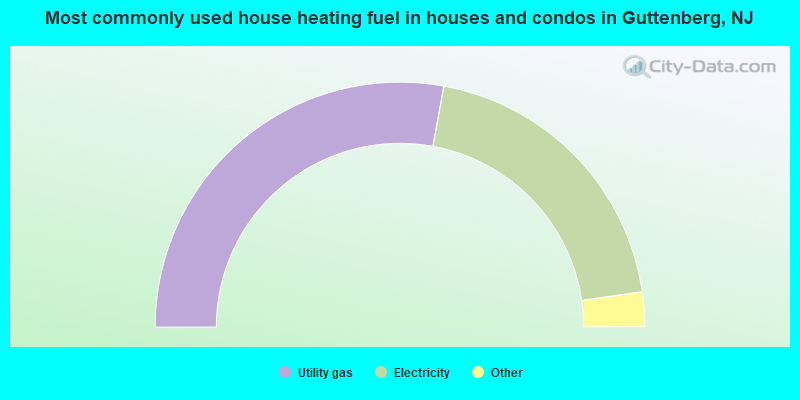
- 55.8%Utility gas
- 39.7%Electricity
- 3.1%Fuel oil, kerosene, etc.
- 1.4%Bottled, tank, or LP gas
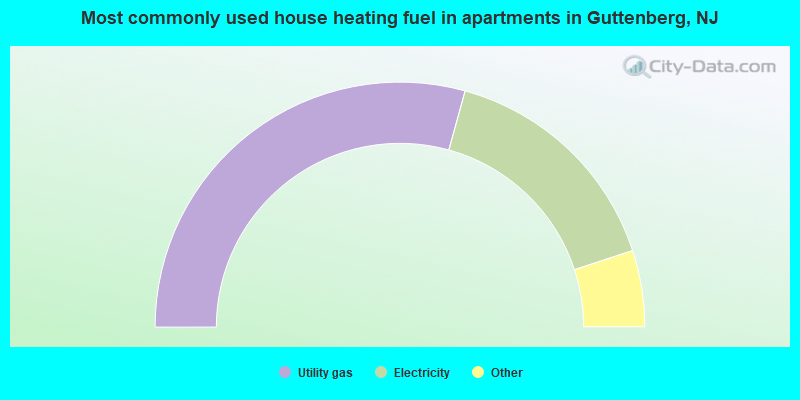
- 58.6%Utility gas
- 31.3%Electricity
- 3.7%Bottled, tank, or LP gas
- 3.5%No fuel used
- 2.4%Fuel oil, kerosene, etc.
- 0.5%Other fuel
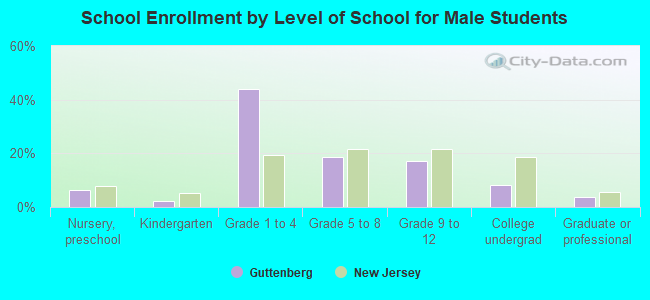
Private vs. public school enrollment:
| Here: | 7.3% |
| New Jersey: | 12.3% |
| Here: | 27.8% |
| New Jersey: | 13.1% |
| Here: | 12.4% |
| New Jersey: | 33.2% |