Housing density: 763 houses/condos per square mile
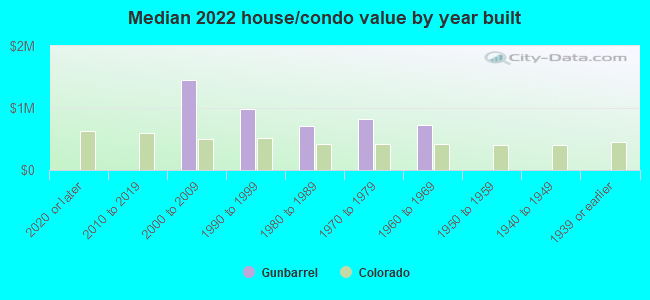
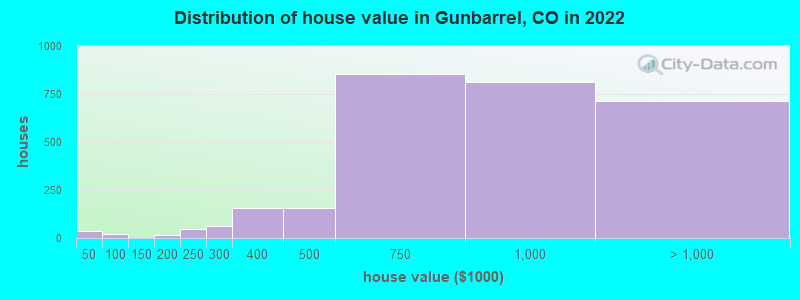
Median price asked for vacant for-sale houses and condos in 2022 in this county: $1,069,117.
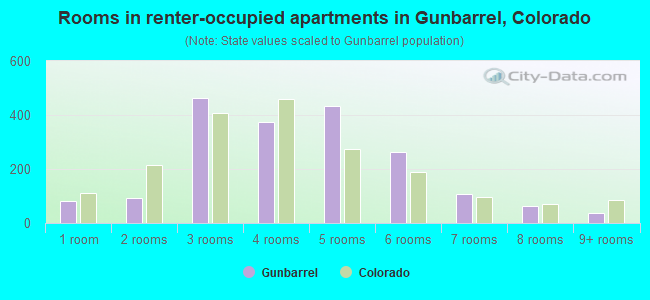
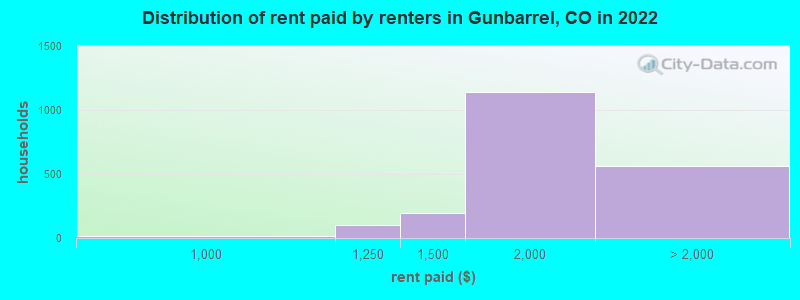
Median contract rent in 2022: $1,786 (lower quartile is $1,594, upper quartile is over $2,000)
Median rent asked for vacant for-rent units in 2022: $4,656
Median gross rent in Gunbarrel, CO in 2022: $1,889
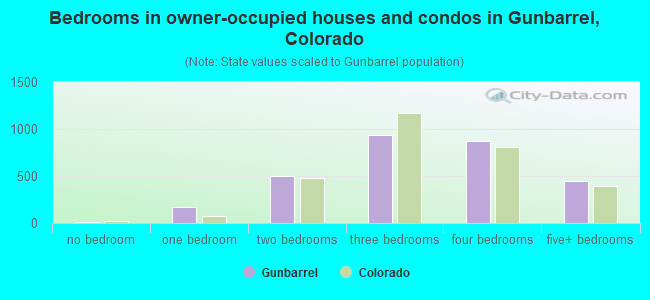
Housing units in Gunbarrel with a mortgage: 1,738 (339 second mortgage, 0 home equity loan, 366 both second mortgage and home equity loan) Houses without a mortgage: 0
Median household income for houses/condos with a mortgage: $171,941
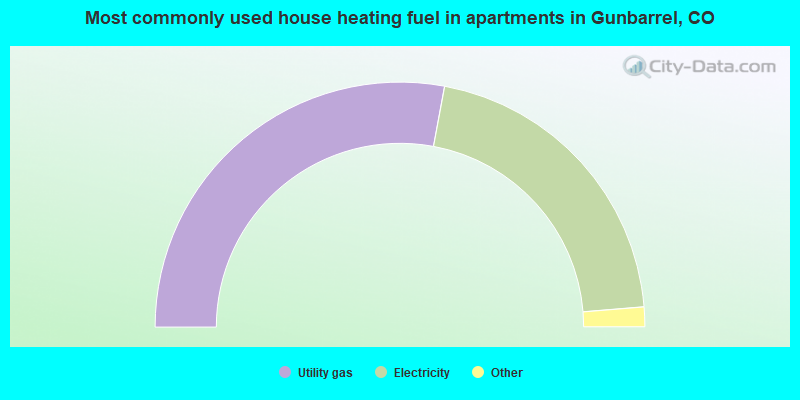
Median household income for apartments without a mortgage: $90,376
1,195 married couples with children.
177 single-parent households (35 men, 142 women).
91.7% of residents of Gunbarrel speak English at home.
2.9% of residents speak Spanish at home (79% speak English very well, 7% speak English well, 14% speak English not well).
5.1% of residents speak other Indo-European language at home (88% speak English very well, 5% speak English well, 7% speak English not well).
0.3% of residents speak Asian or Pacific Island language at home (100% speak English very well).
0.4% of residents speak other language at home (100% speak English very well).
Foreign born population: 767 (7.6%)
(64.7% of them are naturalized citizens)
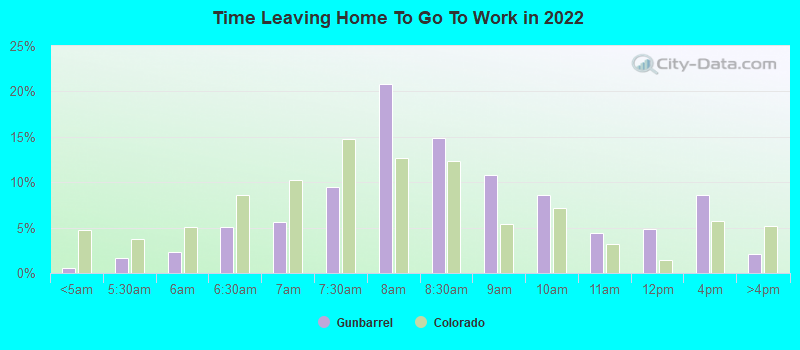
Percentage of workers working in this county: 83.2% Number of people working at home: 2,147 (36.7% of all workers)
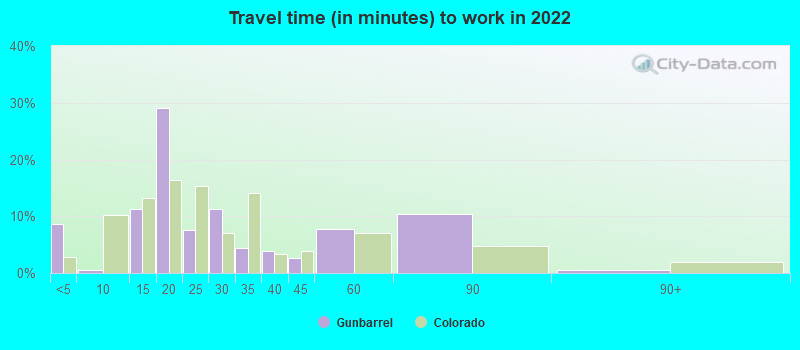
Travel time to work (commute)
Less than 5 minutes: 69
5 to 9 minutes: 254
10 to 14 minutes: 675
15 to 19 minutes: 940
20 to 24 minutes: 649
25 to 29 minutes: 183
30 to 34 minutes: 419
35 to 39 minutes: 25
40 to 44 minutes: 77
45 to 59 minutes: 291
60 to 89 minutes: 192
90 or more minutes: 7
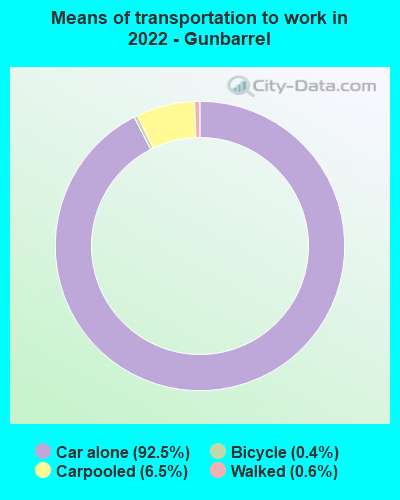
Means of transportation to work:
Drove a car alone: 923 (33.0%)
Carpooled: 73 (2.6%)
Bicycle: 4 (0.1%)
Walked: 6 (0.2%)
Worked at home: 2,147 (76.7%)
Unemployment by race in 2022
Unemployment rate for White non-Hispanic residents
2.0%Males
6.1%Females
Unemployment rate for two or more race residents
9.0%Females
Unemployment rate for Hispanic or Latino residents
17.1%Females
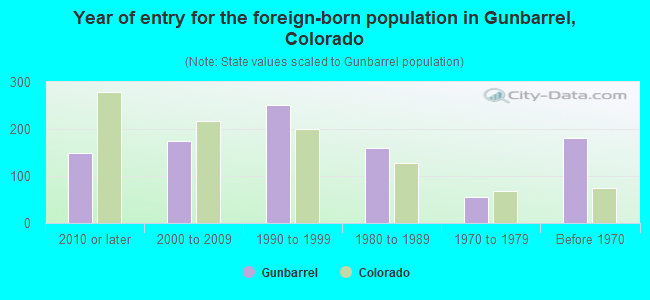
Year of entry for the foreign-born population in Gunbarrel, Colorado
1492010 or later
1742000 to 2009
2521990 to 1999
1591980 to 1989
551970 to 1979
181Before 1970
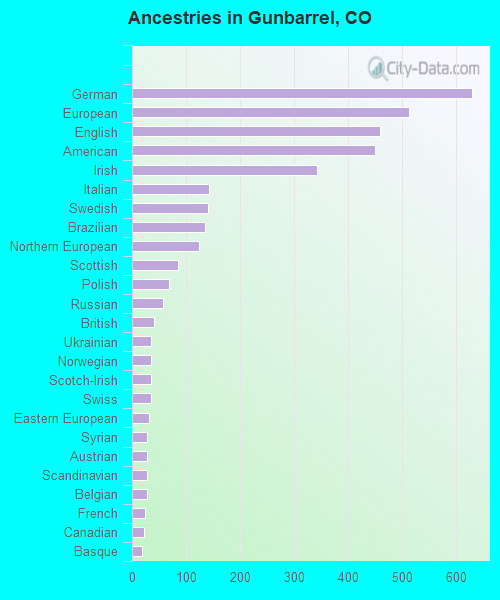
First ancestries reported:
German: 630 (14.1%)
European: 513 (11.5%)
English: 459 (10.3%)
American: 450 (10.1%)
Irish: 342 (7.7%)
Italian: 143 (3.2%)
Swedish: 140 (3.1%)
Brazilian: 136 (3.0%)
Northern European: 124 (2.8%)
Scottish: 85 (1.9%)
Polish: 68 (1.5%)
Russian: 57 (1.3%)
British: 41 (0.9%)
Ukrainian: 36 (0.8%)
Norwegian: 36 (0.8%)
Scotch-Irish: 35 (0.8%)
Swiss: 35 (0.8%)
Eastern European: 32 (0.7%)
Syrian: 28 (0.6%)
Austrian: 28 (0.6%)
Scandinavian: 28 (0.6%)
Belgian: 27 (0.6%)
French: 25 (0.6%)
Canadian: 23 (0.5%)
Basque: 19 (0.4%)
Slovak: 15 (0.3%)
French Canadian: 14 (0.3%)
Czech: 14 (0.3%)
Lebanese: 13 (0.3%)
Hungarian: 13 (0.3%)
Iranian: 13 (0.3%)
Finnish: 11 (0.2%)
Slavic: 11 (0.2%)
Dutch: 11 (0.2%)
South African: 11 (0.2%)
Armenian: 10 (0.2%)
Croatian: 6 (0.1%)
Czechoslovakian: 4 (0.09%)
Greek: 3 (0.07%)
Albanian: 2 (0.04%)
Most common places of birth for foreign-born residents (%):
Germany
Gunbarrel:
12.3% (98)
Colorado:
2.5% (13,706)
Other Australian and New Zealand Subregion
Gunbarrel:
10.2% (81)
Colorado:
0.2% (1,244)
Russia
Gunbarrel:
9.7% (77)
Colorado:
1.4% (7,860)
India
Gunbarrel:
8.7% (69)
Colorado:
4.0% (21,689)
Canada
Gunbarrel:
7.5% (60)
Colorado:
2.7% (15,026)
Ukraine
Gunbarrel:
7.2% (57)
Colorado:
0.8% (4,267)
Other Southern Africa
Gunbarrel:
5.5% (44)
Colorado:
0.0% (127)
Asia, n.e.c.
Gunbarrel:
4.9% (39)
Colorado:
0.0% (241)
France
Gunbarrel:
4.8% (38)
Colorado:
0.5% (2,620)
Nepal
Gunbarrel:
4.5% (36)
Colorado:
1.0% (5,214)
South Africa
Gunbarrel:
4.5% (36)
Colorado:
0.5% (2,472)
China, excluding Hong Kong and Taiwan
Gunbarrel:
3.6% (29)
Colorado:
3.3% (17,998)
Mexico
Gunbarrel:
2.3% (18)
Colorado:
38.3% (209,491)
Iran
Gunbarrel:
2.1% (17)
Colorado:
0.7% (3,568)
United Kingdom, excluding England and Scotland
Gunbarrel:
2.0% (16)
Colorado:
1.1% (5,799)
Japan
Gunbarrel:
1.9% (15)
Colorado:
0.7% (4,075)
Netherlands
Gunbarrel:
1.9% (15)
Colorado:
0.3% (1,640)
Lebanon
Gunbarrel:
1.5% (12)
Colorado:
0.1% (741)
Place of birth for U.S.-born residents:
This state: 2,531
Other state: 6,667
Northeast: 1,768
Midwest: 2,146
South: 1,372
West: 1,394
83.8% of Gunbarrel residents lived in the same house 1 years ago. Out of people who lived in different houses, 24.8% lived in this county. Out of people who lived in different counties, 27.0% lived in Colorado.
Gunbarrel:
83.8%
State average:
83.6%
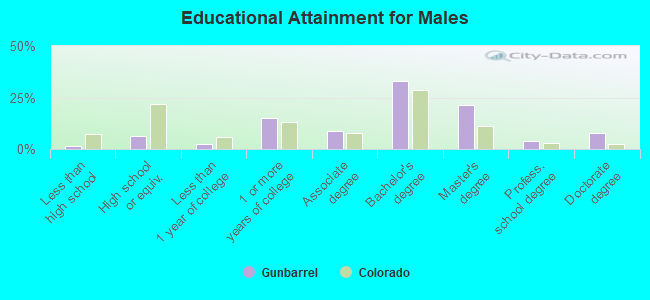
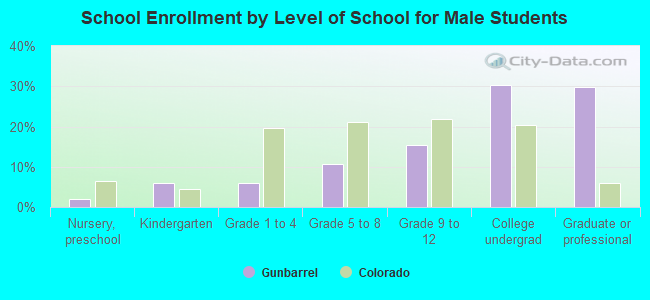
Education attainment for males 25 years and older:
No schooling: 0
Nursery to 4th grade: 0
5th and 6th grade: 5
7th and 8th grade: 0
9th grade: 0
10th grade: 0
11th grade: 0
12th grade, no diploma: 53
High school graduate (or equivalency): 265
Less than 1 year of college: 93
Some college more than 1 year, no degree: 620
Associate degree: 354
Bachelor's degree: 1,347
Master's degree: 879
Professional school degree: 168
Doctorate degree: 326
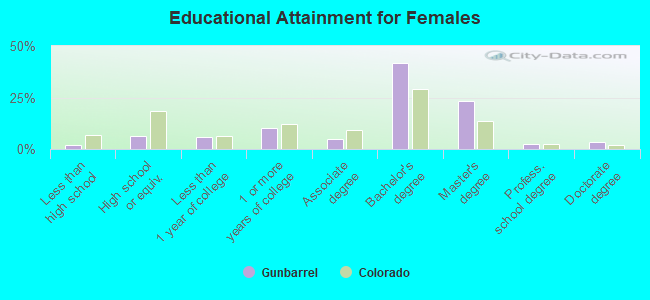
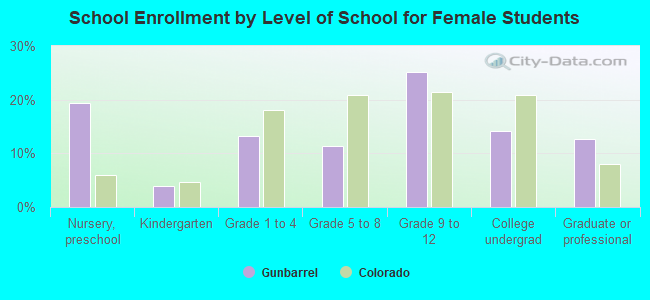
Education attainment for females 25 years and older:
No schooling: 44
Nursery to 4th grade: 0
5th and 6th grade: 0
7th and 8th grade: 0
9th grade: 0
10th grade: 4
11th grade: 0
12th grade, no diploma: 16
High school graduate (or equivalency): 241
Less than 1 year of college: 214
Some college more than 1 year, no degree: 374
Associate degree: 183
Bachelor's degree: 1,541
Master's degree: 860
Professional school degree: 87
Doctorate degree: 123
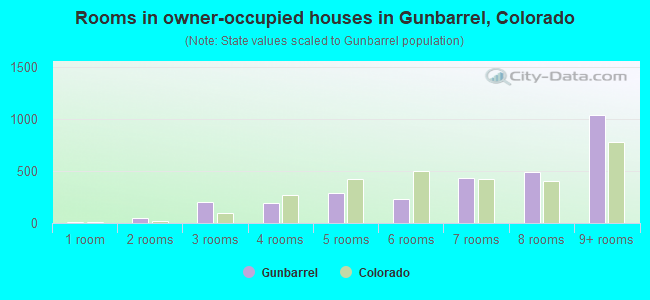
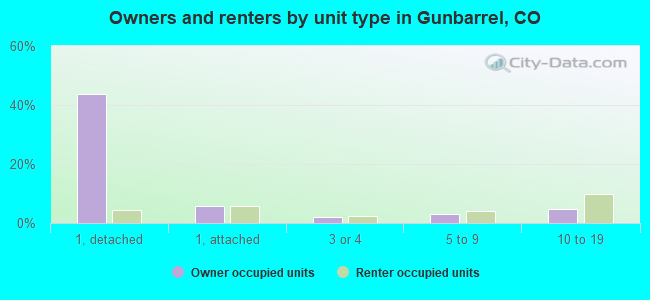
Housing units in structures:
One, detached: 2,438
One, attached: 475
3 or 4: 222
5 to 9: 372
10 to 19: 599
20 to 49: 699
50 or more: 61
Mobile homes: 20
Housing units lacking complete kitchen facilities in 2022: 0.2%
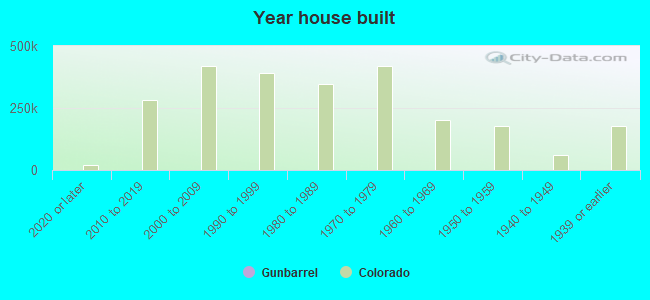
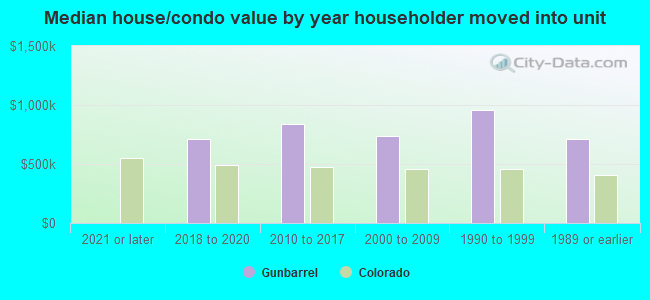
House/condo owner moved in on average 13 years ago