Jump to a detailed profile or search site with Google Custom Search

Grover Beach, CA (California) Houses and Residents

Estimated median house or condo value in 2022: $683,129 (it was $179,700 in 2000)
Grover Beach:

$683,129
California:

$715,900
Lower value quartile - upper value quartile: $541,336 - $821,267

Total population: 13,505 (Urban population: 13,006 (all inside urban clusters), Rural population: 0)

Houses: 6,041 (5,218 occupied: 3,028 owner occupied, 2,282 renter occupied)

% of renters here:

43%
State:

44%

Housing density: 2,606 houses/condos per square mile

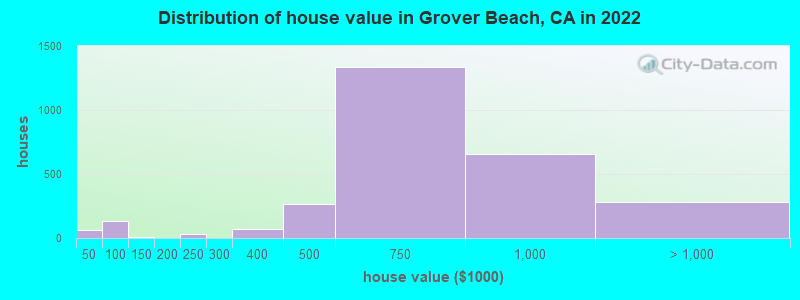
Median price asked for vacant for-sale houses and condos in 2022 in this county: $470,979.

Median contract rent in 2022: $1,750 (lower quartile is $1,525, upper quartile is $1,987)


Median rent asked for vacant for-rent units in 2022: $2,271


Median gross rent in Grover Beach, CA in 2022: $1,845

Housing units in Grover Beach with a mortgage: 2,011 (69 second mortgage, 0 home equity loan, 74 both second mortgage and home equity loan)
Houses without a mortgage: 38

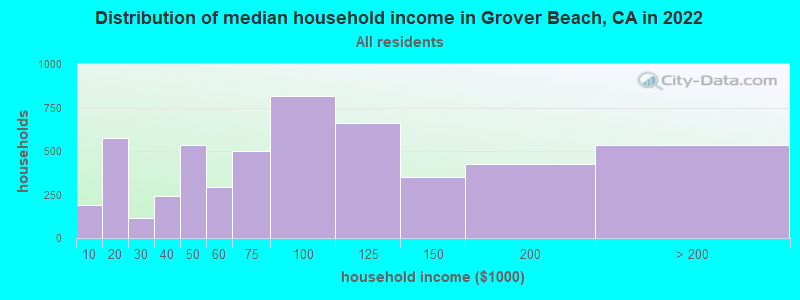
Median household income for houses/condos with a mortgage: $120,783

Median household income for apartments without a mortgage: $48,565

Median monthly housing costs: $1,769

Compare current foreclosures near Grover Beach, CA:

Check out more offers near Grover Beach, CA.
Powered by Foreclosure.com

Settings
X
Data:
Loading data...
Based on 2000-2022 data
Loading data...

123
Hide US histogram

Grover Beach, California Age and Sex of Residents
Median year house/condo built: 1976

Median year apartment built: 1973

Household type by relationship:

Households: 12,770
  • Male householders: 2,614 (638 living alone), Female householders: 2,530 (859 living alone)
  • 2,168 spouses (2,168 opposite-sex spouses), 427 unmarried partners, (420 opposite-sex unmarried partners), 3,507 children (3,172 natural, 0 adopted, 335 stepchildren), 347 grandchildren, 111 brothers or sisters, 156 parents, 0 foster children, 268 other relatives, 583 non-relatives
  • In group quarters: 55

Size of family households: 1,424 2-persons, 831 3-persons, 530 4-persons, 228 5-persons, 170 6-persons, 74 7-or-more-persons.

Size of nonfamily households: 1,540 1-person, 416 2-persons.

1,388 married couples with children.
743 single-parent households (276 men, 467 women).

74.4% of residents of Grover Beach speak English at home.
22.1% of residents speak Spanish at home (53% speak English very well, 22% speak English well, 14% speak English not well, 11% don't speak English at all).
1.2% of residents speak other Indo-European language at home (91% speak English very well, 9% speak English well).
1.8% of residents speak Asian or Pacific Island language at home (51% speak English very well, 28% speak English well, 21% speak English not well).
0.3% of residents speak other language at home (100% speak English very well).

Foreign born population: 1,379 (10.8%)
(60.6% of them are naturalized citizens)

Median number of rooms in houses and condos:
Here:

5.4
State:

6.0

Median number of rooms in apartments
Here:

3.9
State:

3.9

Owner-occupied Renter-occupied
Bedrooms in owner-occupied houses and condos in Grover Beach, California
  • Bedrooms in owner-occupied houses and condos in Grover Beach, California
  • 14no bedroom
  • 371 bedroom
  • 7452 bedrooms
  • 1,7553 bedrooms
  • 4624 bedrooms
  • 165+ bedrooms
Bedrooms in renter-occupied apartments in Grover Beach, California
  • Bedrooms in renter-occupied apartments in Grover Beach, California
  • 91no bedroom
  • 2821 bedroom
  • 1,4672 bedrooms
  • 4113 bedrooms
  • 84 bedrooms
  • 235+ bedrooms
Owner-occupied Renter-occupied
Cars and other vehicles available in Grover Beach in owner-occupied houses/condos
  • Cars and other vehicles available in Grover Beach in owner-occupied houses/condos
  • 64no vehicle
  • 1,0911 vehicle
  • 9652 vehicles
  • 6303 vehicles
  • 2334 vehicles
  • 455+ vehicles
Cars and other vehicles available in Grover Beach in renter-occupied apartments
  • Cars and other vehicles available in Grover Beach in renter-occupied apartments
  • 21no vehicle
  • 9511 vehicle
  • 8852 vehicles
  • 2763 vehicles
  • 1304 vehicles
  • 215+ vehicles
Owner-occupied Renter-occupied
Rooms in owner-occupied houses in Grover Beach, California
  • Rooms in owner-occupied houses in Grover Beach, California
  • 141 room
  • 02 rooms
  • 913 rooms
  • 4784 rooms
  • 9065 rooms
  • 6446 rooms
  • 5277 rooms
  • 2028 rooms
  • 1669+ rooms
Rooms in renter-occupied apartments in Grover Beach, California
  • Rooms in renter-occupied apartments in Grover Beach, California
  • 401 room
  • 2262 rooms
  • 913 rooms
  • 1,2254 rooms
  • 4095 rooms
  • 2356 rooms
  • 197 rooms
  • 388 rooms
  • 09+ rooms
Year house built
Median 2022 house/condo value by year built
Median house/condo value by year householder moved into unit
Breakdown of mean house values by ages of householders
Owners and renters by unit type in Grover Beach, CA
  • Grover Beach, CA household income distribution

  • Distribution of median household income in Grover Beach, CA in 2022
  • 190Less than $10,000
  • 574$10,000 to $19,999
  • 114$20,000 to $29,999
  • 242$30,000 to $39,999
  • 536$40,000 to $49,999
  • 294$50,000 to $59,999
  • 498$60,000 to $74,999
  • 815$75,000 to $99,999
  • 661$100,000 to $124,999
  • 351$125,000 to $149,999
  • 427$150,000 to $199,999
  • 533$200,000 or more
  • Home value of owner - occupied houses in 2022 in Grover Beach, CA

  • Distribution of house value in Grover Beach, CA in 2022
  • 5Less than $10,000
  • 24$25,000 to $29,999
  • 15$35,000 to $39,999
  • 17$40,000 to $49,999
  • 13$60,000 to $69,999
  • 44$70,000 to $79,999
  • 43$80,000 to $89,999
  • 11$90,000 to $99,999
  • 9$100,000 to $124,999
  • 30$200,000 to $249,999
  • 66$300,000 to $399,999
  • 268$400,000 to $499,999
  • 1,333$500,000 to $749,999
  • 654$750,000 to $999,999
  • 202$1,000,000 to $1,499,999
  • 53$1,500,000 to $1,999,999
  • 26$2,000,000 or more
  • Rent paid by renters in 2022 in Grover Beach, CA

  • Distribution of rent paid by renters in Grover Beach, CA in 2022
  • 17$500 to $549
  • 64$650 to $699
  • 32$800 to $899
  • 42$900 to $999
  • 172$1,000 to $1,249
  • 191$1,250 to $1,499
  • 1,335$1,500 to $1,999
  • 291$2,000 to $2,499
  • 65$2,500 to $2,999
  • 24$3,000 to $3,499
  • 55No cash rent
Time Leaving Home To Go To Work in 2022

Percentage of workers working in this county: 93.0%
Number of people working at home: 983 (15.0% of all workers)

Travel time (in minutes) to work in 2022

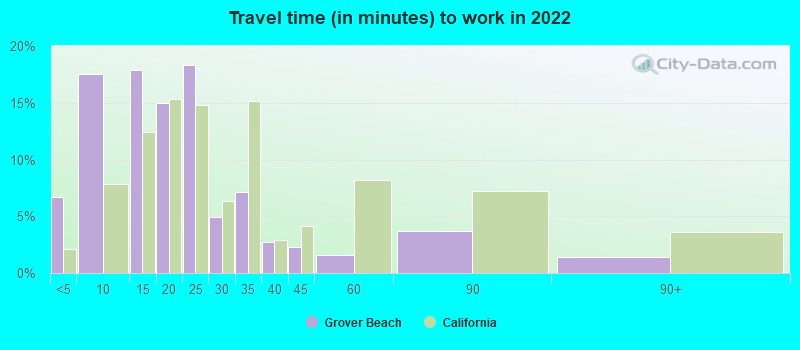
Travel time to work (commute)

  • Less than 5 minutes: 200
  • 5 to 9 minutes: 797
  • 10 to 14 minutes: 727
  • 15 to 19 minutes: 874
  • 20 to 24 minutes: 1,078
  • 25 to 29 minutes: 582
  • 30 to 34 minutes: 857
  • 35 to 39 minutes: 160
  • 40 to 44 minutes: 0
  • 45 to 59 minutes: 128
  • 60 to 89 minutes: 8
  • 90 or more minutes: 46
Means of transportation to work in 2022 - Grover Beach

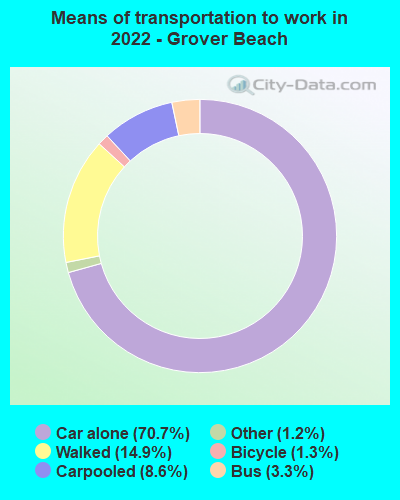
Means of transportation to work:

  • Drove a car alone: 2,695 (57.7%)
  • Carpooled: 308 (6.6%)
  • Bus: 101 (2.2%)
  • Taxi: 44 (0.9%)
  • Bicycle: 50 (1.1%)
  • Walked: 502 (10.7%)
  • Worked at home: 983 (21.0%)
Class of Workers in 2022
  • Unemployment by race in 2022
  • Unemployment rate for White non-Hispanic residents
  • 1.0%Males
  • 1.0%Females
  • Unemployment rate for American Indian and Alaska Native residents
  • 36.6%Males
  • Unemployment rate for other race residents
  • 20.0%Females
  • Unemployment rate for two or more race residents
  • 6.5%Males
  • Unemployment rate for Hispanic or Latino residents
  • 5.3%Males
  • 10.2%Females
Year of entry for the foreign-born population in Grover Beach, California
  • Year of entry for the foreign-born population in Grover Beach, California
  • 672010 or later
  • 2242000 to 2009
  • 4301990 to 1999
  • 4211980 to 1989
  • 2031970 to 1979
  • 273Before 1970
Ancestries in Grover Beach, CA

First ancestries reported:

  • German: 353 (6.6%)
  • English: 316 (6.0%)
  • American: 276 (5.2%)
  • Irish: 192 (3.6%)
  • Italian: 169 (3.2%)
  • Portuguese: 126 (2.4%)
  • European: 124 (2.3%)
  • Polish: 107 (2.0%)
  • Scottish: 94 (1.8%)
  • Danish: 73 (1.4%)
  • French Canadian: 58 (1.1%)
  • Nigerian: 47 (0.9%)
  • Dutch: 42 (0.8%)
  • African: 38 (0.7%)
  • British: 33 (0.6%)
  • Celtic: 23 (0.4%)
  • Austrian: 16 (0.3%)
  • Canadian: 13 (0.2%)
  • Eastern European: 13 (0.2%)
  • French: 8 (0.2%)

Most common places of birth for foreign-born residents (%):

Mexico
Grover Beach:

69.1% (911)
California:

37.2% (3,881,193)

Philippines
Grover Beach:

5.6% (74)
California:

7.8% (818,297)

Thailand
Grover Beach:

4.1% (54)
California:

0.6% (65,335)

Portugal
Grover Beach:

3.9% (52)
California:

0.2% (25,462)

South Africa
Grover Beach:

3.4% (45)
California:

0.2% (20,614)

Azores Islands
Grover Beach:

3.0% (39)
California:

0.1% (8,659)

Netherlands
Grover Beach:

2.8% (37)
California:

0.2% (17,937)

Nigeria
Grover Beach:

2.0% (27)
California:

0.3% (35,557)

El Salvador
Grover Beach:

1.7% (23)
California:

4.2% (440,287)

Italy
Grover Beach:

1.7% (22)
California:

0.3% (31,439)

Canada
Grover Beach:

1.7% (22)
California:

1.2% (127,477)

Place of birth for U.S.-born residents:

  • This state: 9,299
  • Other state: 2,047
  • Northeast: 250
  • Midwest: 714
  • South: 473
  • West: 598

89.2% of Grover Beach residents lived in the same house 1 years ago.
   Out of people who lived in different houses, 41.0% lived in this county.
   Out of people who lived in different counties, 85.8% lived in California.


Grover Beach:

89.2%
State average:

88.9%

Education attainment for males 25 years and older:

  • No schooling: 364
  • Nursery to 4th grade: 0
  • 5th and 6th grade: 98
  • 7th and 8th grade: 0
  • 9th grade: 19
  • 10th grade: 161
  • 11th grade: 31
  • 12th grade, no diploma: 80
  • High school graduate (or equivalency): 1,322
  • Less than 1 year of college: 292
  • Some college more than 1 year, no degree: 593
  • Associate degree: 290
  • Bachelor's degree: 932
  • Master's degree: 314
  • Professional school degree: 98
  • Doctorate degree: 50
Educational Attainment for Males

Education attainment for females 25 years and older:

  • No schooling: 272
  • Nursery to 4th grade: 31
  • 5th and 6th grade: 0
  • 7th and 8th grade: 20
  • 9th grade: 18
  • 10th grade: 53
  • 11th grade: 18
  • 12th grade, no diploma: 126
  • High school graduate (or equivalency): 753
  • Less than 1 year of college: 421
  • Some college more than 1 year, no degree: 767
  • Associate degree: 439
  • Bachelor's degree: 1,042
  • Master's degree: 286
  • Professional school degree: 268
  • Doctorate degree: 127
Educational Attainment for Females
Grover Beach marital status for males
Grover Beach marital status for females

Housing units in structures:

  • One, detached: 3,705
  • One, attached: 846
  • Two: 221
  • 3 or 4: 704
  • 5 to 9: 318
  • 10 to 19: 21
  • 20 to 49: 22
  • 50 or more: 10
  • Mobile homes: 190
Housing units lacking complete plumbing facilities in 2022: 0.4%

Housing units lacking complete kitchen facilities in 2022: 0.8%

House/condo owner moved in on average 12 years ago

Renter moved in on average 4 years ago

Year householders moved into residence in Grover Beach
Houses and condos Apartments
Most commonly used house heating fuel in houses and condos in Grover Beach, CA
  • 91.4%Utility gas
  • 8.3%Electricity
  • 0.4%Solar energy
Most commonly used house heating fuel in apartments in Grover Beach, CA
  • 65.0%Utility gas
  • 23.2%Electricity
  • 8.8%Bottled, tank, or LP gas
  • 3.0%No fuel used

Private vs. public school enrollment:

Students in private schools in grades 1 to 8 (elementary and middle school): 26
Here:

2.2%
California:

10.5%

Students in private schools in grades 9 to 12 (high school): 10
Here:

1.9%
California:

8.5%

Students in private undergraduate colleges: 183
Here:

45.5%
California:

15.9%
School Enrollment by Level of School for Male Students
School Enrollment by Level of School for Female Students
Age and Sex of Sensory-Disabled Noninstitutionalized Residents
Age and Sex of Physically-Disabled Noninstitutionalized Residents
Age and Sex of Mentally-Disabled Noninstitutionalized Residents
Age and Sex of Self-Care Disabled Noninstitutionalized Residents
Age and Sex of Go-Outside-Home Disabled Noninstitutionalized Residents
Age and Sex of Noninstitutionalized Residents with Employment Disability