Great Falls, MT (Montana) Houses and Residents
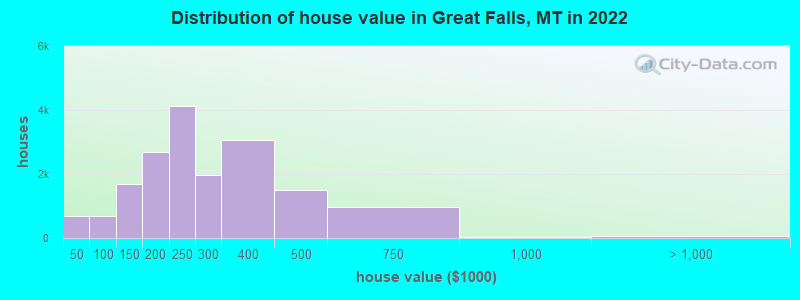
Estimated median house or condo value in 2022: $242,866 (it was $89,700 in 2000 )
Great Falls:
$242,866Montana:
$366,400
Lower value quartile - upper value quartile: $174,363 - $337,504Mean price in 2022: Detached houses: $294,289 Here:
$294,289State:
$518,333
Townhouses or other attached units: $537,503 Here:
$537,503State:
$468,033
In 2-unit structures: $190,706 Here:
$190,706State:
$254,784
In 3-to-4-unit structures: $282,965 Here:
$282,965State:
$383,074
In 5-or-more-unit structures: $157,418 Here:
$157,418State:
$373,935
Mobile homes: $122,657 Here:
$122,657State:
$139,111
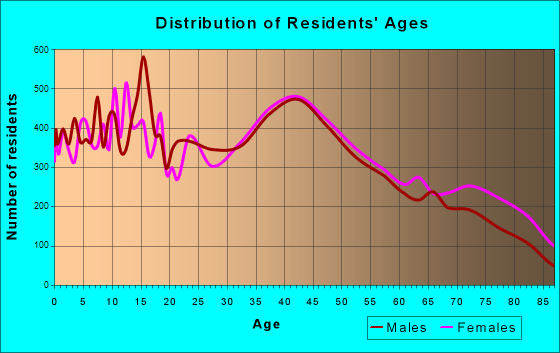
Total population: 59,152 (Urban population: 56,627, Rural population: 17 (all nonfarm) )
Houses: 28,351 (25,959 occupied: 17,406 owner occupied, 8,883 renter occupied )
% of renters here:
34%State:
31%
Housing density: 1,455 houses/condos per square mile
Median price asked for vacant for-sale houses and condos in 2022: $154,237.
Median contract rent in 2022: $711 (lower quartile is $555, upper quartile is $936)
Median rent asked for vacant for-rent units in 2022: $1,164
Median gross rent in Great Falls, MT in 2022: $800
Housing units in Great Falls with a mortgage: 11,296 (557 second mortgage, 26 home equity loan, 437 both second mortgage and home equity loan )Houses without a mortgage: 158
Median household income for houses/condos with a mortgage: $77,016
Median household income for apartments without a mortgage: $54,992
Median monthly housing costs: $884
Data:
Median house or condo value ($)
Median house or condo value ($ change since 2000)
Median house or condo value ($) - White
Median house or condo value ($) - Black or African American
Median house or condo value ($) - Asian
Median house or condo value ($) - Hispanic or Latino
Median house or condo value ($) - American Indian and Alaska Native
Median house or condo value ($) - Multirace
Median house or condo value ($) - Other Race
Median price asked for mobile homes ($)
Household density (households per square mile)
Mean house or condo value by units in structure - 1, detached ($)
Mean house or condo value by units in structure - 1, attached ($)
Mean house or condo value by units in structure - 2 ($)
Mean house or condo value by units in structure by units in structure - 3 or 4 ($)
Mean house or condo value by units in structure - 5 or more ($)
Mean house or condo value by units in structure - Boat, RV, van, etc. ($)
Mean house or condo value by units in structure - Mobile home ($)
Median contract rent ($)
Median contract rent - Lower quartile ($)
Median contract rent - Upper quartile ($)
Median gross rent ($)
Urban houses (%)
Rural houses (%)
Houses occupied (%)
Houses occupied (% change since 2000)
Houses owner occupied (%)
Houses owner occupied (% change since 2000)
Houses renter occupied (%)
Houses renter occupied (% change since 2000)
Vacant housing units - For rent (%)
Vacant housing units - For rent (% change since 2000)
Vacant housing units - For sale only (%)
Vacant housing units - For sale only (% change since 2000)
Vacant housing units - Rented or sold, not occupied (%)
Vacant housing units - Rented or sold, not occupied (% change since 2000)
Vacant housing units - For seasonal, recreational, or occasional use (%)
Vacant housing units - For seasonal, recreational, or occasional use (% change since 2000)
Vacant housing units - For migrant workers (%)
Vacant housing units - For migrant workers (% change since 2000)
Vacant housing units - Other vacant (%)
Vacant housing units - Other vacant (% change since 2000)
Median monthly housing costs ($)
Median household income for houses/condos with a mortgage ($)
Median household income for houses/condos without a mortgage ($)
Median household income ($)
Median household income ($) - White
Median household income ($) - Black or African American
Median household income ($) - Asian
Median household income ($) - Hispanic or Latino
Median household income ($) - American Indian and Alaska Native
Median household income ($) - Multirace
Median household income ($) - Other Race
Mortgage status - with mortgage (%)
Mortgage status - with second mortgage (%)
Mortgage status - with home equity loan (%)
Mortgage status - with both second mortgage and home equity loan (%)
Mortgage status - without a mortgage (%)
Median year house/condo built
Median year apartment built
Household type by relationship - Male householder living alone (%)
Household type by relationship - Male householder not living alone (%)
Household type by relationship - Female householder living alone (%)
Household type by relationship - Female householder not living alone (%)
Household type by relationship - Opposite-Sex spouse (%)
Household type by relationship - Same-Sex spouse (%)
Household type by relationship - Opposite-Sex unmarried partner (%)
Household type by relationship - Same-Sex unmarried partner (%)
Household type by relationship - In group quarters (%)
Size of family households - 2-person household (%)
Size of family households - 3-person household (%)
Size of family households - 4-person household (%)
Size of family households - 5-person household (%)
Size of family households - 6-person household (%)
Size of family households - 7-or-more-person household (%)
Size of nonfamily households - 1-person household (%)
Size of nonfamily households - 2-person household (%)
Size of nonfamily households - 3-person household (%)
Size of nonfamily households - 4-person household (%)
Size of nonfamily households - 5-person household (%)
Size of nonfamily households - 6-person household (%)
Size of nonfamily households - 7-or-moreperson household (%)
Year house built - Built 2010 or later (%)
Year house built - Built 2000 to 2009 (%)
Year house built - Built 1990 to 1999 (%)
Year house built - Built 1980 to 1989 (%)
Year house built - Built 1970 to 1979 (%)
Year house built - Built 1960 to 1969 (%)
Year house built - Built 1950 to 1959 (%)
Year house built - Built 1940 to 1949 (%)
Year house built - Built 1939 or earlier (%)
Median number of rooms in houses and condos
Median number of rooms in apartments
Median number of bedrooms in owner occupied houses
Mean number of bedrooms in owner occupied houses
Median number of bedrooms in renter occupied houses
Mean number of bedrooms in renter occupied houses
Median number of vehichles in owner occupied houses
Mean number of vehichles in owner occupied houses
Median number of vehichles in renter occupied houses
Mean number of vehichles in renter occupied houses
Rooms in owner-occupied houses - 1 room (%)
Rooms in owner-occupied houses - 2 rooms (%)
Rooms in owner-occupied houses - 3 rooms (%)
Rooms in owner-occupied houses - 4 rooms (%)
Rooms in owner-occupied houses - 5 rooms (%)
Rooms in owner-occupied houses - 6 rooms (%)
Rooms in owner-occupied houses - 7 rooms (%)
Rooms in owner-occupied houses - 8 rooms (%)
Rooms in owner-occupied houses - 9+ rooms (%)
Rooms in renter-occupied houses - 1 room (%)
Rooms in renter-occupied houses - 2 rooms (%)
Rooms in renter-occupied houses - 3 rooms (%)
Rooms in renter-occupied houses - 4 rooms (%)
Rooms in renter-occupied houses - 5 rooms (%)
Rooms in renter-occupied houses - 6 rooms (%)
Rooms in renter-occupied houses - 7 rooms (%)
Rooms in renter-occupied houses - 8 rooms (%)
Rooms in renter-occupied houses - 9+ rooms (%)
Bedrooms in owner-occupied houses - no bedrooms (%)
Bedrooms in owner-occupied houses - 1 bedroom (%)
Bedrooms in owner-occupied houses - 2 bedrooms (%)
Bedrooms in owner-occupied houses - 3 bedrooms (%)
Bedrooms in owner-occupied houses - 4 bedrooms (%)
Bedrooms in owner-occupied houses - 5+ bedrooms (%)
Bedrooms in renter-occupied houses - no bedrooms (%)
Bedrooms in renter-occupied houses - 1 bedroom (%)
Bedrooms in renter-occupied houses - 2 bedrooms (%)
Bedrooms in renter-occupied houses - 3 bedrooms (%)
Bedrooms in renter-occupied houses - 4 bedrooms (%)
Bedrooms in renter-occupied houses - 5+ bedrooms (%)
Vehicles available in owner-occupied houses - no vehicle available (%)
Vehicles available in owner-occupied houses - 1 vehicle available(%)
Vehicles available in owner-occupied houses - 2 Vehicles available (%)
Vehicles available in owner-occupied houses - 3 Vehicles available (%)
Vehicles available in owner-occupied houses - 4 Vehicles available (%)
Vehicles available in owner-occupied houses - 5+ Vehicles available (%)
Vehicles available in renter-occupied houses - no vehicle available (%)
Vehicles available in renter-occupied houses - 1 vehicle available (%)
Vehicles available in renter-occupied houses - 2 Vehicles available (%)
Vehicles available in renter-occupied houses - 3 Vehicles available (%)
Vehicles available in renter-occupied houses - 4 Vehicles available (%)
Vehicles available in renter-occupied houses - 5+ Vehicles available (%)
Housing units in structures - 1, detached (%)
Housing units in structures - 1, attached (%)
Housing units in structures - 2 (%)
Housing units in structures - 3 or 4 (%)
Housing units in structures - 5 to 9 (%)
Housing units in structures - 10 to 19 (%)
Housing units in structures - 20 to 49 (%)
Housing units in structures - 50 or more (%)
Housing units in structures - Mobile home (%)
Housing units in structures - Boat, RV, van, etc. (%)
Housing units in structures - Owners - 1, detached (%)
Housing units in structures - Owners - 1, attached (%)
Housing units in structures - Owners - 2 (%)
Housing units in structures - Owners - 3 or 4 (%)
Housing units in structures - Owners - 5 to 9 (%)
Housing units in structures - Owners - 10 to 19 (%)
Housing units in structures - Owners - 20 to 49 (%)
Housing units in structures - Owners - 50 or more (%)
Housing units in structures - Owners - Mobile home (%)
Housing units in structures - Owners - Boat, RV, van, etc. (%)
Housing units in structures - Renters - 1, detached (%)
Housing units in structures - Renters - 1, attached (%)
Housing units in structures - Renters - 2 (%)
Housing units in structures - Renters - 3 or 4 (%)
Housing units in structures - Renters - 5 to 9 (%)
Housing units in structures - Renters - 10 to 19 (%)
Housing units in structures - Renters - 20 to 49 (%)
Housing units in structures - Renters - 50 or more (%)
Housing units in structures - Renters - Mobile home (%)
Housing units in structures - Renters - Boat, RV, van, etc. (%)
House/condo owner moved in on average (years ago)
Renter moved in on average (years ago)
Year householder moved into unit - Moved in 1999 to March 2000 (%)
Year householder moved into unit - Moved in 1999 to March 2000 (%) - White
Year householder moved into unit - Moved in 1999 to March 2000 (%) - Black or African American
Year householder moved into unit - Moved in 1999 to March 2000 (%) - Asian
Year householder moved into unit - Moved in 1999 to March 2000 (%) - Hispanic or Latino
Year householder moved into unit - Moved in 1999 to March 2000 (%) - American Indian and Alaska Native
Year householder moved into unit - Moved in 1999 to March 2000 (%) - Multirace
Year householder moved into unit - Moved in 1999 to March 2000 (%) - Other Race
Year householder moved into unit - Moved in 1995 to 1998 (%)
Year householder moved into unit - Moved in 1995 to 1998 (%) - White
Year householder moved into unit - Moved in 1995 to 1998 (%) - Black or African American
Year householder moved into unit - Moved in 1995 to 1998 (%) - Asian
Year householder moved into unit - Moved in 1995 to 1998 (%) - Hispanic or Latino
Year householder moved into unit - Moved in 1995 to 1998 (%) - American Indian and Alaska Native
Year householder moved into unit - Moved in 1995 to 1998 (%) - Multirace
Year householder moved into unit - Moved in 1995 to 1998 (%) - Other Race
Year householder moved into unit - Moved in 1990 to 1994 (%)
Year householder moved into unit - Moved in 1990 to 1994 (%) - White
Year householder moved into unit - Moved in 1990 to 1994 (%) - Black or African American
Year householder moved into unit - Moved in 1990 to 1994 (%) - Asian
Year householder moved into unit - Moved in 1990 to 1994 (%) - Hispanic or Latino
Year householder moved into unit - Moved in 1990 to 1994 (%) - American Indian and Alaska Native
Year householder moved into unit - Moved in 1990 to 1994 (%) - Multirace
Year householder moved into unit - Moved in 1990 to 1994 (%) - Other Race
Year householder moved into unit - Moved in 1980 to 1989 (%)
Year householder moved into unit - Moved in 1980 to 1989 (%) - White
Year householder moved into unit - Moved in 1980 to 1989 (%) - Black or African American
Year householder moved into unit - Moved in 1980 to 1989 (%) - Asian
Year householder moved into unit - Moved in 1980 to 1989 (%) - Hispanic or Latino
Year householder moved into unit - Moved in 1980 to 1989 (%) - American Indian and Alaska Native
Year householder moved into unit - Moved in 1980 to 1989 (%) - Multirace
Year householder moved into unit - Moved in 1980 to 1989 (%) - Other Race
Year householder moved into unit - Moved in 1970 to 1979 (%)
Year householder moved into unit - Moved in 1970 to 1979 (%) - White
Year householder moved into unit - Moved in 1970 to 1979 (%) - Black or African American
Year householder moved into unit - Moved in 1970 to 1979 (%) - Asian
Year householder moved into unit - Moved in 1970 to 1979 (%) - Hispanic or Latino
Year householder moved into unit - Moved in 1970 to 1979 (%) - American Indian and Alaska Native
Year householder moved into unit - Moved in 1970 to 1979 (%) - Multirace
Year householder moved into unit - Moved in 1970 to 1979 (%) - Other Race
Year householder moved into unit - Moved in 1969 or earlier (%)
Year householder moved into unit - Moved in 1969 or earlier (%) - White
Year householder moved into unit - Moved in 1969 or earlier (%) - Black or African American
Year householder moved into unit - Moved in 1969 or earlier (%) - Asian
Year householder moved into unit - Moved in 1969 or earlier (%) - Hispanic or Latino
Year householder moved into unit - Moved in 1969 or earlier (%) - American Indian and Alaska Native
Year householder moved into unit - Moved in 1969 or earlier (%) - Multirace
Year householder moved into unit - Moved in 1969 or earlier (%) - Other Race
Housing units lacking complete plumbing facilities (%)
Housing units lacking complete kitchen facilities (%)
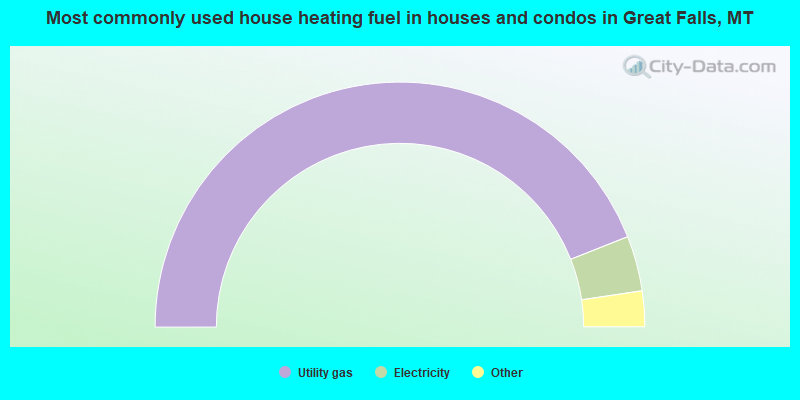
House heating fuel used in houses and condos - Utility gas (%)
House heating fuel used in houses and condos - Bottled, tank, or LP gas (%)
House heating fuel used in houses and condos - Electricity (%)
House heating fuel used in houses and condos - Fuel oil, kerosene, etc. (%)
House heating fuel used in houses and condos - Coal or coke (%)
House heating fuel used in houses and condos - Wood (%)
House heating fuel used in houses and condos - Solar energy (%)
House heating fuel used in houses and condos - Other fuel (%)
House heating fuel used in houses and condos - No fuel used (%)
House heating fuel used in apartments - Utility gas (%)
House heating fuel used in apartments - Bottled, tank, or LP gas (%)
House heating fuel used in apartments - Electricity (%)
House heating fuel used in apartments - Fuel oil, kerosene, etc. (%)
House heating fuel used in apartments - Coal or coke (%)
House heating fuel used in apartments - Wood (%)
House heating fuel used in apartments - Solar energy (%)
House heating fuel used in apartments - Other fuel (%)
House heating fuel used in apartments - No fuel used (%)
Median year house/condo built: 1964Median year apartment built: 1970Household type by relationship:
Households: 60,688
Male householders: 12,591 (4,199 living alone ), Female householders: 13,262 (5,275 living alone )10,645 spouses (10,574 opposite-sex spouses ), 1,697 unmarried partners , (1,576 opposite-sex unmarried partners ), 15,533 children (14,283 natural , 378 adopted , 871 stepchildren ), 1,180 grandchildren , 458 brothers or sisters , 483 parents , 90 foster children , 573 other relatives , 2,248 non-relatives In group quarters: 1,921
Size of family households: 7,834 2-persons , 2,884 3-persons , 2,042 4-persons , 1,013 5-persons , 343 6-persons , 353 7-or-more-persons .
Size of nonfamily households: 10,295 1-person , 1,275 2-persons , 67 3-persons , 137 4-persons , 11 6-persons , 36 7-or-more-persons .
6,786 married couples with children. single-parent households (844 men , 2,510 women ).
96.6% of residents of Great Falls speak English at home. of residents speak Spanish at home (57% speak English very well , 35% speak English well , 8% speak English not well ).of residents speak other Indo-European language at home (81% speak English very well , 13% speak English well , 6% speak English not well ).of residents speak Asian or Pacific Island language at home (52% speak English very well , 48% speak English well ).of residents speak other language at home (65% speak English very well , 35% speak English well ).
Foreign born population: 755 (1.2%)of them are naturalized citizens )
Median number of rooms in houses and condos:
Median number of rooms in apartments
Owner-occupied Renter-occupied
Rooms in owner-occupied houses in Great Falls, Montana
0 1 room 37 2 rooms 383 3 rooms 1,612 4 rooms 2,480 5 rooms 3,084 6 rooms 3,006 7 rooms 2,235 8 rooms 4,569 9+ rooms
Rooms in renter-occupied apartments in Great Falls, Montana
515 1 room 740 2 rooms 1,616 3 rooms 2,879 4 rooms 1,445 5 rooms 689 6 rooms 508 7 rooms 261 8 rooms 230 9+ rooms
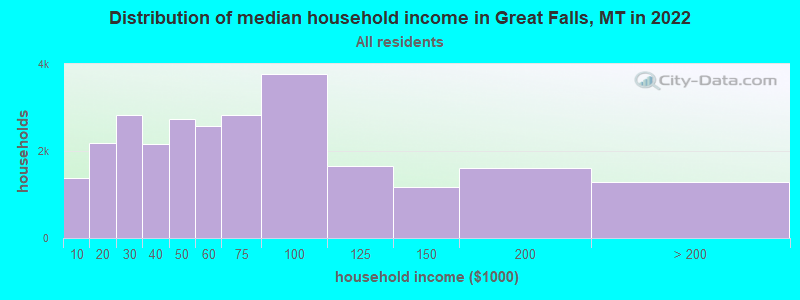
Great Falls, MT household income distribution 1,373 Less than $10,0002,181 $10,000 to $19,9992,822 $20,000 to $29,9992,152 $30,000 to $39,9992,732 $40,000 to $49,9992,578 $50,000 to $59,9992,818 $60,000 to $74,9993,776 $75,000 to $99,9991,644 $100,000 to $124,9991,181 $125,000 to $149,9991,609 $150,000 to $199,9991,283 $200,000 or more
Home value of owner - occupied houses in 2022 in Great Falls, MT 118 Less than $10,00091 $10,000 to $14,999120 $15,000 to $19,99988 $20,000 to $24,999100 $25,000 to $29,99964 $30,000 to $34,999107 $40,000 to $49,99959 $50,000 to $59,99965 $60,000 to $69,999243 $70,000 to $79,99990 $80,000 to $89,999119 $90,000 to $99,999825 $100,000 to $124,999875 $125,000 to $149,9991,669 $150,000 to $174,9991,004 $175,000 to $199,9994,111 $200,000 to $249,9991,954 $250,000 to $299,9993,059 $300,000 to $399,9991,503 $400,000 to $499,999976 $500,000 to $749,99942 $750,000 to $999,99956 $1,000,000 to $1,499,99920 $2,000,000 or moreRent paid by renters in 2022 in Great Falls, MT 129 Less than $10018 $100 to $149119 $150 to $199184 $200 to $249195 $250 to $299240 $300 to $349350 $350 to $399238 $400 to $449257 $450 to $499449 $500 to $549299 $550 to $599758 $600 to $649803 $650 to $699571 $700 to $749417 $750 to $7991,088 $800 to $899422 $900 to $9991,042 $1,000 to $1,249586 $1,250 to $1,499164 $1,500 to $1,9997 $2,000 to $2,49919 $2,500 to $2,99995 $3,000 to $3,49964 $3,500 or more425 No cash rent
Percentage of workers working in this county: 98.4%Number of people working at home: 2,022 (6.6% of all workers )
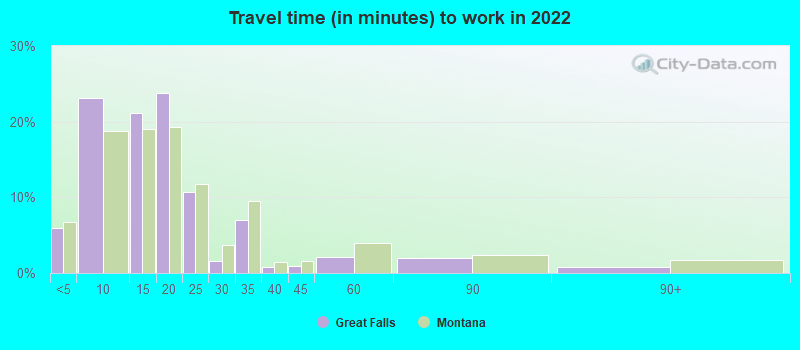
Travel time to work (commute)
Less than 5 minutes: 1,4945 to 9 minutes: 7,34310 to 14 minutes: 6,46515 to 19 minutes: 7,31520 to 24 minutes: 2,45125 to 29 minutes: 37730 to 34 minutes: 1,18835 to 39 minutes: 4740 to 44 minutes: 8445 to 59 minutes: 25560 to 89 minutes: 33490 or more minutes: 347
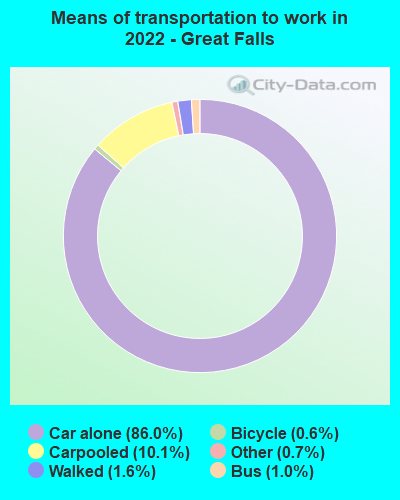
Means of transportation to work:
Drove a car alone: 26,639 (78.0%)Carpooled: 3,690 (10.8%)Bus : 253 (0.7%)Taxi: 262 (0.8%)Bicycle: 164 (0.5%)Walked: 550 (1.6%)Worked at home: 2,022 (5.9%)
Unemployment by race in 2022
Unemployment rate for White non-Hispanic residents 2.2% Males1.7% FemalesUnemployment rate for Black residents 53.5% MalesUnemployment rate for American Indian and Alaska Native residents 12.7% Males12.7% FemalesUnemployment rate for other race residents 4.3% MalesUnemployment rate for two or more race residents 0.9% Males0.5% FemalesUnemployment rate for Hispanic or Latino residents 4.9% Males2.2% Females
Year of entry for the foreign-born population in Great Falls, Montana
179 2010 or later 98 2000 to 2009 176 1990 to 1999 239 1980 to 1989 158 1970 to 1979 754 Before 1970
First ancestries reported:
German: 4,053 (15.2%)
American: 3,406 (12.8%)
English: 2,843 (10.7%)
Irish: 2,128 (8.0%)
Norwegian: 1,982 (7.4%)
Italian: 1,073 (4.0%)
Scandinavian: 648 (2.4%)
European: 592 (2.2%)
Scottish: 525 (2.0%)
Scotch-Irish: 490 (1.8%)
Polish: 331 (1.2%)
Dutch: 208 (0.8%)
French Canadian: 207 (0.8%)
Finnish: 181 (0.7%)
Welsh: 152 (0.6%)
Swedish: 136 (0.5%)
Russian: 127 (0.5%)
Danish: 118 (0.4%)
French: 113 (0.4%)
Croatian: 100 (0.4%)
Czech: 88 (0.3%)
Northern European: 81 (0.3%)
Iranian: 76 (0.3%)
British: 58 (0.2%)
Austrian: 53 (0.2%)
Eastern European: 50 (0.2%)
Slovene: 44 (0.2%)
Slavic: 36 (0.1%)
Lithuanian: 28 (0.1%)
Ukrainian: 26 (0.10%)
Jamaican: 26 (0.10%)
Yugoslavian: 25 (0.09%)
Portuguese: 24 (0.09%)
Romanian: 22 (0.08%)
Czechoslovakian: 21 (0.08%)
Greek: 17 (0.06%)
Slovak: 16 (0.06%)
Canadian: 16 (0.06%)
Basque: 15 (0.06%)
Cajun: 14 (0.05%)
Armenian: 11 (0.04%)
Hungarian: 9 (0.03%)
Haitian: 9 (0.03%)
Latvian: 6 (0.02%)
Luxembourger: 6 (0.02%)
Turkish: 5 (0.02%)
Bulgarian: 4 (0.02%)
Most common places of birth for foreign-born residents (%): China, excluding Hong Kong and Taiwan Great Falls:
15.7% (147)Montana:
4.8% (1,184)
Canada Great Falls:
12.5% (117)Montana:
14.2% (3,503)
England Great Falls:
10.4% (98)Montana:
1.6% (406)
Germany Great Falls:
10.2% (96)Montana:
9.3% (2,310)
Philippines Great Falls:
8.1% (76)Montana:
7.0% (1,735)
India Great Falls:
6.7% (63)Montana:
1.7% (415)
Nicaragua Great Falls:
5.5% (52)Montana:
0.4% (90)
Japan Great Falls:
3.6% (34)Montana:
1.6% (385)
Costa Rica Great Falls:
3.3% (31)Montana:
0.2% (41)
Hong Kong Great Falls:
2.5% (23)Montana:
1.0% (244)
Romania Great Falls:
2.2% (21)Montana:
1.0% (259)
United Kingdom, excluding England and Scotland Great Falls:
2.1% (20)Montana:
3.0% (738)
Iran Great Falls:
1.8% (17)Montana:
0.7% (172)
Russia Great Falls:
1.6% (15)Montana:
1.7% (425)
South Africa Great Falls:
1.6% (15)Montana:
1.0% (241)
Colombia Great Falls:
1.6% (15)Montana:
1.0% (255)
Place of birth for U.S.-born residents:
This state: 37,429Other state: 21,955Northeast: 1,689Midwest: 5,907South: 4,594West: 9,744 83.6% of Great Falls residents lived in the same house 1 years ago.
Out of people who lived in different houses, 37.0% lived in this county.
Out of people who lived in different counties, 40.1% lived in Montana.
Great Falls:
83.6%State average:
86.7%
Education attainment for males 25 years and older:
No schooling: 121Nursery to 4th grade: 05th and 6th grade: 57th and 8th grade: 6089th grade: 10310th grade: 20211th grade: 25012th grade, no diploma: 273High school graduate (or equivalency): 7,681Less than 1 year of college: 1,392Some college more than 1 year, no degree: 3,079Associate degree: 1,799Bachelor's degree: 3,352Master's degree: 1,323Professional school degree: 460Doctorate degree: 135
Education attainment for females 25 years and older:
No schooling: 204Nursery to 4th grade: 235th and 6th grade: 567th and 8th grade: 2039th grade: 14810th grade: 12111th grade: 21412th grade, no diploma: 125High school graduate (or equivalency): 7,038Less than 1 year of college: 1,416Some college more than 1 year, no degree: 3,295Associate degree: 2,664Bachelor's degree: 3,628Master's degree: 2,352Professional school degree: 260Doctorate degree: 200
Housing units in structures:
One, detached: 18,353One, attached: 1,141Two: 9953 or 4: 1,7625 to 9: 79210 to 19: 1,63020 to 49: 1,56950 or more: 966Mobile homes: 1,139Median worth of mobile homes: $47,409
Housing units lacking complete plumbing facilities in 2022: 0.5%Housing units lacking complete kitchen facilities in 2022: 1.2%House/condo owner moved in on average 11 years ago
Renter moved in on average 3 years ago
Private vs. public school enrollment:
Students in private schools in grades 1 to 8 (elementary and middle school): 841 Students in private schools in grades 9 to 12 (high school): 130 Students in private undergraduate colleges: 484