Jump to a detailed profile or search site with Google Custom Search

Goleta, CA (California) Houses and Residents

Estimated median house or condo value in 2022: $948,794 (it was $395,100 in 2000)
Goleta:

$948,794
California:

$715,900
Lower value quartile - upper value quartile: $788,498 - $1,346,237

Mean price in 2022:

Detached houses: $1,229,957
Here:

$1,229,957
State:

$988,808

Townhouses or other attached units: $681,026
Here:

$681,026
State:

$838,546

In 3-to-4-unit structures: $794,097
Here:

$794,097
State:

$824,253

In 5-or-more-unit structures: $431,988
Here:

$431,988
State:

$730,996

Mobile homes: $364,706
Here:

$364,706
State:

$184,506

Total population: 30,797 (All urban)

Houses: 12,750 (12,096 occupied: 6,231 owner occupied, 5,933 renter occupied)

% of renters here:

49%
State:

44%

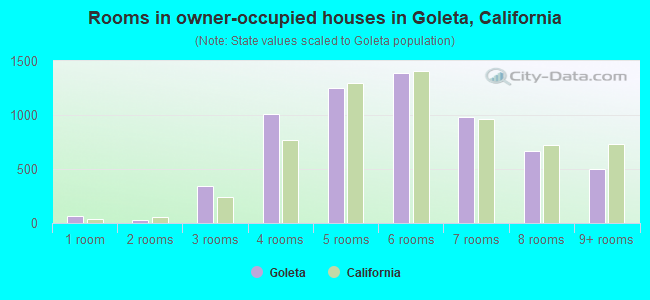
Housing density: 486 houses/condos per square mile

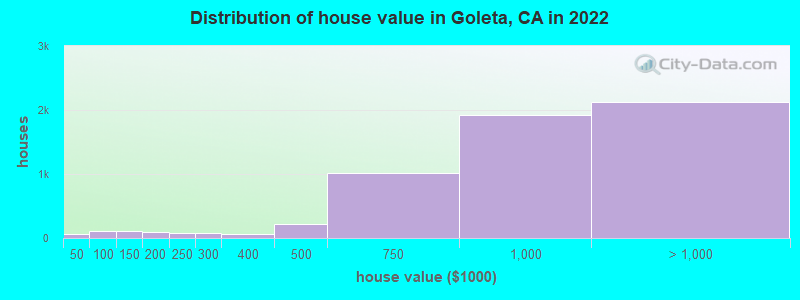
Median price asked for vacant for-sale houses and condos in 2022: $766,137.

Median contract rent in 2022: over $2,000 (lower quartile is $1,534, upper quartile is over $2,000)


Median rent asked for vacant for-rent units in 2022: $2,487


Median gross rent in Goleta, CA in 2022: over $2,000

Housing units in Goleta with a mortgage: 3,854 (522 second mortgage, 39 home equity loan, 401 both second mortgage and home equity loan)
Houses without a mortgage: 28

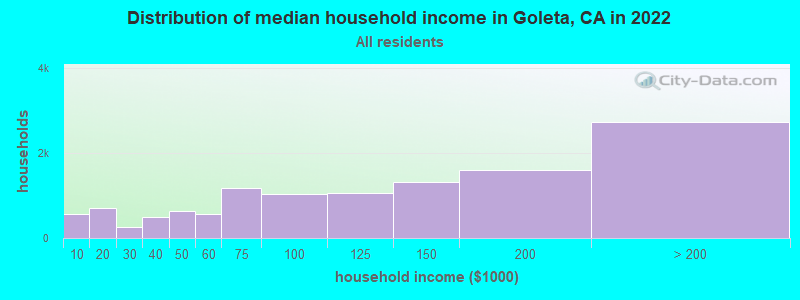
Median household income for houses/condos with a mortgage: $172,305

Median household income for apartments without a mortgage: $88,308

Median monthly housing costs: $2,233

Compare current foreclosures near Goleta, CA:

Check out more offers near Goleta, CA.
Powered by Foreclosure.com

Settings
X
Data:
Loading data...
Based on 2000-2022 data
Loading data...

123
Hide US histogram

Latest news about housing in Goleta, CA collected exclusively by city-data.com from local newspapers, TV, and radio stations

Goleta, California Age and Sex of Residents
Median year house/condo built: 1969

Median year apartment built: 1979

Household type by relationship:

Households: 32,539
  • Male householders: 6,310 (1,580 living alone), Female householders: 5,590 (1,471 living alone)
  • 5,360 spouses (5,322 opposite-sex spouses), 1,251 unmarried partners, (1,205 opposite-sex unmarried partners), 8,951 children (8,670 natural, 147 adopted, 133 stepchildren), 914 grandchildren, 250 brothers or sisters, 519 parents, 0 foster children, 314 other relatives, 2,839 non-relatives
  • In group quarters: 238

Size of family households: 2,760 2-persons, 1,489 3-persons, 1,841 4-persons, 575 5-persons, 280 6-persons, 218 7-or-more-persons.

Size of nonfamily households: 3,061 1-person, 1,200 2-persons, 460 3-persons, 426 4-persons, 37 5-persons, 47 6-persons.

3,618 married couples with children.
1,721 single-parent households (298 men, 1,423 women).

65.8% of residents of Goleta speak English at home.
21.1% of residents speak Spanish at home (60% speak English very well, 17% speak English well, 19% speak English not well, 4% don't speak English at all).
4.6% of residents speak other Indo-European language at home (87% speak English very well, 12% speak English well, 2% speak English not well).
7.6% of residents speak Asian or Pacific Island language at home (66% speak English very well, 23% speak English well, 11% speak English not well).
0.6% of residents speak other language at home (53% speak English very well, 7% speak English well, 36% speak English not well, 3% don't speak English at all).

Foreign born population: 7,214 (22.2%)
(50.7% of them are naturalized citizens)

Median number of rooms in houses and condos:
Here:

5.8
State:

6.0

Median number of rooms in apartments
Here:

3.5
State:

3.9

Owner-occupied Renter-occupied
Bedrooms in owner-occupied houses and condos in Goleta, California
  • Bedrooms in owner-occupied houses and condos in Goleta, California
  • 64no bedroom
  • 2391 bedroom
  • 9622 bedrooms
  • 2,7623 bedrooms
  • 1,7304 bedrooms
  • 4745+ bedrooms
Bedrooms in renter-occupied apartments in Goleta, California
  • Bedrooms in renter-occupied apartments in Goleta, California
  • 770no bedroom
  • 1,9021 bedroom
  • 1,7132 bedrooms
  • 1,0153 bedrooms
  • 4724 bedrooms
  • 625+ bedrooms
Owner-occupied Renter-occupied
Cars and other vehicles available in Goleta in owner-occupied houses/condos
  • Cars and other vehicles available in Goleta in owner-occupied houses/condos
  • 100no vehicle
  • 1,3881 vehicle
  • 2,7512 vehicles
  • 1,2113 vehicles
  • 5374 vehicles
  • 2455+ vehicles
Cars and other vehicles available in Goleta in renter-occupied apartments
  • Cars and other vehicles available in Goleta in renter-occupied apartments
  • 581no vehicle
  • 2,1631 vehicle
  • 1,9822 vehicles
  • 6113 vehicles
  • 2674 vehicles
  • 3295+ vehicles
Owner-occupied Renter-occupied
Rooms in owner-occupied houses in Goleta, California
  • Rooms in owner-occupied houses in Goleta, California
  • 641 room
  • 312 rooms
  • 3393 rooms
  • 1,0094 rooms
  • 1,2485 rooms
  • 1,3886 rooms
  • 9857 rooms
  • 6708 rooms
  • 4979+ rooms
Rooms in renter-occupied apartments in Goleta, California
  • Rooms in renter-occupied apartments in Goleta, California
  • 7181 room
  • 8632 rooms
  • 1,2233 rooms
  • 1,1614 rooms
  • 9145 rooms
  • 6216 rooms
  • 1797 rooms
  • 1978 rooms
  • 589+ rooms
Year house built
Median 2022 house/condo value by year built
Median house/condo value by year householder moved into unit
Breakdown of mean house values by ages of householders
Owners and renters by unit type in Goleta, CA
  • Goleta, CA household income distribution

  • Distribution of median household income in Goleta, CA in 2022
  • 574Less than $10,000
  • 701$10,000 to $19,999
  • 252$20,000 to $29,999
  • 506$30,000 to $39,999
  • 642$40,000 to $49,999
  • 557$50,000 to $59,999
  • 1,170$60,000 to $74,999
  • 1,048$75,000 to $99,999
  • 1,070$100,000 to $124,999
  • 1,326$125,000 to $149,999
  • 1,613$150,000 to $199,999
  • 2,737$200,000 or more
  • Home value of owner - occupied houses in 2022 in Goleta, CA

  • Distribution of house value in Goleta, CA in 2022
  • 26Less than $10,000
  • 17$30,000 to $34,999
  • 11$40,000 to $49,999
  • 65$80,000 to $89,999
  • 26$90,000 to $99,999
  • 96$100,000 to $124,999
  • 8$125,000 to $149,999
  • 87$150,000 to $174,999
  • 85$200,000 to $249,999
  • 75$250,000 to $299,999
  • 59$300,000 to $399,999
  • 212$400,000 to $499,999
  • 1,023$500,000 to $749,999
  • 1,927$750,000 to $999,999
  • 1,640$1,000,000 to $1,499,999
  • 281$1,500,000 to $1,999,999
  • 204$2,000,000 or more
  • Rent paid by renters in 2022 in Goleta, CA

  • Distribution of rent paid by renters in Goleta, CA in 2022
  • 60Less than $100
  • 13$250 to $299
  • 56$300 to $349
  • 14$600 to $649
  • 30$650 to $699
  • 6$750 to $799
  • 121$800 to $899
  • 48$900 to $999
  • 264$1,000 to $1,249
  • 909$1,250 to $1,499
  • 1,327$1,500 to $1,999
  • 847$2,000 to $2,499
  • 1,143$2,500 to $2,999
  • 722$3,000 to $3,499
  • 799$3,500 or more
  • 116No cash rent
Time Leaving Home To Go To Work in 2022

Percentage of workers working in this county: 97.4%
Number of people working at home: 3,057 (17.6% of all workers)

Travel time (in minutes) to work in 2022

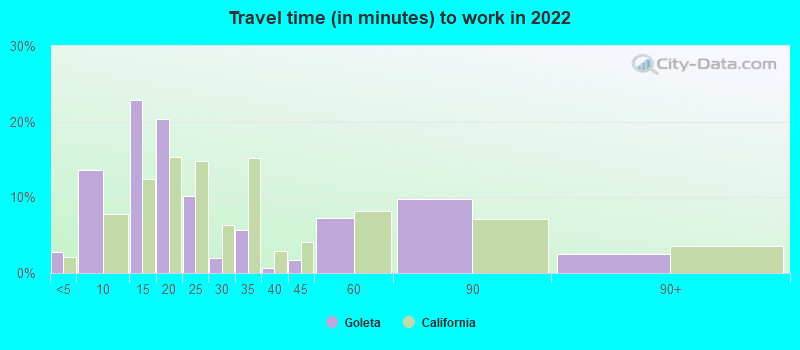
Travel time to work (commute)

  • Less than 5 minutes: 485
  • 5 to 9 minutes: 1,853
  • 10 to 14 minutes: 4,133
  • 15 to 19 minutes: 3,395
  • 20 to 24 minutes: 2,292
  • 25 to 29 minutes: 387
  • 30 to 34 minutes: 744
  • 35 to 39 minutes: 102
  • 40 to 44 minutes: 60
  • 45 to 59 minutes: 216
  • 60 to 89 minutes: 422
  • 90 or more minutes: 214
Means of transportation to work in 2022 - Goleta

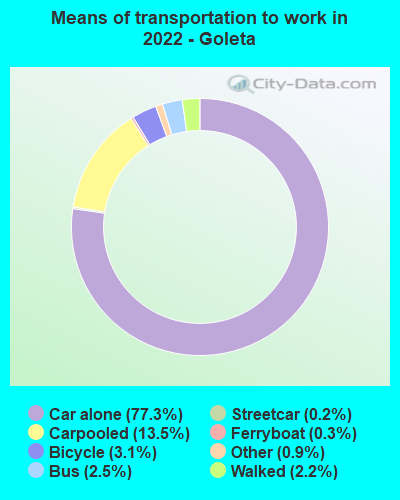
Means of transportation to work:

  • Drove a car alone: 15,116 (65.4%)
  • Carpooled: 2,438 (10.5%)
  • Bus: 543 (2.3%)
  • Subway or elevated rail: 36 (0.2%)
  • Long-distance train or commuter rail: 11 (0.0%)
  • Ferryboat: 51 (0.2%)
  • Taxi: 285 (1.2%)
  • Bicycle: 707 (3.1%)
  • Walked: 662 (2.9%)
  • Worked at home: 3,057 (13.2%)
Class of Workers in 2022
  • Unemployment by race in 2022
  • Unemployment rate for White non-Hispanic residents
  • 2.9%Males
  • 3.9%Females
  • Unemployment rate for Asian residents
  • 1.3%Males
  • 1.1%Females
  • Unemployment rate for other race residents
  • 5.5%Males
  • 2.5%Females
  • Unemployment rate for two or more race residents
  • 2.1%Males
  • 7.0%Females
  • Unemployment rate for Hispanic or Latino residents
  • 4.5%Males
  • 2.9%Females
Year of entry for the foreign-born population in Goleta, California
  • Year of entry for the foreign-born population in Goleta, California
  • 1,6852010 or later
  • 1,7592000 to 2009
  • 1,5101990 to 1999
  • 3,0981980 to 1989
  • 1,5541970 to 1979
  • 2,296Before 1970
Ancestries in Goleta, CA

First ancestries reported:

  • English: 803 (5.0%)
  • German: 619 (3.8%)
  • Irish: 539 (3.3%)
  • Eastern European: 493 (3.0%)
  • American: 409 (2.5%)
  • European: 359 (2.2%)
  • Italian: 242 (1.5%)
  • Iranian: 194 (1.2%)
  • Egyptian: 183 (1.1%)
  • Polish: 168 (1.0%)
  • British: 136 (0.8%)
  • Norwegian: 124 (0.8%)
  • Scottish: 101 (0.6%)
  • Ethiopian: 93 (0.6%)
  • Dutch: 83 (0.5%)
  • Syrian: 76 (0.5%)
  • French: 72 (0.4%)
  • Ukrainian: 71 (0.4%)
  • Russian: 71 (0.4%)
  • Serbian: 69 (0.4%)
  • Belgian: 60 (0.4%)
  • Hungarian: 58 (0.4%)
  • Danish: 48 (0.3%)
  • Swiss: 47 (0.3%)
  • Trinidadian and Tobagonian: 45 (0.3%)
  • Scandinavian: 39 (0.2%)
  • Scotch-Irish: 39 (0.2%)
  • Northern European: 37 (0.2%)
  • Armenian: 36 (0.2%)
  • Ghanaian: 31 (0.2%)
  • Swedish: 31 (0.2%)
  • Portuguese: 30 (0.2%)
  • Canadian: 29 (0.2%)
  • French Canadian: 27 (0.2%)
  • Croatian: 27 (0.2%)
  • Haitian: 27 (0.2%)
  • Greek: 24 (0.1%)
  • Brazilian: 17 (0.1%)
  • Australian: 15 (0.09%)
  • Welsh: 12 (0.07%)
  • Estonian: 11 (0.07%)
  • Finnish: 8 (0.05%)
  • African: 8 (0.05%)
  • Latvian: 6 (0.04%)
  • Lithuanian: 6 (0.04%)
  • Bulgarian: 6 (0.04%)

Most common places of birth for foreign-born residents (%):

Mexico
Goleta:

44.8% (3,409)
California:

37.2% (3,881,193)

China, excluding Hong Kong and Taiwan
Goleta:

12.5% (954)
California:

6.6% (684,672)

India
Goleta:

4.5% (346)
California:

5.2% (539,184)

Vietnam
Goleta:

3.8% (291)
California:

4.9% (512,335)

Philippines
Goleta:

3.2% (244)
California:

7.8% (818,297)

Korea
Goleta:

2.9% (222)
California:

3.0% (315,248)

Iran
Goleta:

2.0% (153)
California:

2.0% (206,004)

Germany
Goleta:

1.8% (135)
California:

0.7% (73,304)

Canada
Goleta:

1.6% (123)
California:

1.2% (127,477)

Place of birth for U.S.-born residents:

  • This state: 18,744
  • Other state: 6,095
  • Northeast: 1,789
  • Midwest: 1,824
  • South: 1,042
  • West: 1,222

85.6% of Goleta residents lived in the same house 1 years ago.
   Out of people who lived in different houses, 37.5% lived in this county.
   Out of people who lived in different counties, 62.0% lived in California.


Goleta:

85.6%
State average:

88.9%

Education attainment for males 25 years and older:

  • No schooling: 402
  • Nursery to 4th grade: 161
  • 5th and 6th grade: 84
  • 7th and 8th grade: 78
  • 9th grade: 152
  • 10th grade: 52
  • 11th grade: 145
  • 12th grade, no diploma: 102
  • High school graduate (or equivalency): 1,190
  • Less than 1 year of college: 359
  • Some college more than 1 year, no degree: 1,297
  • Associate degree: 933
  • Bachelor's degree: 3,458
  • Master's degree: 1,098
  • Professional school degree: 406
  • Doctorate degree: 851
Educational Attainment for Males

Education attainment for females 25 years and older:

  • No schooling: 589
  • Nursery to 4th grade: 274
  • 5th and 6th grade: 105
  • 7th and 8th grade: 77
  • 9th grade: 139
  • 10th grade: 92
  • 11th grade: 39
  • 12th grade, no diploma: 204
  • High school graduate (or equivalency): 1,329
  • Less than 1 year of college: 530
  • Some college more than 1 year, no degree: 1,131
  • Associate degree: 936
  • Bachelor's degree: 3,043
  • Master's degree: 1,414
  • Professional school degree: 187
  • Doctorate degree: 511
Educational Attainment for Females
Goleta marital status for males
Goleta marital status for females

Housing units in structures:

  • One, detached: 5,781
  • One, attached: 1,315
  • Two: 126
  • 3 or 4: 702
  • 5 to 9: 1,137
  • 10 to 19: 1,290
  • 20 to 49: 588
  • 50 or more: 1,051
  • Mobile homes: 755

Median worth of mobile homes: $370,543

Housing units lacking complete plumbing facilities in 2022: 0.2%

Housing units lacking complete kitchen facilities in 2022: 2.7%

House/condo owner moved in on average 17 years ago

Renter moved in on average 2 years ago

Year householders moved into residence in Goleta
Houses and condos Apartments
Most commonly used house heating fuel in houses and condos in Goleta, CA
  • 80.6%Utility gas
  • 16.1%Electricity
  • 1.6%Wood
  • 1.0%Bottled, tank, or LP gas
  • 0.6%Solar energy
  • 0.2%No fuel used
Most commonly used house heating fuel in apartments in Goleta, CA
  • 48.2%Utility gas
  • 41.6%Electricity
  • 5.3%No fuel used
  • 4.2%Bottled, tank, or LP gas
  • 0.5%Solar energy
  • 0.2%Fuel oil, kerosene, etc.

Private vs. public school enrollment:

Students in private schools in grades 1 to 8 (elementary and middle school): 375
Here:

13.1%
California:

10.5%

Students in private schools in grades 9 to 12 (high school): 44
Here:

2.7%
California:

8.5%

Students in private undergraduate colleges: 509
Here:

15.1%
California:

15.9%
School Enrollment by Level of School for Male Students
School Enrollment by Level of School for Female Students
Age and Sex of Sensory-Disabled Noninstitutionalized Residents
Age and Sex of Physically-Disabled Noninstitutionalized Residents
Age and Sex of Mentally-Disabled Noninstitutionalized Residents
Age and Sex of Self-Care Disabled Noninstitutionalized Residents
Age and Sex of Go-Outside-Home Disabled Noninstitutionalized Residents
Age and Sex of Noninstitutionalized Residents with Employment Disability