Glen Ellyn, IL (Illinois) Houses and Residents
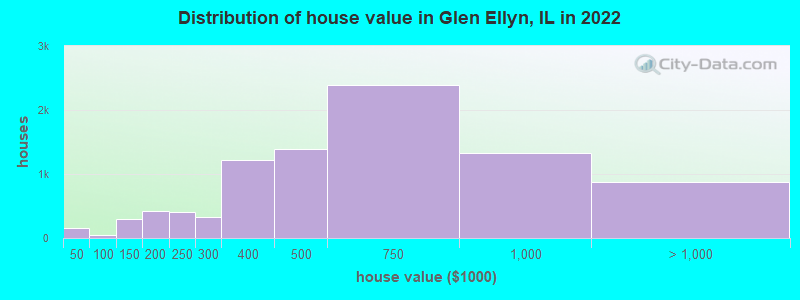
Estimated median house or condo value in 2022: $521,170 (it was $253,900 in 2000 )
Glen Ellyn:
$521,170Illinois:
$251,600
Lower value quartile - upper value quartile: $353,142 - $749,650Mean price in 2022: Detached houses: $693,448 Here:
$693,448State:
$310,164
Townhouses or other attached units: $326,100 Here:
$326,100State:
$286,230
In 3-to-4-unit structures: $194,481 Here:
$194,481State:
$330,907
In 5-or-more-unit structures: $205,697 Here:
$205,697State:
$318,887
Total population: 27,763 (Urban population: 27,040, Rural population: 0)
Houses: 11,580 (11,036 occupied: 8,601 owner occupied, 2,446 renter occupied )
% of renters here:
22%State:
33%
Housing density: 1,750 houses/condos per square mile
Median price asked for vacant for-sale houses and condos in 2022: $367,584.
Median contract rent in 2022: $1,167 (lower quartile is $991, upper quartile is $1,628)
Median rent asked for vacant for-rent units in 2022: $3,592
Median gross rent in Glen Ellyn, IL in 2022: $1,174
Housing units in Glen Ellyn with a mortgage: 5,596 (835 second mortgage, 32 home equity loan, 775 both second mortgage and home equity loan )Houses without a mortgage: 152
Median household income for houses/condos with a mortgage: $193,119
Median household income for apartments without a mortgage: $94,456
Median monthly housing costs: $1,941
Data:
Median house or condo value ($)
Median house or condo value ($ change since 2000)
Median house or condo value ($) - White
Median house or condo value ($) - Black or African American
Median house or condo value ($) - Asian
Median house or condo value ($) - Hispanic or Latino
Median house or condo value ($) - American Indian and Alaska Native
Median house or condo value ($) - Multirace
Median house or condo value ($) - Other Race
Median price asked for mobile homes ($)
Household density (households per square mile)
Mean house or condo value by units in structure - 1, detached ($)
Mean house or condo value by units in structure - 1, attached ($)
Mean house or condo value by units in structure - 2 ($)
Mean house or condo value by units in structure by units in structure - 3 or 4 ($)
Mean house or condo value by units in structure - 5 or more ($)
Mean house or condo value by units in structure - Boat, RV, van, etc. ($)
Mean house or condo value by units in structure - Mobile home ($)
Median contract rent ($)
Median contract rent - Lower quartile ($)
Median contract rent - Upper quartile ($)
Median gross rent ($)
Urban houses (%)
Rural houses (%)
Houses occupied (%)
Houses occupied (% change since 2000)
Houses owner occupied (%)
Houses owner occupied (% change since 2000)
Houses renter occupied (%)
Houses renter occupied (% change since 2000)
Vacant housing units - For rent (%)
Vacant housing units - For rent (% change since 2000)
Vacant housing units - For sale only (%)
Vacant housing units - For sale only (% change since 2000)
Vacant housing units - Rented or sold, not occupied (%)
Vacant housing units - Rented or sold, not occupied (% change since 2000)
Vacant housing units - For seasonal, recreational, or occasional use (%)
Vacant housing units - For seasonal, recreational, or occasional use (% change since 2000)
Vacant housing units - For migrant workers (%)
Vacant housing units - For migrant workers (% change since 2000)
Vacant housing units - Other vacant (%)
Vacant housing units - Other vacant (% change since 2000)
Median monthly housing costs ($)
Median household income for houses/condos with a mortgage ($)
Median household income for houses/condos without a mortgage ($)
Median household income ($)
Median household income ($) - White
Median household income ($) - Black or African American
Median household income ($) - Asian
Median household income ($) - Hispanic or Latino
Median household income ($) - American Indian and Alaska Native
Median household income ($) - Multirace
Median household income ($) - Other Race
Mortgage status - with mortgage (%)
Mortgage status - with second mortgage (%)
Mortgage status - with home equity loan (%)
Mortgage status - with both second mortgage and home equity loan (%)
Mortgage status - without a mortgage (%)
Median year house/condo built
Median year apartment built
Household type by relationship - Male householder living alone (%)
Household type by relationship - Male householder not living alone (%)
Household type by relationship - Female householder living alone (%)
Household type by relationship - Female householder not living alone (%)
Household type by relationship - Opposite-Sex spouse (%)
Household type by relationship - Same-Sex spouse (%)
Household type by relationship - Opposite-Sex unmarried partner (%)
Household type by relationship - Same-Sex unmarried partner (%)
Household type by relationship - In group quarters (%)
Size of family households - 2-person household (%)
Size of family households - 3-person household (%)
Size of family households - 4-person household (%)
Size of family households - 5-person household (%)
Size of family households - 6-person household (%)
Size of family households - 7-or-more-person household (%)
Size of nonfamily households - 1-person household (%)
Size of nonfamily households - 2-person household (%)
Size of nonfamily households - 3-person household (%)
Size of nonfamily households - 4-person household (%)
Size of nonfamily households - 5-person household (%)
Size of nonfamily households - 6-person household (%)
Size of nonfamily households - 7-or-moreperson household (%)
Year house built - Built 2010 or later (%)
Year house built - Built 2000 to 2009 (%)
Year house built - Built 1990 to 1999 (%)
Year house built - Built 1980 to 1989 (%)
Year house built - Built 1970 to 1979 (%)
Year house built - Built 1960 to 1969 (%)
Year house built - Built 1950 to 1959 (%)
Year house built - Built 1940 to 1949 (%)
Year house built - Built 1939 or earlier (%)
Median number of rooms in houses and condos
Median number of rooms in apartments
Median number of bedrooms in owner occupied houses
Mean number of bedrooms in owner occupied houses
Median number of bedrooms in renter occupied houses
Mean number of bedrooms in renter occupied houses
Median number of vehichles in owner occupied houses
Mean number of vehichles in owner occupied houses
Median number of vehichles in renter occupied houses
Mean number of vehichles in renter occupied houses
Rooms in owner-occupied houses - 1 room (%)
Rooms in owner-occupied houses - 2 rooms (%)
Rooms in owner-occupied houses - 3 rooms (%)
Rooms in owner-occupied houses - 4 rooms (%)
Rooms in owner-occupied houses - 5 rooms (%)
Rooms in owner-occupied houses - 6 rooms (%)
Rooms in owner-occupied houses - 7 rooms (%)
Rooms in owner-occupied houses - 8 rooms (%)
Rooms in owner-occupied houses - 9+ rooms (%)
Rooms in renter-occupied houses - 1 room (%)
Rooms in renter-occupied houses - 2 rooms (%)
Rooms in renter-occupied houses - 3 rooms (%)
Rooms in renter-occupied houses - 4 rooms (%)
Rooms in renter-occupied houses - 5 rooms (%)
Rooms in renter-occupied houses - 6 rooms (%)
Rooms in renter-occupied houses - 7 rooms (%)
Rooms in renter-occupied houses - 8 rooms (%)
Rooms in renter-occupied houses - 9+ rooms (%)
Bedrooms in owner-occupied houses - no bedrooms (%)
Bedrooms in owner-occupied houses - 1 bedroom (%)
Bedrooms in owner-occupied houses - 2 bedrooms (%)
Bedrooms in owner-occupied houses - 3 bedrooms (%)
Bedrooms in owner-occupied houses - 4 bedrooms (%)
Bedrooms in owner-occupied houses - 5+ bedrooms (%)
Bedrooms in renter-occupied houses - no bedrooms (%)
Bedrooms in renter-occupied houses - 1 bedroom (%)
Bedrooms in renter-occupied houses - 2 bedrooms (%)
Bedrooms in renter-occupied houses - 3 bedrooms (%)
Bedrooms in renter-occupied houses - 4 bedrooms (%)
Bedrooms in renter-occupied houses - 5+ bedrooms (%)
Vehicles available in owner-occupied houses - no vehicle available (%)
Vehicles available in owner-occupied houses - 1 vehicle available(%)
Vehicles available in owner-occupied houses - 2 Vehicles available (%)
Vehicles available in owner-occupied houses - 3 Vehicles available (%)
Vehicles available in owner-occupied houses - 4 Vehicles available (%)
Vehicles available in owner-occupied houses - 5+ Vehicles available (%)
Vehicles available in renter-occupied houses - no vehicle available (%)
Vehicles available in renter-occupied houses - 1 vehicle available (%)
Vehicles available in renter-occupied houses - 2 Vehicles available (%)
Vehicles available in renter-occupied houses - 3 Vehicles available (%)
Vehicles available in renter-occupied houses - 4 Vehicles available (%)
Vehicles available in renter-occupied houses - 5+ Vehicles available (%)
Housing units in structures - 1, detached (%)
Housing units in structures - 1, attached (%)
Housing units in structures - 2 (%)
Housing units in structures - 3 or 4 (%)
Housing units in structures - 5 to 9 (%)
Housing units in structures - 10 to 19 (%)
Housing units in structures - 20 to 49 (%)
Housing units in structures - 50 or more (%)
Housing units in structures - Mobile home (%)
Housing units in structures - Boat, RV, van, etc. (%)
Housing units in structures - Owners - 1, detached (%)
Housing units in structures - Owners - 1, attached (%)
Housing units in structures - Owners - 2 (%)
Housing units in structures - Owners - 3 or 4 (%)
Housing units in structures - Owners - 5 to 9 (%)
Housing units in structures - Owners - 10 to 19 (%)
Housing units in structures - Owners - 20 to 49 (%)
Housing units in structures - Owners - 50 or more (%)
Housing units in structures - Owners - Mobile home (%)
Housing units in structures - Owners - Boat, RV, van, etc. (%)
Housing units in structures - Renters - 1, detached (%)
Housing units in structures - Renters - 1, attached (%)
Housing units in structures - Renters - 2 (%)
Housing units in structures - Renters - 3 or 4 (%)
Housing units in structures - Renters - 5 to 9 (%)
Housing units in structures - Renters - 10 to 19 (%)
Housing units in structures - Renters - 20 to 49 (%)
Housing units in structures - Renters - 50 or more (%)
Housing units in structures - Renters - Mobile home (%)
Housing units in structures - Renters - Boat, RV, van, etc. (%)
House/condo owner moved in on average (years ago)
Renter moved in on average (years ago)
Year householder moved into unit - Moved in 1999 to March 2000 (%)
Year householder moved into unit - Moved in 1999 to March 2000 (%) - White
Year householder moved into unit - Moved in 1999 to March 2000 (%) - Black or African American
Year householder moved into unit - Moved in 1999 to March 2000 (%) - Asian
Year householder moved into unit - Moved in 1999 to March 2000 (%) - Hispanic or Latino
Year householder moved into unit - Moved in 1999 to March 2000 (%) - American Indian and Alaska Native
Year householder moved into unit - Moved in 1999 to March 2000 (%) - Multirace
Year householder moved into unit - Moved in 1999 to March 2000 (%) - Other Race
Year householder moved into unit - Moved in 1995 to 1998 (%)
Year householder moved into unit - Moved in 1995 to 1998 (%) - White
Year householder moved into unit - Moved in 1995 to 1998 (%) - Black or African American
Year householder moved into unit - Moved in 1995 to 1998 (%) - Asian
Year householder moved into unit - Moved in 1995 to 1998 (%) - Hispanic or Latino
Year householder moved into unit - Moved in 1995 to 1998 (%) - American Indian and Alaska Native
Year householder moved into unit - Moved in 1995 to 1998 (%) - Multirace
Year householder moved into unit - Moved in 1995 to 1998 (%) - Other Race
Year householder moved into unit - Moved in 1990 to 1994 (%)
Year householder moved into unit - Moved in 1990 to 1994 (%) - White
Year householder moved into unit - Moved in 1990 to 1994 (%) - Black or African American
Year householder moved into unit - Moved in 1990 to 1994 (%) - Asian
Year householder moved into unit - Moved in 1990 to 1994 (%) - Hispanic or Latino
Year householder moved into unit - Moved in 1990 to 1994 (%) - American Indian and Alaska Native
Year householder moved into unit - Moved in 1990 to 1994 (%) - Multirace
Year householder moved into unit - Moved in 1990 to 1994 (%) - Other Race
Year householder moved into unit - Moved in 1980 to 1989 (%)
Year householder moved into unit - Moved in 1980 to 1989 (%) - White
Year householder moved into unit - Moved in 1980 to 1989 (%) - Black or African American
Year householder moved into unit - Moved in 1980 to 1989 (%) - Asian
Year householder moved into unit - Moved in 1980 to 1989 (%) - Hispanic or Latino
Year householder moved into unit - Moved in 1980 to 1989 (%) - American Indian and Alaska Native
Year householder moved into unit - Moved in 1980 to 1989 (%) - Multirace
Year householder moved into unit - Moved in 1980 to 1989 (%) - Other Race
Year householder moved into unit - Moved in 1970 to 1979 (%)
Year householder moved into unit - Moved in 1970 to 1979 (%) - White
Year householder moved into unit - Moved in 1970 to 1979 (%) - Black or African American
Year householder moved into unit - Moved in 1970 to 1979 (%) - Asian
Year householder moved into unit - Moved in 1970 to 1979 (%) - Hispanic or Latino
Year householder moved into unit - Moved in 1970 to 1979 (%) - American Indian and Alaska Native
Year householder moved into unit - Moved in 1970 to 1979 (%) - Multirace
Year householder moved into unit - Moved in 1970 to 1979 (%) - Other Race
Year householder moved into unit - Moved in 1969 or earlier (%)
Year householder moved into unit - Moved in 1969 or earlier (%) - White
Year householder moved into unit - Moved in 1969 or earlier (%) - Black or African American
Year householder moved into unit - Moved in 1969 or earlier (%) - Asian
Year householder moved into unit - Moved in 1969 or earlier (%) - Hispanic or Latino
Year householder moved into unit - Moved in 1969 or earlier (%) - American Indian and Alaska Native
Year householder moved into unit - Moved in 1969 or earlier (%) - Multirace
Year householder moved into unit - Moved in 1969 or earlier (%) - Other Race
Housing units lacking complete plumbing facilities (%)
Housing units lacking complete kitchen facilities (%)
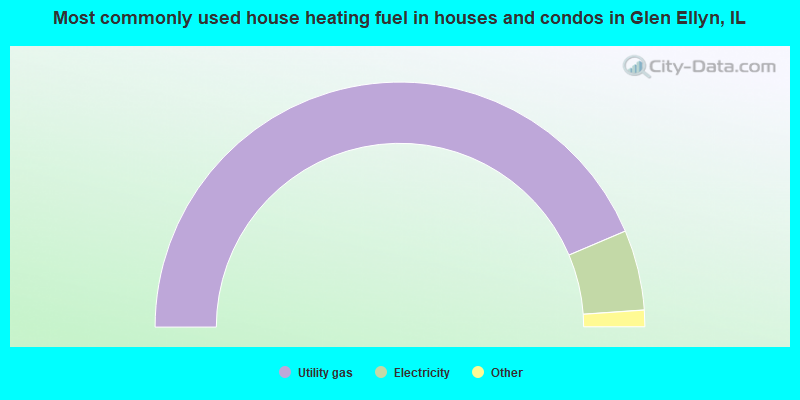
House heating fuel used in houses and condos - Utility gas (%)
House heating fuel used in houses and condos - Bottled, tank, or LP gas (%)
House heating fuel used in houses and condos - Electricity (%)
House heating fuel used in houses and condos - Fuel oil, kerosene, etc. (%)
House heating fuel used in houses and condos - Coal or coke (%)
House heating fuel used in houses and condos - Wood (%)
House heating fuel used in houses and condos - Solar energy (%)
House heating fuel used in houses and condos - Other fuel (%)
House heating fuel used in houses and condos - No fuel used (%)
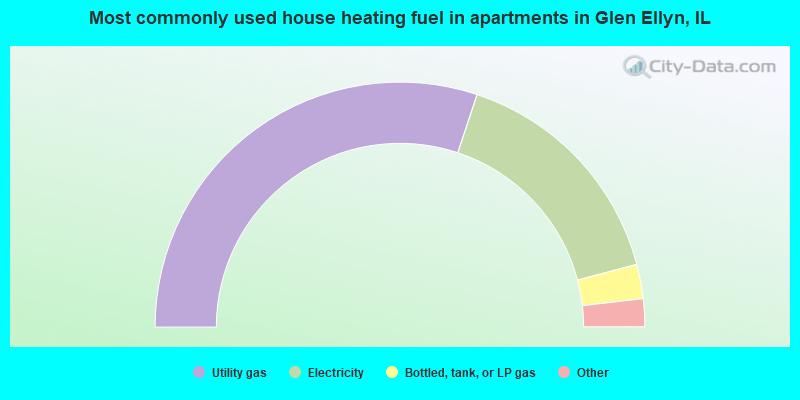
House heating fuel used in apartments - Utility gas (%)
House heating fuel used in apartments - Bottled, tank, or LP gas (%)
House heating fuel used in apartments - Electricity (%)
House heating fuel used in apartments - Fuel oil, kerosene, etc. (%)
House heating fuel used in apartments - Coal or coke (%)
House heating fuel used in apartments - Wood (%)
House heating fuel used in apartments - Solar energy (%)
House heating fuel used in apartments - Other fuel (%)
House heating fuel used in apartments - No fuel used (%)
Median year house/condo built: 1969Median year apartment built: 1974Household type by relationship:
Households: 28,010
Male householders: 5,808 (1,379 living alone ), Female householders: 5,058 (1,524 living alone )6,399 spouses (6,369 opposite-sex spouses ), 208 unmarried partners , (187 opposite-sex unmarried partners ), 9,022 children (8,645 natural , 132 adopted , 244 stepchildren ), 159 grandchildren , 276 brothers or sisters , 360 parents , 0 foster children , 212 other relatives , 440 non-relatives In group quarters: 63
Size of family households: 3,453 2-persons , 1,500 3-persons , 1,666 4-persons , 755 5-persons , 169 6-persons , 129 7-or-more-persons .
Size of nonfamily households: 3,009 1-person , 253 2-persons , 69 3-persons , 13 5-persons .
6,203 married couples with children. single-parent households (101 men , 498 women ).
85.1% of residents of Glen Ellyn speak English at home. of residents speak Spanish at home (63% speak English very well , 24% speak English well , 8% speak English not well , 6% don't speak English at all ).of residents speak other Indo-European language at home (54% speak English very well , 34% speak English well , 10% speak English not well , 2% don't speak English at all ).of residents speak Asian or Pacific Island language at home (78% speak English very well , 11% speak English well , 12% speak English not well ).of residents speak other language at home (72% speak English very well , 28% speak English well ).
Foreign born population: 3,145 (11.2%)of them are naturalized citizens )
Median number of rooms in houses and condos:
Median number of rooms in apartments
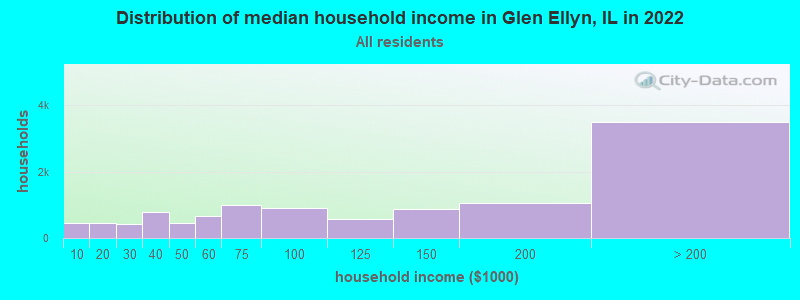
Glen Ellyn, IL household income distribution 441 Less than $10,000454 $10,000 to $19,999427 $20,000 to $29,999770 $30,000 to $39,999454 $40,000 to $49,999650 $50,000 to $59,9991,005 $60,000 to $74,999891 $75,000 to $99,999569 $100,000 to $124,999873 $125,000 to $149,9991,060 $150,000 to $199,9993,490 $200,000 or more
Home value of owner - occupied houses in 2022 in Glen Ellyn, IL 80 Less than $10,00028 $10,000 to $14,99913 $15,000 to $19,99928 $30,000 to $34,99913 $50,000 to $59,99920 $70,000 to $79,9999 $90,000 to $99,999140 $100,000 to $124,999158 $125,000 to $149,999195 $150,000 to $174,999231 $175,000 to $199,999409 $200,000 to $249,999331 $250,000 to $299,9991,219 $300,000 to $399,9991,383 $400,000 to $499,9992,383 $500,000 to $749,9991,335 $750,000 to $999,999678 $1,000,000 to $1,499,999101 $1,500,000 to $1,999,99999 $2,000,000 or moreRent paid by renters in 2022 in Glen Ellyn, IL 63 Less than $10010 $150 to $1999 $200 to $24928 $300 to $34956 $450 to $49948 $500 to $54940 $600 to $64938 $700 to $74924 $750 to $79948 $800 to $899152 $900 to $999727 $1,000 to $1,249236 $1,250 to $1,499296 $1,500 to $1,99975 $2,000 to $2,49978 $2,500 to $2,99928 $3,000 to $3,499127 $3,500 or more200 No cash rent
Percentage of workers working in this county: 72.6%Number of people working at home: 4,169 (31.9% of all workers )
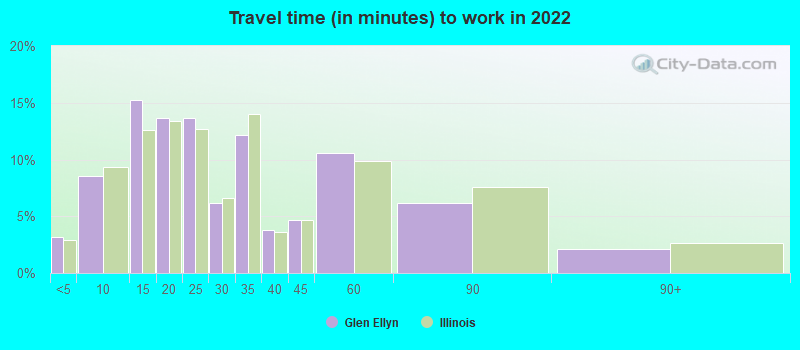
Travel time to work (commute)
Less than 5 minutes: 3075 to 9 minutes: 97410 to 14 minutes: 94615 to 19 minutes: 94220 to 24 minutes: 95625 to 29 minutes: 67530 to 34 minutes: 1,36635 to 39 minutes: 40140 to 44 minutes: 37445 to 59 minutes: 85560 to 89 minutes: 94790 or more minutes: 279
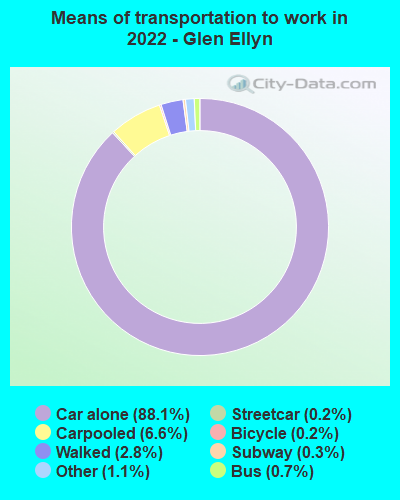
Means of transportation to work:
Drove a car alone: 8,754 (62.6%)Carpooled: 808 (5.8%)Bus : 111 (0.8%)Subway or elevated rail : 18 (0.1%)Long-distance train or commuter rail : 27 (0.2%)Taxi: 130 (0.9%)Bicycle: 19 (0.1%)Walked: 259 (1.9%)Worked at home: 4,169 (29.8%)
Unemployment by race in 2022
Unemployment rate for White non-Hispanic residents 5.0% Males2.3% FemalesUnemployment rate for Asian residents 3.5% Males7.3% FemalesUnemployment rate for two or more race residents 9.3% Males5.0% FemalesUnemployment rate for Hispanic or Latino residents 5.8% Males4.9% Females
Year of entry for the foreign-born population in Glen Ellyn, Illinois
964 2010 or later 635 2000 to 2009 495 1990 to 1999 546 1980 to 1989 262 1970 to 1979 491 Before 1970
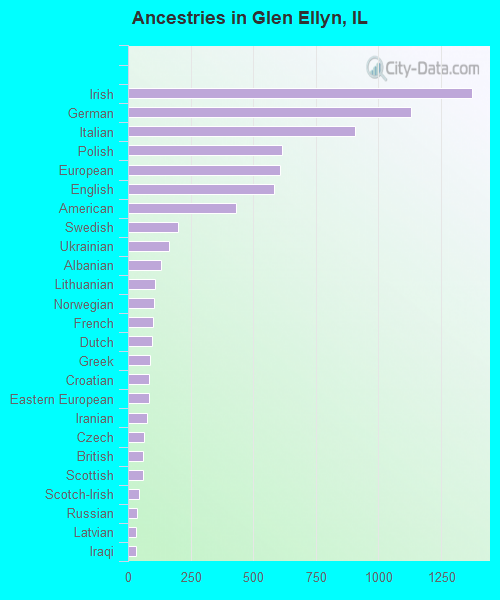
First ancestries reported:
Irish: 1,373 (12.6%)
German: 1,130 (10.4%)
Italian: 907 (8.3%)
Polish: 616 (5.6%)
European: 608 (5.6%)
English: 583 (5.3%)
American: 433 (4.0%)
Swedish: 200 (1.8%)
Ukrainian: 163 (1.5%)
Albanian: 130 (1.2%)
Lithuanian: 107 (1.0%)
Norwegian: 104 (1.0%)
French: 98 (0.9%)
Dutch: 97 (0.9%)
Greek: 87 (0.8%)
Croatian: 85 (0.8%)
Eastern European: 83 (0.8%)
Iranian: 77 (0.7%)
Czech: 64 (0.6%)
British: 58 (0.5%)
Scottish: 58 (0.5%)
Scotch-Irish: 45 (0.4%)
Russian: 35 (0.3%)
Latvian: 33 (0.3%)
Iraqi: 33 (0.3%)
Palestinian: 31 (0.3%)
Danish: 28 (0.3%)
Slovak: 26 (0.2%)
Yugoslavian: 24 (0.2%)
Slovene: 22 (0.2%)
Brazilian: 19 (0.2%)
Scandinavian: 16 (0.1%)
Canadian: 14 (0.1%)
Lebanese: 14 (0.1%)
Nigerian: 12 (0.1%)
Swiss: 12 (0.1%)
Czechoslovakian: 10 (0.09%)
Bulgarian: 10 (0.09%)
Estonian: 9 (0.08%)
Northern European: 8 (0.07%)
French Canadian: 8 (0.07%)
Hungarian: 7 (0.06%) Most common places of birth for foreign-born residents (%): India Glen Ellyn:
19.0% (602)Illinois:
9.2% (166,409)
Pakistan Glen Ellyn:
12.9% (408)Illinois:
1.6% (29,519)
Mexico Glen Ellyn:
7.2% (227)Illinois:
34.7% (626,958)
Burma (Myanmar) Glen Ellyn:
6.0% (189)Illinois:
0.3% (4,552)
Ukraine Glen Ellyn:
4.2% (132)Illinois:
1.6% (29,316)
Albania Glen Ellyn:
3.8% (119)Illinois:
0.4% (6,488)
Canada Glen Ellyn:
3.6% (114)Illinois:
1.1% (19,306)
China, excluding Hong Kong and Taiwan Glen Ellyn:
3.2% (101)Illinois:
4.1% (74,364)
Iran Glen Ellyn:
2.9% (91)Illinois:
0.4% (6,922)
Panama Glen Ellyn:
2.8% (87)Illinois:
0.1% (1,902)
Poland Glen Ellyn:
2.6% (81)Illinois:
6.9% (124,474)
Saudi Arabia Glen Ellyn:
2.1% (66)Illinois:
0.2% (3,363)
Asia, n.e.c. Glen Ellyn:
2.0% (62)Illinois:
0.4% (7,117)
Brazil Glen Ellyn:
1.9% (60)Illinois:
0.5% (8,778)
Italy Glen Ellyn:
1.8% (57)Illinois:
0.9% (15,679)
Iraq Glen Ellyn:
1.7% (55)Illinois:
0.7% (13,214)
Place of birth for U.S.-born residents:
This state: 16,615Other state: 8,038Northeast: 1,911Midwest: 3,852South: 1,348West: 948 87.4% of Glen Ellyn residents lived in the same house 1 years ago.
Out of people who lived in different houses, 32.2% lived in this county.
Out of people who lived in different counties, 68.8% lived in Illinois.
Glen Ellyn:
87.4%State average:
88.3%
Education attainment for males 25 years and older:
No schooling: 76Nursery to 4th grade: 05th and 6th grade: 107th and 8th grade: 519th grade: 1010th grade: 1411th grade: 4012th grade, no diploma: 147High school graduate (or equivalency): 845Less than 1 year of college: 328Some college more than 1 year, no degree: 780Associate degree: 265Bachelor's degree: 3,582Master's degree: 2,137Professional school degree: 720Doctorate degree: 292
Education attainment for females 25 years and older:
No schooling: 49Nursery to 4th grade: 715th and 6th grade: 07th and 8th grade: 399th grade: 3210th grade: 3211th grade: 5812th grade, no diploma: 69High school graduate (or equivalency): 1,072Less than 1 year of college: 270Some college more than 1 year, no degree: 908Associate degree: 591Bachelor's degree: 3,790Master's degree: 2,105Professional school degree: 535Doctorate degree: 228
Housing units in structures:
One, detached: 7,218One, attached: 1,005Two: 113 or 4: 2875 to 9: 58610 to 19: 48920 to 49: 78350 or more: 1,187Mobile homes: 11Housing units lacking complete plumbing facilities in 2022: 0.3%Housing units lacking complete kitchen facilities in 2022: 2.5%House/condo owner moved in on average 12 years ago
Renter moved in on average 1 years ago
Private vs. public school enrollment:
Students in private schools in grades 1 to 8 (elementary and middle school): 642 Students in private schools in grades 9 to 12 (high school): 137 Students in private undergraduate colleges: 171