Glen Burnie, MD (Maryland) Houses and Residents
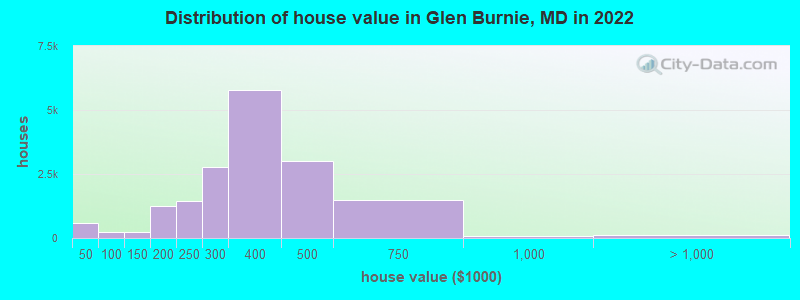
Estimated median house or condo value in 2022: $351,600 (it was $117,700 in 2000 )
Glen Burnie:
$351,600Maryland:
$398,100
Lower value quartile - upper value quartile: $257,200 - $438,100Total population: 67,639 (Urban population: 38,856, Rural population: 0)
Houses: 29,695 (28,639 occupied: 17,554 owner occupied, 11,085 renter occupied )
% of renters here:
39%State:
32%
Housing density: 2,428 houses/condos per square mile
Median price asked for vacant for-sale houses and condos in 2022: $257,442.
Median contract rent in 2022: $1,273 (lower quartile is $1,075, upper quartile is $1,570)
Median rent asked for vacant for-rent units in 2022: $2,023
Median gross rent in Glen Burnie, MD in 2022: $1,407
Housing units in Glen Burnie with a mortgage: 12,990 (698 second mortgage, 0 home equity loan, 520 both second mortgage and home equity loan )Houses without a mortgage: 633
Median household income for houses/condos with a mortgage: $98,681
Median household income for apartments without a mortgage: $81,446
Median monthly housing costs: $1,462
Data:
Median house or condo value ($)
Median house or condo value ($ change since 2000)
Median house or condo value ($) - White
Median house or condo value ($) - Black or African American
Median house or condo value ($) - Asian
Median house or condo value ($) - Hispanic or Latino
Median house or condo value ($) - American Indian and Alaska Native
Median house or condo value ($) - Multirace
Median house or condo value ($) - Other Race
Median price asked for mobile homes ($)
Household density (households per square mile)
Mean house or condo value by units in structure - 1, detached ($)
Mean house or condo value by units in structure - 1, attached ($)
Mean house or condo value by units in structure - 2 ($)
Mean house or condo value by units in structure by units in structure - 3 or 4 ($)
Mean house or condo value by units in structure - 5 or more ($)
Mean house or condo value by units in structure - Boat, RV, van, etc. ($)
Mean house or condo value by units in structure - Mobile home ($)
Median contract rent ($)
Median contract rent - Lower quartile ($)
Median contract rent - Upper quartile ($)
Median gross rent ($)
Urban houses (%)
Rural houses (%)
Houses occupied (%)
Houses occupied (% change since 2000)
Houses owner occupied (%)
Houses owner occupied (% change since 2000)
Houses renter occupied (%)
Houses renter occupied (% change since 2000)
Vacant housing units - For rent (%)
Vacant housing units - For rent (% change since 2000)
Vacant housing units - For sale only (%)
Vacant housing units - For sale only (% change since 2000)
Vacant housing units - Rented or sold, not occupied (%)
Vacant housing units - Rented or sold, not occupied (% change since 2000)
Vacant housing units - For seasonal, recreational, or occasional use (%)
Vacant housing units - For seasonal, recreational, or occasional use (% change since 2000)
Vacant housing units - For migrant workers (%)
Vacant housing units - For migrant workers (% change since 2000)
Vacant housing units - Other vacant (%)
Vacant housing units - Other vacant (% change since 2000)
Median monthly housing costs ($)
Median household income for houses/condos with a mortgage ($)
Median household income for houses/condos without a mortgage ($)
Median household income ($)
Median household income ($) - White
Median household income ($) - Black or African American
Median household income ($) - Asian
Median household income ($) - Hispanic or Latino
Median household income ($) - American Indian and Alaska Native
Median household income ($) - Multirace
Median household income ($) - Other Race
Mortgage status - with mortgage (%)
Mortgage status - with second mortgage (%)
Mortgage status - with home equity loan (%)
Mortgage status - with both second mortgage and home equity loan (%)
Mortgage status - without a mortgage (%)
Median year house/condo built
Median year apartment built
Household type by relationship - Male householder living alone (%)
Household type by relationship - Male householder not living alone (%)
Household type by relationship - Female householder living alone (%)
Household type by relationship - Female householder not living alone (%)
Household type by relationship - Opposite-Sex spouse (%)
Household type by relationship - Same-Sex spouse (%)
Household type by relationship - Opposite-Sex unmarried partner (%)
Household type by relationship - Same-Sex unmarried partner (%)
Household type by relationship - In group quarters (%)
Size of family households - 2-person household (%)
Size of family households - 3-person household (%)
Size of family households - 4-person household (%)
Size of family households - 5-person household (%)
Size of family households - 6-person household (%)
Size of family households - 7-or-more-person household (%)
Size of nonfamily households - 1-person household (%)
Size of nonfamily households - 2-person household (%)
Size of nonfamily households - 3-person household (%)
Size of nonfamily households - 4-person household (%)
Size of nonfamily households - 5-person household (%)
Size of nonfamily households - 6-person household (%)
Size of nonfamily households - 7-or-moreperson household (%)
Year house built - Built 2010 or later (%)
Year house built - Built 2000 to 2009 (%)
Year house built - Built 1990 to 1999 (%)
Year house built - Built 1980 to 1989 (%)
Year house built - Built 1970 to 1979 (%)
Year house built - Built 1960 to 1969 (%)
Year house built - Built 1950 to 1959 (%)
Year house built - Built 1940 to 1949 (%)
Year house built - Built 1939 or earlier (%)
Median number of rooms in houses and condos
Median number of rooms in apartments
Median number of bedrooms in owner occupied houses
Mean number of bedrooms in owner occupied houses
Median number of bedrooms in renter occupied houses
Mean number of bedrooms in renter occupied houses
Median number of vehichles in owner occupied houses
Mean number of vehichles in owner occupied houses
Median number of vehichles in renter occupied houses
Mean number of vehichles in renter occupied houses
Rooms in owner-occupied houses - 1 room (%)
Rooms in owner-occupied houses - 2 rooms (%)
Rooms in owner-occupied houses - 3 rooms (%)
Rooms in owner-occupied houses - 4 rooms (%)
Rooms in owner-occupied houses - 5 rooms (%)
Rooms in owner-occupied houses - 6 rooms (%)
Rooms in owner-occupied houses - 7 rooms (%)
Rooms in owner-occupied houses - 8 rooms (%)
Rooms in owner-occupied houses - 9+ rooms (%)
Rooms in renter-occupied houses - 1 room (%)
Rooms in renter-occupied houses - 2 rooms (%)
Rooms in renter-occupied houses - 3 rooms (%)
Rooms in renter-occupied houses - 4 rooms (%)
Rooms in renter-occupied houses - 5 rooms (%)
Rooms in renter-occupied houses - 6 rooms (%)
Rooms in renter-occupied houses - 7 rooms (%)
Rooms in renter-occupied houses - 8 rooms (%)
Rooms in renter-occupied houses - 9+ rooms (%)
Bedrooms in owner-occupied houses - no bedrooms (%)
Bedrooms in owner-occupied houses - 1 bedroom (%)
Bedrooms in owner-occupied houses - 2 bedrooms (%)
Bedrooms in owner-occupied houses - 3 bedrooms (%)
Bedrooms in owner-occupied houses - 4 bedrooms (%)
Bedrooms in owner-occupied houses - 5+ bedrooms (%)
Bedrooms in renter-occupied houses - no bedrooms (%)
Bedrooms in renter-occupied houses - 1 bedroom (%)
Bedrooms in renter-occupied houses - 2 bedrooms (%)
Bedrooms in renter-occupied houses - 3 bedrooms (%)
Bedrooms in renter-occupied houses - 4 bedrooms (%)
Bedrooms in renter-occupied houses - 5+ bedrooms (%)
Vehicles available in owner-occupied houses - no vehicle available (%)
Vehicles available in owner-occupied houses - 1 vehicle available(%)
Vehicles available in owner-occupied houses - 2 Vehicles available (%)
Vehicles available in owner-occupied houses - 3 Vehicles available (%)
Vehicles available in owner-occupied houses - 4 Vehicles available (%)
Vehicles available in owner-occupied houses - 5+ Vehicles available (%)
Vehicles available in renter-occupied houses - no vehicle available (%)
Vehicles available in renter-occupied houses - 1 vehicle available (%)
Vehicles available in renter-occupied houses - 2 Vehicles available (%)
Vehicles available in renter-occupied houses - 3 Vehicles available (%)
Vehicles available in renter-occupied houses - 4 Vehicles available (%)
Vehicles available in renter-occupied houses - 5+ Vehicles available (%)
Housing units in structures - 1, detached (%)
Housing units in structures - 1, attached (%)
Housing units in structures - 2 (%)
Housing units in structures - 3 or 4 (%)
Housing units in structures - 5 to 9 (%)
Housing units in structures - 10 to 19 (%)
Housing units in structures - 20 to 49 (%)
Housing units in structures - 50 or more (%)
Housing units in structures - Mobile home (%)
Housing units in structures - Boat, RV, van, etc. (%)
Housing units in structures - Owners - 1, detached (%)
Housing units in structures - Owners - 1, attached (%)
Housing units in structures - Owners - 2 (%)
Housing units in structures - Owners - 3 or 4 (%)
Housing units in structures - Owners - 5 to 9 (%)
Housing units in structures - Owners - 10 to 19 (%)
Housing units in structures - Owners - 20 to 49 (%)
Housing units in structures - Owners - 50 or more (%)
Housing units in structures - Owners - Mobile home (%)
Housing units in structures - Owners - Boat, RV, van, etc. (%)
Housing units in structures - Renters - 1, detached (%)
Housing units in structures - Renters - 1, attached (%)
Housing units in structures - Renters - 2 (%)
Housing units in structures - Renters - 3 or 4 (%)
Housing units in structures - Renters - 5 to 9 (%)
Housing units in structures - Renters - 10 to 19 (%)
Housing units in structures - Renters - 20 to 49 (%)
Housing units in structures - Renters - 50 or more (%)
Housing units in structures - Renters - Mobile home (%)
Housing units in structures - Renters - Boat, RV, van, etc. (%)
House/condo owner moved in on average (years ago)
Renter moved in on average (years ago)
Year householder moved into unit - Moved in 1999 to March 2000 (%)
Year householder moved into unit - Moved in 1999 to March 2000 (%) - White
Year householder moved into unit - Moved in 1999 to March 2000 (%) - Black or African American
Year householder moved into unit - Moved in 1999 to March 2000 (%) - Asian
Year householder moved into unit - Moved in 1999 to March 2000 (%) - Hispanic or Latino
Year householder moved into unit - Moved in 1999 to March 2000 (%) - American Indian and Alaska Native
Year householder moved into unit - Moved in 1999 to March 2000 (%) - Multirace
Year householder moved into unit - Moved in 1999 to March 2000 (%) - Other Race
Year householder moved into unit - Moved in 1995 to 1998 (%)
Year householder moved into unit - Moved in 1995 to 1998 (%) - White
Year householder moved into unit - Moved in 1995 to 1998 (%) - Black or African American
Year householder moved into unit - Moved in 1995 to 1998 (%) - Asian
Year householder moved into unit - Moved in 1995 to 1998 (%) - Hispanic or Latino
Year householder moved into unit - Moved in 1995 to 1998 (%) - American Indian and Alaska Native
Year householder moved into unit - Moved in 1995 to 1998 (%) - Multirace
Year householder moved into unit - Moved in 1995 to 1998 (%) - Other Race
Year householder moved into unit - Moved in 1990 to 1994 (%)
Year householder moved into unit - Moved in 1990 to 1994 (%) - White
Year householder moved into unit - Moved in 1990 to 1994 (%) - Black or African American
Year householder moved into unit - Moved in 1990 to 1994 (%) - Asian
Year householder moved into unit - Moved in 1990 to 1994 (%) - Hispanic or Latino
Year householder moved into unit - Moved in 1990 to 1994 (%) - American Indian and Alaska Native
Year householder moved into unit - Moved in 1990 to 1994 (%) - Multirace
Year householder moved into unit - Moved in 1990 to 1994 (%) - Other Race
Year householder moved into unit - Moved in 1980 to 1989 (%)
Year householder moved into unit - Moved in 1980 to 1989 (%) - White
Year householder moved into unit - Moved in 1980 to 1989 (%) - Black or African American
Year householder moved into unit - Moved in 1980 to 1989 (%) - Asian
Year householder moved into unit - Moved in 1980 to 1989 (%) - Hispanic or Latino
Year householder moved into unit - Moved in 1980 to 1989 (%) - American Indian and Alaska Native
Year householder moved into unit - Moved in 1980 to 1989 (%) - Multirace
Year householder moved into unit - Moved in 1980 to 1989 (%) - Other Race
Year householder moved into unit - Moved in 1970 to 1979 (%)
Year householder moved into unit - Moved in 1970 to 1979 (%) - White
Year householder moved into unit - Moved in 1970 to 1979 (%) - Black or African American
Year householder moved into unit - Moved in 1970 to 1979 (%) - Asian
Year householder moved into unit - Moved in 1970 to 1979 (%) - Hispanic or Latino
Year householder moved into unit - Moved in 1970 to 1979 (%) - American Indian and Alaska Native
Year householder moved into unit - Moved in 1970 to 1979 (%) - Multirace
Year householder moved into unit - Moved in 1970 to 1979 (%) - Other Race
Year householder moved into unit - Moved in 1969 or earlier (%)
Year householder moved into unit - Moved in 1969 or earlier (%) - White
Year householder moved into unit - Moved in 1969 or earlier (%) - Black or African American
Year householder moved into unit - Moved in 1969 or earlier (%) - Asian
Year householder moved into unit - Moved in 1969 or earlier (%) - Hispanic or Latino
Year householder moved into unit - Moved in 1969 or earlier (%) - American Indian and Alaska Native
Year householder moved into unit - Moved in 1969 or earlier (%) - Multirace
Year householder moved into unit - Moved in 1969 or earlier (%) - Other Race
Housing units lacking complete plumbing facilities (%)
Housing units lacking complete kitchen facilities (%)
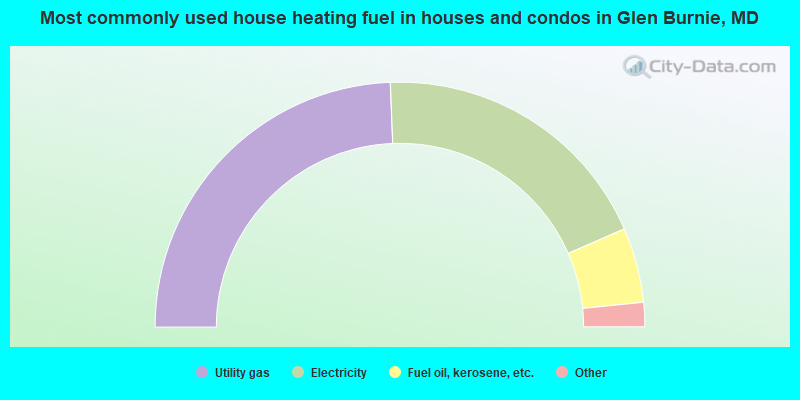
House heating fuel used in houses and condos - Utility gas (%)
House heating fuel used in houses and condos - Bottled, tank, or LP gas (%)
House heating fuel used in houses and condos - Electricity (%)
House heating fuel used in houses and condos - Fuel oil, kerosene, etc. (%)
House heating fuel used in houses and condos - Coal or coke (%)
House heating fuel used in houses and condos - Wood (%)
House heating fuel used in houses and condos - Solar energy (%)
House heating fuel used in houses and condos - Other fuel (%)
House heating fuel used in houses and condos - No fuel used (%)
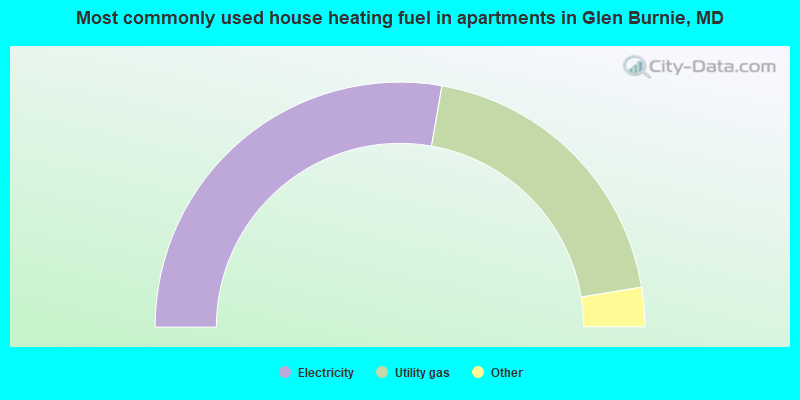
House heating fuel used in apartments - Utility gas (%)
House heating fuel used in apartments - Bottled, tank, or LP gas (%)
House heating fuel used in apartments - Electricity (%)
House heating fuel used in apartments - Fuel oil, kerosene, etc. (%)
House heating fuel used in apartments - Coal or coke (%)
House heating fuel used in apartments - Wood (%)
House heating fuel used in apartments - Solar energy (%)
House heating fuel used in apartments - Other fuel (%)
House heating fuel used in apartments - No fuel used (%)
Median year house/condo built: 1974Median year apartment built: 1980Household type by relationship:
Households: 71,182
Male householders: 13,281 (4,059 living alone ), Female householders: 15,358 (4,638 living alone )9,922 spouses (9,545 opposite-sex spouses ), 3,203 unmarried partners , (2,991 opposite-sex unmarried partners ), 18,486 children (17,500 natural , 229 adopted , 757 stepchildren ), 2,767 grandchildren , 1,121 brothers or sisters , 1,192 parents , 0 foster children , 1,843 other relatives , 3,416 non-relatives In group quarters: 593
Size of family households: 6,498 2-persons , 4,016 3-persons , 4,045 4-persons , 1,734 5-persons , 219 6-persons , 120 7-or-more-persons .
Size of nonfamily households: 8,697 1-person , 3,117 2-persons , 28 4-persons , 54 6-persons , 111 7-or-more-persons .
6,992 married couples with children. single-parent households (996 men , 4,142 women ).
85.5% of residents of Glen Burnie speak English at home. of residents speak Spanish at home (50% speak English very well , 23% speak English well , 22% speak English not well , 5% don't speak English at all ).of residents speak other Indo-European language at home (66% speak English very well , 24% speak English well , 11% speak English not well ).of residents speak Asian or Pacific Island language at home (72% speak English very well , 21% speak English well , 7% speak English not well ).of residents speak other language at home (91% speak English very well , 7% speak English well , 2% speak English not well ).
Foreign born population: 7,587 (10.7%)of them are naturalized citizens )
Median number of rooms in houses and condos:
Median number of rooms in apartments
Owner-occupied Renter-occupied
Rooms in owner-occupied houses in Glen Burnie, Maryland
0 1 room 0 2 rooms 548 3 rooms 1,465 4 rooms 2,901 5 rooms 2,778 6 rooms 3,686 7 rooms 2,676 8 rooms 3,500 9+ rooms
Rooms in renter-occupied apartments in Glen Burnie, Maryland
279 1 room 1,785 2 rooms 4,042 3 rooms 2,889 4 rooms 753 5 rooms 683 6 rooms 504 7 rooms 0 8 rooms 150 9+ rooms
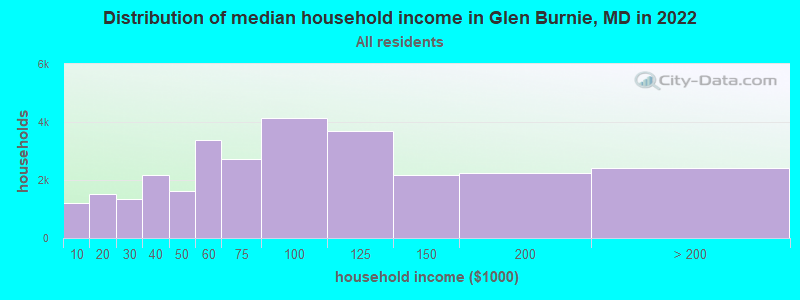
Glen Burnie, MD household income distribution 1,190 Less than $10,0001,525 $10,000 to $19,9991,328 $20,000 to $29,9992,172 $30,000 to $39,9991,615 $40,000 to $49,9993,390 $50,000 to $59,9992,728 $60,000 to $74,9994,150 $75,000 to $99,9993,687 $100,000 to $124,9992,175 $125,000 to $149,9992,250 $150,000 to $199,9992,429 $200,000 or more
Home value of owner - occupied houses in 2022 in Glen Burnie, MD 159 Less than $10,00039 $10,000 to $14,99919 $15,000 to $19,99911 $20,000 to $24,999109 $25,000 to $29,999103 $30,000 to $34,9995 $35,000 to $39,999138 $40,000 to $49,99910 $50,000 to $59,99962 $70,000 to $79,99911 $80,000 to $89,999149 $100,000 to $124,99967 $125,000 to $149,999604 $150,000 to $174,999657 $175,000 to $199,9991,456 $200,000 to $249,9992,790 $250,000 to $299,9995,796 $300,000 to $399,9992,995 $400,000 to $499,9991,491 $500,000 to $749,99959 $750,000 to $999,9994 $1,000,000 to $1,499,9997 $1,500,000 to $1,999,999111 $2,000,000 or moreRent paid by renters in 2022 in Glen Burnie, MD 32 Less than $10026 $100 to $14960 $150 to $199317 $200 to $24975 $250 to $299165 $300 to $34916 $350 to $39995 $400 to $4498 $450 to $49936 $500 to $54916 $550 to $59932 $600 to $64930 $650 to $69985 $700 to $74978 $750 to $799283 $800 to $899356 $900 to $9992,880 $1,000 to $1,2492,598 $1,250 to $1,4992,638 $1,500 to $1,999356 $2,000 to $2,49978 $2,500 to $2,999219 No cash rent
Percentage of workers working in this county: 64.2%Number of people working at home: 3,832 (9.7% of all workers )
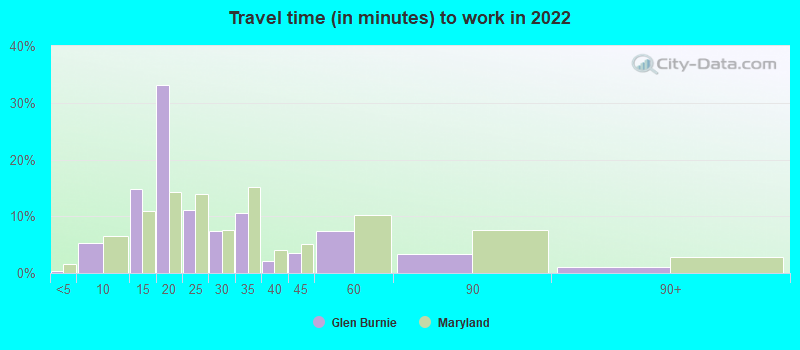
Travel time to work (commute)
Less than 5 minutes: 1775 to 9 minutes: 2,14810 to 14 minutes: 4,06715 to 19 minutes: 5,05720 to 24 minutes: 4,77325 to 29 minutes: 3,44730 to 34 minutes: 5,77735 to 39 minutes: 70540 to 44 minutes: 2,73745 to 59 minutes: 2,47360 to 89 minutes: 3,06590 or more minutes: 919
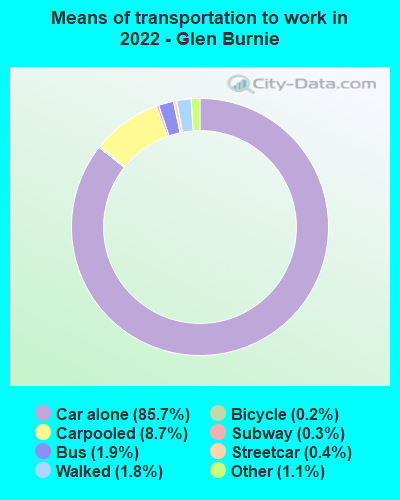
Means of transportation to work:
Drove a car alone: 21,247 (73.2%)Carpooled: 2,162 (7.4%)Bus : 262 (0.9%)Subway or elevated rail : 73 (0.3%)Long-distance train or commuter rail : 39 (0.1%)Taxi: 338 (1.2%)Bicycle: 49 (0.2%)Walked: 459 (1.6%)Worked at home: 3,832 (13.2%)
Unemployment by race in 2022
Unemployment rate for White non-Hispanic residents 1.6% Males3.6% FemalesUnemployment rate for Black residents 7.3% Males3.7% FemalesUnemployment rate for American Indian and Alaska Native residents 4.8% Males37.2% FemalesUnemployment rate for Asian residents 4.1% Males1.1% FemalesUnemployment rate for other race residents 0.9% MalesUnemployment rate for two or more race residents 3.8% Males1.5% FemalesUnemployment rate for Hispanic or Latino residents 1.2% Males0.7% Females
Year of entry for the foreign-born population in Glen Burnie, Maryland
4,629 2010 or later 1,696 2000 to 2009 902 1990 to 1999 396 1980 to 1989 213 1970 to 1979 335 Before 1970
First ancestries reported:
English: 2,417 (7.1%)
German: 2,298 (6.8%)
Irish: 2,258 (6.7%)
American: 1,937 (5.7%)
Italian: 1,492 (4.4%)
Polish: 734 (2.2%)
Nigerian: 632 (1.9%)
Jamaican: 451 (1.3%)
African: 395 (1.2%)
European: 276 (0.8%)
Turkish: 263 (0.8%)
Eastern European: 182 (0.5%)
Egyptian: 173 (0.5%)
Greek: 116 (0.3%)
British: 116 (0.3%)
Welsh: 106 (0.3%)
Scotch-Irish: 105 (0.3%)
Scottish: 91 (0.3%)
West Indian: 89 (0.3%)
Ukrainian: 88 (0.3%)
French: 88 (0.3%)
Norwegian: 82 (0.2%)
Haitian: 78 (0.2%)
Danish: 72 (0.2%)
Portuguese: 65 (0.2%)
Russian: 53 (0.2%)
Swedish: 50 (0.1%)
Hungarian: 46 (0.1%)
Lithuanian: 42 (0.1%)
Armenian: 41 (0.1%)
Ethiopian: 33 (0.10%)
Sierra Leonean: 29 (0.09%)
Northern European: 29 (0.09%)
Pennsylvania German: 25 (0.07%)
Belgian: 24 (0.07%)
Iranian: 22 (0.07%)
Lebanese: 21 (0.06%)
Czech: 21 (0.06%)
Trinidadian and Tobagonian: 21 (0.06%)
Ghanaian: 19 (0.06%)
Celtic: 17 (0.05%)
Austrian: 14 (0.04%)
Slavic: 14 (0.04%)
Moroccan: 13 (0.04%)
Barbadian: 13 (0.04%)
Liberian: 12 (0.04%)
French Canadian: 12 (0.04%)
Dutch: 11 (0.03%)
Zimbabwean: 10 (0.03%)
Israeli: 6 (0.02%)
Brazilian: 4 (0.01%)
Czechoslovakian: 4 (0.01%)
Most common places of birth for foreign-born residents (%): Philippines Glen Burnie:
14.3% (1,213)Maryland:
3.8% (36,698)
Nigeria Glen Burnie:
11.8% (1,007)Maryland:
4.6% (44,825)
Guatemala Glen Burnie:
9.2% (785)Maryland:
4.4% (42,350)
El Salvador Glen Burnie:
9.1% (777)Maryland:
12.0% (115,412)
Bangladesh Glen Burnie:
5.4% (460)Maryland:
0.7% (7,124)
Mexico Glen Burnie:
4.2% (359)Maryland:
3.5% (34,065)
Pakistan Glen Burnie:
3.1% (264)Maryland:
1.8% (17,037)
Turkey Glen Burnie:
3.1% (264)Maryland:
0.4% (3,850)
Brazil Glen Burnie:
2.6% (220)Maryland:
1.2% (11,980)
China, excluding Hong Kong and Taiwan Glen Burnie:
2.3% (192)Maryland:
4.6% (44,742)
Korea Glen Burnie:
2.0% (174)Maryland:
3.4% (32,635)
Honduras Glen Burnie:
1.9% (165)Maryland:
2.5% (24,026)
Egypt Glen Burnie:
1.9% (164)Maryland:
0.5% (4,414)
Sierra Leone Glen Burnie:
1.8% (154)Maryland:
1.1% (10,233)
Jamaica Glen Burnie:
1.8% (149)Maryland:
2.8% (27,444)
England Glen Burnie:
1.6% (138)Maryland:
0.6% (5,828)
Dominican Republic Glen Burnie:
1.6% (138)Maryland:
1.4% (13,947)
Place of birth for U.S.-born residents:
This state: 43,596Other state: 18,589Northeast: 4,233Midwest: 2,653South: 7,898West: 3,805 85.3% of Glen Burnie residents lived in the same house 1 years ago.
Out of people who lived in different houses, 42.0% lived in this county.
Out of people who lived in different counties, 65.6% lived in Maryland.
Glen Burnie:
85.3%State average:
88.5%
Education attainment for males 25 years and older:
No schooling: 453Nursery to 4th grade: 05th and 6th grade: 2177th and 8th grade: 539th grade: 59110th grade: 34311th grade: 79912th grade, no diploma: 770High school graduate (or equivalency): 7,785Less than 1 year of college: 1,204Some college more than 1 year, no degree: 3,487Associate degree: 1,368Bachelor's degree: 4,102Master's degree: 1,793Professional school degree: 70Doctorate degree: 251
Education attainment for females 25 years and older:
No schooling: 437Nursery to 4th grade: 395th and 6th grade: 07th and 8th grade: 1909th grade: 010th grade: 87311th grade: 1,10312th grade, no diploma: 520High school graduate (or equivalency): 6,646Less than 1 year of college: 2,035Some college more than 1 year, no degree: 3,729Associate degree: 2,208Bachelor's degree: 6,329Master's degree: 2,104Professional school degree: 729Doctorate degree: 262
Housing units in structures:
One, detached: 14,911One, attached: 4,789Two: 1833 or 4: 3625 to 9: 1,39110 to 19: 7,05820 to 49: 23850 or more: 653Mobile homes: 110Housing units lacking complete plumbing facilities in 2022: 0.5%Housing units lacking complete kitchen facilities in 2022: 1.0%House/condo owner moved in on average 11 years ago
Renter moved in on average 2 years ago
Private vs. public school enrollment:
Students in private schools in grades 1 to 8 (elementary and middle school): 1,126 Students in private schools in grades 9 to 12 (high school): 216 Students in private undergraduate colleges: 308