Frederick, MD (Maryland) Houses and Residents
Estimated median house or condo value in 2022: $399,700 (it was $134,300 in 2000 )
Frederick:
$399,700Maryland:
$398,100
Lower value quartile - upper value quartile: $300,700 - $491,000Mean price in 2022: Detached houses: $437,421 Here:
$437,421State:
$526,819
Townhouses or other attached units: $369,198 Here:
$369,198State:
$328,305
In 2-unit structures: $197,561 Here:
$197,561State:
$346,599
In 3-to-4-unit structures: $604,572 Here:
$604,572State:
$295,378
In 5-or-more-unit structures: $234,190 Here:
$234,190State:
$350,378
Total population: 68,400 (Urban population: 52,624, Rural population: 69 (19 farm, 50 nonfarm ))
Houses: 33,864 (32,308 occupied: 18,703 owner occupied, 13,605 renter occupied )
% of renters here:
42%State:
32%
Housing density: 1,659 houses/condos per square mile
Median price asked for vacant for-sale houses and condos in 2022: $352,605.
Median contract rent in 2022: $1,514 (lower quartile is $1,116, upper quartile is $1,867)
Median rent asked for vacant for-rent units in 2022: $2,084
Median gross rent in Frederick, MD in 2022: $1,642
Housing units in Frederick with a mortgage: 15,234 (1,435 second mortgage, 8 home equity loan, 1,113 both second mortgage and home equity loan )Houses without a mortgage: 273
Median household income for houses/condos with a mortgage: $134,291
Median household income for apartments without a mortgage: $77,344
Median monthly housing costs: $1,705
Data:
Median house or condo value ($)
Median house or condo value ($ change since 2000)
Median house or condo value ($) - White
Median house or condo value ($) - Black or African American
Median house or condo value ($) - Asian
Median house or condo value ($) - Hispanic or Latino
Median house or condo value ($) - American Indian and Alaska Native
Median house or condo value ($) - Multirace
Median house or condo value ($) - Other Race
Median price asked for mobile homes ($)
Household density (households per square mile)
Mean house or condo value by units in structure - 1, detached ($)
Mean house or condo value by units in structure - 1, attached ($)
Mean house or condo value by units in structure - 2 ($)
Mean house or condo value by units in structure by units in structure - 3 or 4 ($)
Mean house or condo value by units in structure - 5 or more ($)
Mean house or condo value by units in structure - Boat, RV, van, etc. ($)
Mean house or condo value by units in structure - Mobile home ($)
Median contract rent ($)
Median contract rent - Lower quartile ($)
Median contract rent - Upper quartile ($)
Median gross rent ($)
Urban houses (%)
Rural houses (%)
Houses occupied (%)
Houses occupied (% change since 2000)
Houses owner occupied (%)
Houses owner occupied (% change since 2000)
Houses renter occupied (%)
Houses renter occupied (% change since 2000)
Vacant housing units - For rent (%)
Vacant housing units - For rent (% change since 2000)
Vacant housing units - For sale only (%)
Vacant housing units - For sale only (% change since 2000)
Vacant housing units - Rented or sold, not occupied (%)
Vacant housing units - Rented or sold, not occupied (% change since 2000)
Vacant housing units - For seasonal, recreational, or occasional use (%)
Vacant housing units - For seasonal, recreational, or occasional use (% change since 2000)
Vacant housing units - For migrant workers (%)
Vacant housing units - For migrant workers (% change since 2000)
Vacant housing units - Other vacant (%)
Vacant housing units - Other vacant (% change since 2000)
Median monthly housing costs ($)
Median household income for houses/condos with a mortgage ($)
Median household income for houses/condos without a mortgage ($)
Median household income ($)
Median household income ($) - White
Median household income ($) - Black or African American
Median household income ($) - Asian
Median household income ($) - Hispanic or Latino
Median household income ($) - American Indian and Alaska Native
Median household income ($) - Multirace
Median household income ($) - Other Race
Mortgage status - with mortgage (%)
Mortgage status - with second mortgage (%)
Mortgage status - with home equity loan (%)
Mortgage status - with both second mortgage and home equity loan (%)
Mortgage status - without a mortgage (%)
Median year house/condo built
Median year apartment built
Household type by relationship - Male householder living alone (%)
Household type by relationship - Male householder not living alone (%)
Household type by relationship - Female householder living alone (%)
Household type by relationship - Female householder not living alone (%)
Household type by relationship - Opposite-Sex spouse (%)
Household type by relationship - Same-Sex spouse (%)
Household type by relationship - Opposite-Sex unmarried partner (%)
Household type by relationship - Same-Sex unmarried partner (%)
Household type by relationship - In group quarters (%)
Size of family households - 2-person household (%)
Size of family households - 3-person household (%)
Size of family households - 4-person household (%)
Size of family households - 5-person household (%)
Size of family households - 6-person household (%)
Size of family households - 7-or-more-person household (%)
Size of nonfamily households - 1-person household (%)
Size of nonfamily households - 2-person household (%)
Size of nonfamily households - 3-person household (%)
Size of nonfamily households - 4-person household (%)
Size of nonfamily households - 5-person household (%)
Size of nonfamily households - 6-person household (%)
Size of nonfamily households - 7-or-moreperson household (%)
Year house built - Built 2010 or later (%)
Year house built - Built 2000 to 2009 (%)
Year house built - Built 1990 to 1999 (%)
Year house built - Built 1980 to 1989 (%)
Year house built - Built 1970 to 1979 (%)
Year house built - Built 1960 to 1969 (%)
Year house built - Built 1950 to 1959 (%)
Year house built - Built 1940 to 1949 (%)
Year house built - Built 1939 or earlier (%)
Median number of rooms in houses and condos
Median number of rooms in apartments
Median number of bedrooms in owner occupied houses
Mean number of bedrooms in owner occupied houses
Median number of bedrooms in renter occupied houses
Mean number of bedrooms in renter occupied houses
Median number of vehichles in owner occupied houses
Mean number of vehichles in owner occupied houses
Median number of vehichles in renter occupied houses
Mean number of vehichles in renter occupied houses
Rooms in owner-occupied houses - 1 room (%)
Rooms in owner-occupied houses - 2 rooms (%)
Rooms in owner-occupied houses - 3 rooms (%)
Rooms in owner-occupied houses - 4 rooms (%)
Rooms in owner-occupied houses - 5 rooms (%)
Rooms in owner-occupied houses - 6 rooms (%)
Rooms in owner-occupied houses - 7 rooms (%)
Rooms in owner-occupied houses - 8 rooms (%)
Rooms in owner-occupied houses - 9+ rooms (%)
Rooms in renter-occupied houses - 1 room (%)
Rooms in renter-occupied houses - 2 rooms (%)
Rooms in renter-occupied houses - 3 rooms (%)
Rooms in renter-occupied houses - 4 rooms (%)
Rooms in renter-occupied houses - 5 rooms (%)
Rooms in renter-occupied houses - 6 rooms (%)
Rooms in renter-occupied houses - 7 rooms (%)
Rooms in renter-occupied houses - 8 rooms (%)
Rooms in renter-occupied houses - 9+ rooms (%)
Bedrooms in owner-occupied houses - no bedrooms (%)
Bedrooms in owner-occupied houses - 1 bedroom (%)
Bedrooms in owner-occupied houses - 2 bedrooms (%)
Bedrooms in owner-occupied houses - 3 bedrooms (%)
Bedrooms in owner-occupied houses - 4 bedrooms (%)
Bedrooms in owner-occupied houses - 5+ bedrooms (%)
Bedrooms in renter-occupied houses - no bedrooms (%)
Bedrooms in renter-occupied houses - 1 bedroom (%)
Bedrooms in renter-occupied houses - 2 bedrooms (%)
Bedrooms in renter-occupied houses - 3 bedrooms (%)
Bedrooms in renter-occupied houses - 4 bedrooms (%)
Bedrooms in renter-occupied houses - 5+ bedrooms (%)
Vehicles available in owner-occupied houses - no vehicle available (%)
Vehicles available in owner-occupied houses - 1 vehicle available(%)
Vehicles available in owner-occupied houses - 2 Vehicles available (%)
Vehicles available in owner-occupied houses - 3 Vehicles available (%)
Vehicles available in owner-occupied houses - 4 Vehicles available (%)
Vehicles available in owner-occupied houses - 5+ Vehicles available (%)
Vehicles available in renter-occupied houses - no vehicle available (%)
Vehicles available in renter-occupied houses - 1 vehicle available (%)
Vehicles available in renter-occupied houses - 2 Vehicles available (%)
Vehicles available in renter-occupied houses - 3 Vehicles available (%)
Vehicles available in renter-occupied houses - 4 Vehicles available (%)
Vehicles available in renter-occupied houses - 5+ Vehicles available (%)
Housing units in structures - 1, detached (%)
Housing units in structures - 1, attached (%)
Housing units in structures - 2 (%)
Housing units in structures - 3 or 4 (%)
Housing units in structures - 5 to 9 (%)
Housing units in structures - 10 to 19 (%)
Housing units in structures - 20 to 49 (%)
Housing units in structures - 50 or more (%)
Housing units in structures - Mobile home (%)
Housing units in structures - Boat, RV, van, etc. (%)
Housing units in structures - Owners - 1, detached (%)
Housing units in structures - Owners - 1, attached (%)
Housing units in structures - Owners - 2 (%)
Housing units in structures - Owners - 3 or 4 (%)
Housing units in structures - Owners - 5 to 9 (%)
Housing units in structures - Owners - 10 to 19 (%)
Housing units in structures - Owners - 20 to 49 (%)
Housing units in structures - Owners - 50 or more (%)
Housing units in structures - Owners - Mobile home (%)
Housing units in structures - Owners - Boat, RV, van, etc. (%)
Housing units in structures - Renters - 1, detached (%)
Housing units in structures - Renters - 1, attached (%)
Housing units in structures - Renters - 2 (%)
Housing units in structures - Renters - 3 or 4 (%)
Housing units in structures - Renters - 5 to 9 (%)
Housing units in structures - Renters - 10 to 19 (%)
Housing units in structures - Renters - 20 to 49 (%)
Housing units in structures - Renters - 50 or more (%)
Housing units in structures - Renters - Mobile home (%)
Housing units in structures - Renters - Boat, RV, van, etc. (%)
House/condo owner moved in on average (years ago)
Renter moved in on average (years ago)
Year householder moved into unit - Moved in 1999 to March 2000 (%)
Year householder moved into unit - Moved in 1999 to March 2000 (%) - White
Year householder moved into unit - Moved in 1999 to March 2000 (%) - Black or African American
Year householder moved into unit - Moved in 1999 to March 2000 (%) - Asian
Year householder moved into unit - Moved in 1999 to March 2000 (%) - Hispanic or Latino
Year householder moved into unit - Moved in 1999 to March 2000 (%) - American Indian and Alaska Native
Year householder moved into unit - Moved in 1999 to March 2000 (%) - Multirace
Year householder moved into unit - Moved in 1999 to March 2000 (%) - Other Race
Year householder moved into unit - Moved in 1995 to 1998 (%)
Year householder moved into unit - Moved in 1995 to 1998 (%) - White
Year householder moved into unit - Moved in 1995 to 1998 (%) - Black or African American
Year householder moved into unit - Moved in 1995 to 1998 (%) - Asian
Year householder moved into unit - Moved in 1995 to 1998 (%) - Hispanic or Latino
Year householder moved into unit - Moved in 1995 to 1998 (%) - American Indian and Alaska Native
Year householder moved into unit - Moved in 1995 to 1998 (%) - Multirace
Year householder moved into unit - Moved in 1995 to 1998 (%) - Other Race
Year householder moved into unit - Moved in 1990 to 1994 (%)
Year householder moved into unit - Moved in 1990 to 1994 (%) - White
Year householder moved into unit - Moved in 1990 to 1994 (%) - Black or African American
Year householder moved into unit - Moved in 1990 to 1994 (%) - Asian
Year householder moved into unit - Moved in 1990 to 1994 (%) - Hispanic or Latino
Year householder moved into unit - Moved in 1990 to 1994 (%) - American Indian and Alaska Native
Year householder moved into unit - Moved in 1990 to 1994 (%) - Multirace
Year householder moved into unit - Moved in 1990 to 1994 (%) - Other Race
Year householder moved into unit - Moved in 1980 to 1989 (%)
Year householder moved into unit - Moved in 1980 to 1989 (%) - White
Year householder moved into unit - Moved in 1980 to 1989 (%) - Black or African American
Year householder moved into unit - Moved in 1980 to 1989 (%) - Asian
Year householder moved into unit - Moved in 1980 to 1989 (%) - Hispanic or Latino
Year householder moved into unit - Moved in 1980 to 1989 (%) - American Indian and Alaska Native
Year householder moved into unit - Moved in 1980 to 1989 (%) - Multirace
Year householder moved into unit - Moved in 1980 to 1989 (%) - Other Race
Year householder moved into unit - Moved in 1970 to 1979 (%)
Year householder moved into unit - Moved in 1970 to 1979 (%) - White
Year householder moved into unit - Moved in 1970 to 1979 (%) - Black or African American
Year householder moved into unit - Moved in 1970 to 1979 (%) - Asian
Year householder moved into unit - Moved in 1970 to 1979 (%) - Hispanic or Latino
Year householder moved into unit - Moved in 1970 to 1979 (%) - American Indian and Alaska Native
Year householder moved into unit - Moved in 1970 to 1979 (%) - Multirace
Year householder moved into unit - Moved in 1970 to 1979 (%) - Other Race
Year householder moved into unit - Moved in 1969 or earlier (%)
Year householder moved into unit - Moved in 1969 or earlier (%) - White
Year householder moved into unit - Moved in 1969 or earlier (%) - Black or African American
Year householder moved into unit - Moved in 1969 or earlier (%) - Asian
Year householder moved into unit - Moved in 1969 or earlier (%) - Hispanic or Latino
Year householder moved into unit - Moved in 1969 or earlier (%) - American Indian and Alaska Native
Year householder moved into unit - Moved in 1969 or earlier (%) - Multirace
Year householder moved into unit - Moved in 1969 or earlier (%) - Other Race
Housing units lacking complete plumbing facilities (%)
Housing units lacking complete kitchen facilities (%)
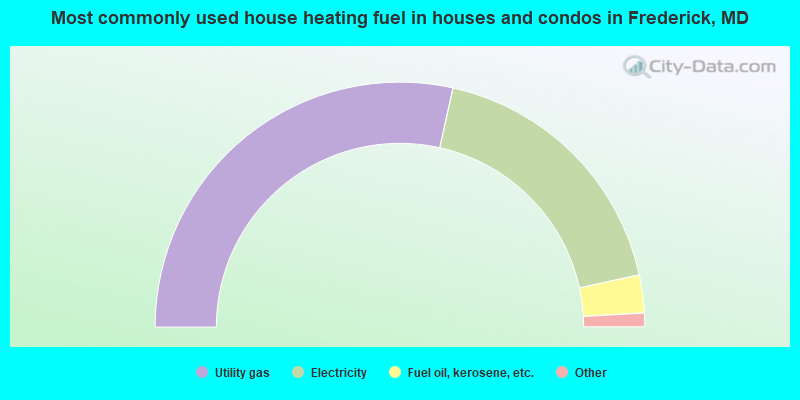
House heating fuel used in houses and condos - Utility gas (%)
House heating fuel used in houses and condos - Bottled, tank, or LP gas (%)
House heating fuel used in houses and condos - Electricity (%)
House heating fuel used in houses and condos - Fuel oil, kerosene, etc. (%)
House heating fuel used in houses and condos - Coal or coke (%)
House heating fuel used in houses and condos - Wood (%)
House heating fuel used in houses and condos - Solar energy (%)
House heating fuel used in houses and condos - Other fuel (%)
House heating fuel used in houses and condos - No fuel used (%)
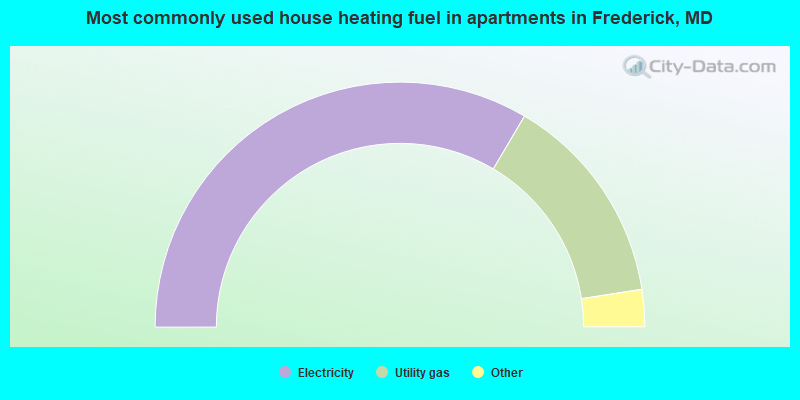
House heating fuel used in apartments - Utility gas (%)
House heating fuel used in apartments - Bottled, tank, or LP gas (%)
House heating fuel used in apartments - Electricity (%)
House heating fuel used in apartments - Fuel oil, kerosene, etc. (%)
House heating fuel used in apartments - Coal or coke (%)
House heating fuel used in apartments - Wood (%)
House heating fuel used in apartments - Solar energy (%)
House heating fuel used in apartments - Other fuel (%)
House heating fuel used in apartments - No fuel used (%)
Latest news about housing in Frederick, MD collected exclusively by city-data.com from local newspapers, TV, and radio stations
Median year house/condo built: 1992Median year apartment built: 1989Household type by relationship:
Households: 82,169
Male householders: 15,955 (3,320 living alone ), Female householders: 16,353 (5,519 living alone )15,609 spouses (15,059 opposite-sex spouses ), 2,520 unmarried partners , (2,402 opposite-sex unmarried partners ), 23,453 children (22,845 natural , 140 adopted , 468 stepchildren ), 1,481 grandchildren , 805 brothers or sisters , 902 parents , 0 foster children , 648 other relatives , 2,255 non-relatives In group quarters: 2,188
Size of family households: 8,527 2-persons , 3,550 3-persons , 4,814 4-persons , 2,885 5-persons , 673 6-persons , 310 7-or-more-persons .
Size of nonfamily households: 8,839 1-person , 2,081 2-persons , 559 3-persons , 70 4-persons .
12,285 married couples with children. single-parent households (524 men , 4,246 women ).
75.0% of residents of Frederick speak English at home. of residents speak Spanish at home (58% speak English very well , 22% speak English well , 13% speak English not well , 6% don't speak English at all ).of residents speak other Indo-European language at home (70% speak English very well , 25% speak English well , 4% speak English not well , 1% don't speak English at all ).of residents speak Asian or Pacific Island language at home (57% speak English very well , 28% speak English well , 11% speak English not well , 3% don't speak English at all ).of residents speak other language at home (89% speak English very well , 10% speak English well ).
Foreign born population: 16,537 (20.1%)of them are naturalized citizens )
Median number of rooms in houses and condos:
Median number of rooms in apartments
Owner-occupied Renter-occupied
Rooms in owner-occupied houses in Frederick, Maryland
44 1 room 63 2 rooms 582 3 rooms 1,314 4 rooms 2,018 5 rooms 4,477 6 rooms 3,264 7 rooms 2,622 8 rooms 4,319 9+ rooms
Rooms in renter-occupied apartments in Frederick, Maryland
539 1 room 614 2 rooms 2,261 3 rooms 3,809 4 rooms 3,274 5 rooms 1,500 6 rooms 320 7 rooms 1,042 8 rooms 246 9+ rooms
Frederick, MD household income distribution 1,149 Less than $10,0001,795 $10,000 to $19,9992,651 $20,000 to $29,9991,217 $30,000 to $39,9991,406 $40,000 to $49,9991,785 $50,000 to $59,9992,767 $60,000 to $74,9994,101 $75,000 to $99,9993,801 $100,000 to $124,9992,844 $125,000 to $149,9993,656 $150,000 to $199,9995,136 $200,000 or more
Home value of owner - occupied houses in 2022 in Frederick, MD 214 Less than $10,00016 $20,000 to $24,99927 $25,000 to $29,99978 $30,000 to $34,99918 $40,000 to $49,9995 $50,000 to $59,99917 $70,000 to $79,99945 $90,000 to $99,99930 $100,000 to $124,999101 $125,000 to $149,999255 $150,000 to $174,999666 $175,000 to $199,9992,062 $200,000 to $249,9992,121 $250,000 to $299,9994,373 $300,000 to $399,9993,930 $400,000 to $499,9992,711 $500,000 to $749,999665 $750,000 to $999,999200 $1,000,000 to $1,499,99915 $1,500,000 to $1,999,999118 $2,000,000 or moreRent paid by renters in 2022 in Frederick, MD 128 Less than $10063 $100 to $14944 $150 to $19960 $200 to $249118 $250 to $29945 $300 to $349157 $350 to $399177 $400 to $44946 $450 to $49962 $550 to $599199 $600 to $649133 $650 to $699167 $700 to $749108 $750 to $799267 $800 to $899301 $900 to $9992,461 $1,000 to $1,2492,071 $1,250 to $1,4994,692 $1,500 to $1,9991,811 $2,000 to $2,499178 $2,500 to $2,99915 $3,000 to $3,499309 $3,500 or more98 No cash rent
Percentage of workers working in this county: 68.6%Number of people working at home: 7,609 (17.1% of all workers )
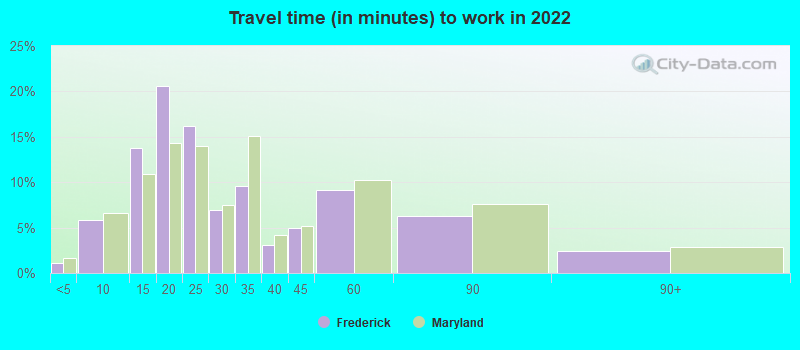
Travel time to work (commute)
Less than 5 minutes: 7065 to 9 minutes: 2,30310 to 14 minutes: 6,13515 to 19 minutes: 5,62520 to 24 minutes: 3,78625 to 29 minutes: 1,32530 to 34 minutes: 3,26335 to 39 minutes: 94740 to 44 minutes: 1,12745 to 59 minutes: 5,56760 to 89 minutes: 3,67690 or more minutes: 774
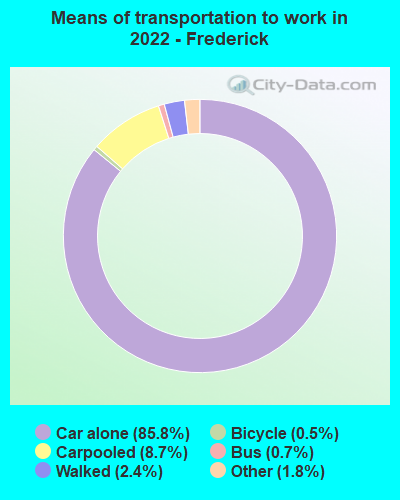
Means of transportation to work:
Drove a car alone: 40,273 (70.7%)Carpooled: 4,467 (7.8%)Bus : 163 (0.3%)Subway or elevated rail : 24 (0.0%)Long-distance train or commuter rail : 21 (0.0%)Taxi: 792 (1.4%)Bicycle: 455 (0.8%)Walked: 874 (1.5%)Worked at home: 7,609 (13.4%)
Unemployment by race in 2022
Unemployment rate for White non-Hispanic residents 1.6% Males0.3% FemalesUnemployment rate for Black residents 11.5% FemalesUnemployment rate for American Indian and Alaska Native residents 29.9% FemalesUnemployment rate for Asian residents 5.8% Males1.6% FemalesUnemployment rate for other race residents 0.5% Males2.7% FemalesUnemployment rate for two or more race residents 1.4% Males1.3% FemalesUnemployment rate for Hispanic or Latino residents 0.7% Males6.9% Females
Year of entry for the foreign-born population in Frederick, Maryland
6,597 2010 or later 5,102 2000 to 2009 3,455 1990 to 1999 927 1980 to 1989 507 1970 to 1979 446 Before 1970
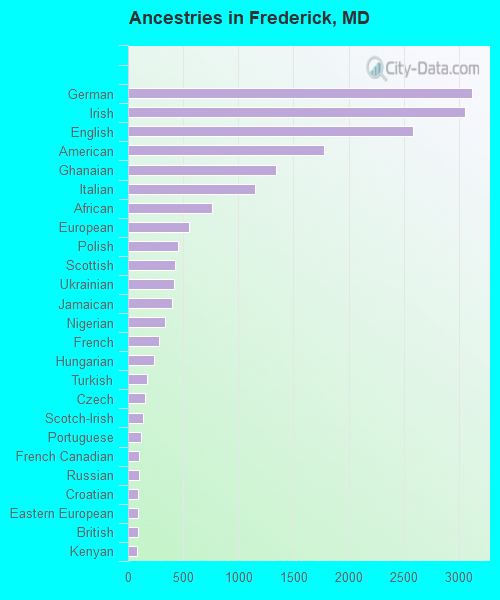
First ancestries reported:
German: 3,118 (7.8%)
Irish: 3,052 (7.6%)
English: 2,589 (6.4%)
American: 1,781 (4.4%)
Ghanaian: 1,344 (3.3%)
Italian: 1,154 (2.9%)
African: 760 (1.9%)
European: 553 (1.4%)
Polish: 457 (1.1%)
Scottish: 426 (1.1%)
Ukrainian: 421 (1.0%)
Jamaican: 402 (1.0%)
Nigerian: 333 (0.8%)
French: 285 (0.7%)
Hungarian: 235 (0.6%)
Turkish: 175 (0.4%)
Czech: 151 (0.4%)
Scotch-Irish: 139 (0.3%)
Portuguese: 121 (0.3%)
French Canadian: 97 (0.2%)
Russian: 96 (0.2%)
Croatian: 90 (0.2%)
Eastern European: 88 (0.2%)
British: 87 (0.2%)
Kenyan: 85 (0.2%)
Arab: 84 (0.2%)
Romanian: 82 (0.2%)
Albanian: 69 (0.2%)
Yugoslavian: 68 (0.2%)
Norwegian: 68 (0.2%)
Dutch: 65 (0.2%)
South African: 58 (0.1%)
Haitian: 58 (0.1%)
Swiss: 56 (0.1%)
Scandinavian: 50 (0.1%)
Greek: 50 (0.1%)
Zimbabwean: 50 (0.1%)
Estonian: 49 (0.1%)
Danish: 43 (0.1%)
Canadian: 41 (0.1%)
Northern European: 40 (0.10%)
Ugandan: 38 (0.09%)
Welsh: 38 (0.09%)
Egyptian: 36 (0.09%)
Finnish: 33 (0.08%)
Serbian: 32 (0.08%)
Swedish: 32 (0.08%)
Slavic: 31 (0.08%)
Jordanian: 30 (0.07%)
Sudanese: 30 (0.07%)
Lithuanian: 29 (0.07%)
Bulgarian: 29 (0.07%)
Liberian: 25 (0.06%)
Latvian: 22 (0.05%)
Brazilian: 21 (0.05%)
Czechoslovakian: 19 (0.05%)
Syrian: 17 (0.04%)
Australian: 15 (0.04%)
Slovene: 13 (0.03%)
Lebanese: 12 (0.03%)
Austrian: 11 (0.03%)
Carpatho Rusyn: 8 (0.02%)
Pennsylvania German: 7 (0.02%)
Afghan: 5 (0.01%)
Celtic: 4 (0.01%)
Most common places of birth for foreign-born residents (%): El Salvador Frederick:
21.4% (3,409)Maryland:
12.0% (115,412)
Guatemala Frederick:
9.3% (1,480)Maryland:
4.4% (42,350)
Ghana Frederick:
5.7% (910)Maryland:
1.8% (17,774)
India Frederick:
4.4% (704)Maryland:
6.4% (61,725)
China, excluding Hong Kong and Taiwan Frederick:
3.3% (523)Maryland:
4.6% (44,742)
Mexico Frederick:
3.1% (494)Maryland:
3.5% (34,065)
Jamaica Frederick:
2.6% (411)Maryland:
2.8% (27,444)
Peru Frederick:
2.3% (374)Maryland:
1.8% (17,161)
Philippines Frederick:
2.1% (342)Maryland:
3.8% (36,698)
Colombia Frederick:
2.0% (313)Maryland:
1.3% (12,898)
Ivory Coast Frederick:
1.5% (240)Maryland:
0.3% (2,949)
Place of birth for U.S.-born residents:
This state: 32,952Other state: 31,723Northeast: 9,812Midwest: 4,357South: 15,137West: 2,417 84.6% of Frederick residents lived in the same house 1 years ago.
Out of people who lived in different houses, 28.9% lived in this county.
Out of people who lived in different counties, 62.2% lived in Maryland.
Frederick:
84.6%State average:
88.5%
Education attainment for males 25 years and older:
No schooling: 313Nursery to 4th grade: 4685th and 6th grade: 2387th and 8th grade: 1879th grade: 49110th grade: 32511th grade: 13312th grade, no diploma: 417High school graduate (or equivalency): 6,519Less than 1 year of college: 1,682Some college more than 1 year, no degree: 3,537Associate degree: 2,038Bachelor's degree: 5,912Master's degree: 3,037Professional school degree: 435Doctorate degree: 911
Education attainment for females 25 years and older:
No schooling: 194Nursery to 4th grade: 4955th and 6th grade: 4097th and 8th grade: 2419th grade: 010th grade: 5111th grade: 34212th grade, no diploma: 279High school graduate (or equivalency): 6,556Less than 1 year of college: 2,480Some college more than 1 year, no degree: 2,927Associate degree: 2,248Bachelor's degree: 7,247Master's degree: 5,648Professional school degree: 394Doctorate degree: 826
Housing units in structures:
One, detached: 11,651One, attached: 9,447Two: 6133 or 4: 8735 to 9: 2,93510 to 19: 5,47220 to 49: 1,35550 or more: 1,448Mobile homes: 70Housing units lacking complete plumbing facilities in 2022: 1.3%Housing units lacking complete kitchen facilities in 2022: 1.7%House/condo owner moved in on average 8 years ago
Renter moved in on average 2 years ago
Private vs. public school enrollment:
Students in private schools in grades 1 to 8 (elementary and middle school): 1,156 Students in private schools in grades 9 to 12 (high school): 678 Students in private undergraduate colleges: 1,427