Franconia, VA (Virginia) Houses and Residents
| Franconia: | $529,481 |
| Virginia: | $365,700 |
Mean price in 2022:
Detached houses: $1,026,198
Here: $1,026,198 State: $472,865 Townhouses or other attached units: $542,835
Here: $542,835 State: $457,437 In 2-unit structures: $384,878
Here: $384,878 State: $396,289 In 3-to-4-unit structures: $322,575
Here: $322,575 State: $252,346 In 5-or-more-unit structures: $375,759
Here: $375,759 State: $382,551
Total population: 18,245 (All urban)
Houses: 7,726 (7,505 occupied: 5,711 owner occupied, 1,835 renter occupied)
| % of renters here: | 24% |
| State: | 33% |
Housing density: 1,081 houses/condos per square mile
Median price asked for vacant for-sale houses and condos in 2022: $264,245.
Median contract rent in 2022: over $2,000 (lower quartile is $1,739, upper quartile is over $2,000)
Median rent asked for vacant for-rent units in 2022: $2,856
Median gross rent in Franconia, VA in 2022: over $2,000
Housing units in Franconia with a mortgage: 4,357 (305 second mortgage, 5 home equity loan, 266 both second mortgage and home equity loan)
Houses without a mortgage: 115
Median household income for houses/condos with a mortgage: $170,662
Median household income for apartments without a mortgage: $112,400
Median monthly housing costs: $2,284
Compare current foreclosures near Franconia, VA:
| Photo | Address | Area | Beds / Baths | Price | Details |
|---|---|---|---|---|---|

|
#1
Sand Cherry Way
Clinton, MD 20735
|
3,328 sq. feet
|
2 baths 5 beds |
$613,600
|
show details |

|
#2
17th St NW Apt 504
Washington, DC 20009
|
800 sq. feet
|
1 baths 1 beds |
$395,000
|
show details |

|
#3
Cathedral Ave NW Apt 108
Washington, DC 20016
|
765 sq. feet
|
1 baths 1 beds |
$259,900
|
show details |

|
#4
Pickett Dr
Suitland, MD 20746
|
1,296 sq. feet
|
1 baths 2 beds |
$335,000
|
show details |

|
#5
Monroe St NW
Washington, DC 20010
|
- sq. feet
|
2 baths 2 beds |
$665,000
|
show details |

|
#6
Old Fort Rd
Fort Washington, MD 20744
|
721 sq. feet
|
1 baths 2 beds |
$179,900
|
show details |

|
#7
Henson Ln
Temple Hills, MD 20748
|
1,566 sq. feet
|
2 baths 3 beds |
$300,000
|
show details |

|
#8
Crafford Pl
Fort Washington, MD 20744
|
1,890 sq. feet
|
1 baths 3 beds |
$265,900
|
show details |

|
#9
Buchanan St NE
Washington, DC 20017
|
1,240 sq. feet
|
2 baths 3 beds |
$325,000
|
show details |

|
#10
Applegarth Pl
Capitol Heights, MD 20743
|
1,200 sq. feet
|
1 baths 3 beds |
$314,900
|
show details |
| Photo | Address | Area | Beds / Baths | Price | Details |
|---|---|---|---|---|---|

|
#11
Wilson Ln Apt 204
Mc Lean, VA 22102
|
925 sq. feet
|
1 baths 2 beds |
$359,900
|
show details |

|
#12
Wilson Bridge Dr Unit #6770 A-2
Oxon Hill, MD 20745
|
- sq. feet
|
1 baths 1 beds |
$99,750
|
show details |

|
#13
Snowflower Blvd
Oxon Hill, MD 20745
|
- sq. feet
|
2 baths 3 beds |
$331,760
|
show details |

|
#14
T St SE Apt 3
Washington, DC 20020
|
- sq. feet
|
2 baths 4 beds |
$307,500
|
show details |

|
#15
Delaware Ave SW Apt N720
Washington, DC 20024
|
- sq. feet
|
1 baths 1 beds |
$139,900
|
show details |

|
#16
Oakwood St SE Apt B5
Washington, DC 20032
|
628 sq. feet
|
1 baths 1 beds |
show details | |

|
#17
Yoakum Pkwy Apt 22304
Alexandria, VA 22304
|
1,098 sq. feet
|
2 baths 1 beds |
show details | |

|
#18
Beechcliff Dr
Alexandria, VA 22306
|
2,365 sq. feet
|
3 baths 3 beds |
show details | |

|
#19
24th St SE
Washington, DC 20020
|
1,152 sq. feet
|
1 baths 2 beds |
show details | |

|
#20
Sleepy Hollow Rd
Falls Church, VA 22042
|
2,112 sq. feet
|
3 baths 4 beds |
show details |
| Photo | Address | Area | Beds / Baths | Price | Details |
|---|---|---|---|---|---|

|
#21
17th Pl NE Apt 303
Washington, DC 20002
|
506 sq. feet
|
1 baths 1 beds |
show details | |

|
#22
Leocrie Pl
Woodbridge, VA 22191
|
3,828 sq. feet
|
4 baths 4 beds |
show details | |

|
#23
Stockholm Way
Woodbridge, VA 22191
|
2,420 sq. feet
|
2 baths 3 beds |
show details | |

|
#24
New Hampshire Ave NW
Washington, DC 20036
|
3,412 sq. feet
|
3 baths 8 beds |
show details | |

|
#25
Southern Ave SE
Washington, DC 20019
|
832 sq. feet
|
2 baths 2 beds |
show details | |

|
#26
S Glebe Rd
Arlington, VA 22202
|
824 sq. feet
|
1 baths 1 beds |
show details | |

|
#27
Wilson Boulevard, Unit 101, Falls Church, Va 22044
Falls Church, VA 22044
|
718 sq. feet
|
1 baths 2 beds |
show details | |

|
#28
Milligan Ln
Clinton, MD 20735
|
1,376 sq. feet
|
2 baths 3 beds |
show details | |

|
#29
Burke Woods Dr
Burke, VA 22015
|
- sq. feet
|
6 baths 5 beds |
show details | |

|
#30
N Capitol St NW
Washington, DC 20002
|
1,380 sq. feet
|
2 baths 3 beds |
show details |
| Photo | Address | Area | Beds / Baths | Price | Details |
|---|---|---|---|---|---|

|
#31
Irving St SE
Washington, DC 20020
|
602 sq. feet
|
1 baths 2 beds |
show details | |

|
#32
Grant Pl NE
Washington, DC 20019
|
837 sq. feet
|
1 baths 2 beds |
show details | |

|
#33
Hill Way
Suitland, MD 20746
|
1,539 sq. feet
|
2 baths 4 beds |
show details | |

|
#34
Pennington Pl
Vienna, VA 22181
|
1,948 sq. feet
|
4 baths 3 beds |
show details | |

|
#35
Georgia Ave NW
Washington, DC 20011
|
1,614 sq. feet
|
2 baths 3 beds |
show details | |

|
#36
Hunter Pl SE Apt 101
Washington, DC 20020
|
791 sq. feet
|
1 baths 2 beds |
show details | |

|
#37
Benning Rd SE Apt 202
Washington, DC 20019
|
609 sq. feet
|
1 baths 1 beds |
show details | |

|
#38
Glyndon St SE
Vienna, VA 22180
|
1,393 sq. feet
|
3 baths 5 beds |
show details | |

|
#39
13th St NE
Washington, DC 20017
|
1,316 sq. feet
|
2 baths 4 beds |
show details | |

|
#40
Lyceum Ln
Manassas, VA 20112
|
4,911 sq. feet
|
3 baths 4 beds |
show details |
| Photo | Address | Area | Beds / Baths | Price | Details |
|---|---|---|---|---|---|

|
#41
Mount View Pl SE
Washington, DC 20020
|
1,488 sq. feet
|
2 baths 4 beds |
show details | |

|
#42
Channing St NE
Washington, DC 20018
|
1,540 sq. feet
|
2 baths 3 beds |
show details | |

|
#43
Upshur St NW
Washington, DC 20011
|
1,352 sq. feet
|
3 baths 3 beds |
show details | |

|
#44
Gainesville St SE Apt 201
Washington, DC 20020
|
1,678 sq. feet
|
3 baths 3 beds |
show details | |

|
#45
Skyview Ln
Fairfax, VA 22031
|
1,400 sq. feet
|
3 baths 5 beds |
show details | |

|
#46
Tremayne Pl Apt 309
Mc Lean, VA 22102
|
1,180 sq. feet
|
2 baths 2 beds |
show details | |

|
#47
Tremayne Pl Apt 309
Mc Lean, VA 22102
|
1,180 sq. feet
|
2 baths 2 beds |
show details | |

|
#48
Deanwood Dr
Capitol Heights, MD 20743
|
640 sq. feet
|
1 baths 1 beds |
show details | |

|
#49
Delafield Pl NW
Washington, DC 20011
|
1,743 sq. feet
|
2 baths 4 beds |
show details | |

|
Check over 1 million property listings on Foreclosure.com!
|
browse all offers | |||

Latest news about housing in Franconia, VA collected exclusively by city-data.com from local newspapers, TV, and radio stations

 | Ranch/Rambler style homes for people under age 55? (20 replies) |
| Reputable Day-Cares In Franconia/Springfield Area (0 replies) |
| Parkwood Court Apartments (Alexandria) or Woods of Fairfax (Lorton) (7 replies) |
| New homes around the Fort Belvoir area? (13 replies) |
| Townhome Rental around Alexandria (9 replies) |
| HELP me figure commute to these homes PLEASE :) (7 replies) |

Median year apartment built: 1993
Household type by relationship:
Households: 17,796- Male householders: 3,713 (891 living alone), Female householders: 3,697 (1,366 living alone)
3,727 spouses (3,672 opposite-sex spouses), 503 unmarried partners, (494 opposite-sex unmarried partners), 4,439 children (4,237 natural, 39 adopted, 162 stepchildren), 304 grandchildren, 143 brothers or sisters, 422 parents, 0 foster children, 185 other relatives, 649 non-relatives
- In group quarters: 8
Size of family households: 1,853 2-persons, 1,419 3-persons, 867 4-persons, 285 5-persons, 74 6-persons, 7 7-or-more-persons.
Size of nonfamily households: 2,329 1-person, 731 2-persons, 23 3-persons.
2,376 married couples with children.
528 single-parent households (163 men, 365 women).
65.3% of residents of Franconia speak English at home.
9.8% of residents speak Spanish at home (64% speak English very well, 19% speak English well, 17% speak English not well).
6.3% of residents speak other Indo-European language at home (83% speak English very well, 11% speak English well, 4% speak English not well, 2% don't speak English at all).
12.9% of residents speak Asian or Pacific Island language at home (60% speak English very well, 22% speak English well, 18% speak English not well, 1% don't speak English at all).
5.9% of residents speak other language at home (84% speak English very well, 16% speak English well).
Foreign born population: 4,886 (27.5%)
(81.9% of them are naturalized citizens)
| Here: | 6.3 |
| State: | 7.0 |
| Here: | 4.6 |
| State: | 4.3 |

- Bedrooms in owner-occupied houses and condos in Franconia, Virginia
- 14no bedroom
- 841 bedroom
- 1,6162 bedrooms
- 2,4153 bedrooms
- 1,1944 bedrooms
- 3885+ bedrooms

- Bedrooms in renter-occupied apartments in Franconia, Virginia
- 93no bedroom
- 4341 bedroom
- 5212 bedrooms
- 6533 bedrooms
- 1344 bedrooms
- 05+ bedrooms

- Cars and other vehicles available in Franconia in owner-occupied houses/condos
- 107no vehicle
- 1,7981 vehicle
- 2,3632 vehicles
- 1,0453 vehicles
- 2784 vehicles
- 1205+ vehicles

- Cars and other vehicles available in Franconia in renter-occupied apartments
- 47no vehicle
- 8371 vehicle
- 8092 vehicles
- 1143 vehicles
- 284 vehicles
- 05+ vehicles

- Rooms in owner-occupied houses in Franconia, Virginia
- 01 room
- 162 rooms
- 3063 rooms
- 8234 rooms
- 9875 rooms
- 8846 rooms
- 6317 rooms
- 7568 rooms
- 1,3109+ rooms

- Rooms in renter-occupied apartments in Franconia, Virginia
- 451 room
- 1962 rooms
- 1673 rooms
- 4924 rooms
- 2295 rooms
- 4046 rooms
- 1707 rooms
- 958 rooms
- 379+ rooms


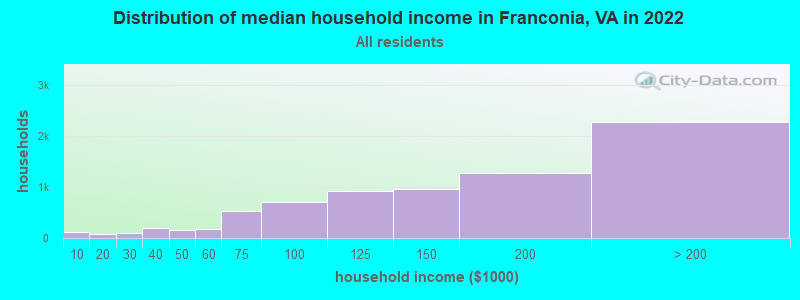
Franconia, VA household income distribution

- 126Less than $10,000
- 84$10,000 to $19,999
- 100$20,000 to $29,999
- 200$30,000 to $39,999
- 160$40,000 to $49,999
- 173$50,000 to $59,999
- 537$60,000 to $74,999
- 703$75,000 to $99,999
- 927$100,000 to $124,999
- 952$125,000 to $149,999
- 1,279$150,000 to $199,999
- 2,268$200,000 or more
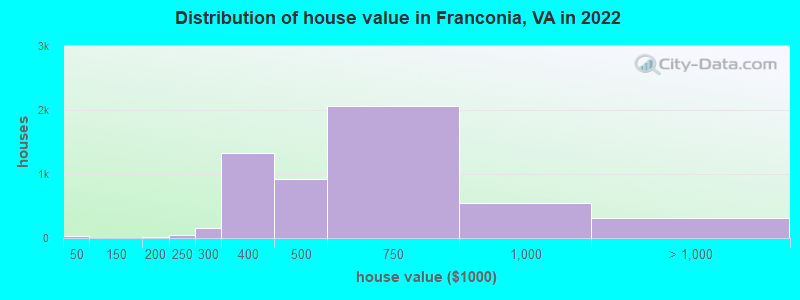
Home value of owner - occupied houses in 2022 in Franconia, VA
-
- 14Less than $10,000
- 21$30,000 to $34,999
- 14$175,000 to $199,999
- 40$200,000 to $249,999
- 153$250,000 to $299,999
- 1,322$300,000 to $399,999
- 921$400,000 to $499,999
- 2,068$500,000 to $749,999
- 540$750,000 to $999,999
- 230$1,000,000 to $1,499,999
- 15$1,500,000 to $1,999,999
- 65$2,000,000 or more
Rent paid by renters in 2022 in Franconia, VA
-
- 2$650 to $699
- 16$800 to $899
- 156$1,000 to $1,249
- 60$1,250 to $1,499
- 526$1,500 to $1,999
- 548$2,000 to $2,499
- 386$2,500 to $2,999
- 103$3,000 to $3,499
- 30$3,500 or more
- 46No cash rent


Percentage of workers working in this county: 64.7%
Number of people working at home: 4,539 (39.4% of all workers)
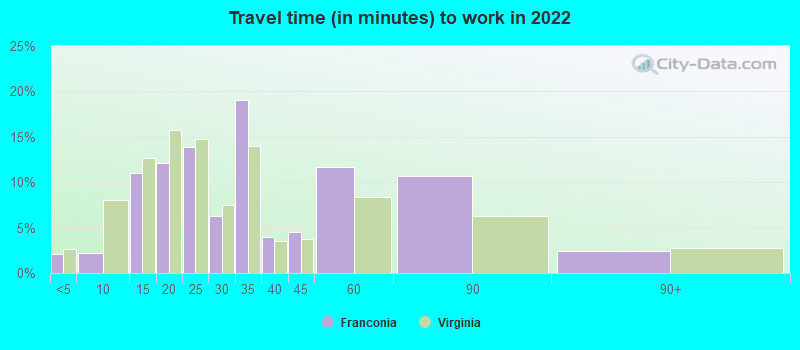
Travel time to work (commute)
- Less than 5 minutes: 110
- 5 to 9 minutes: 108
- 10 to 14 minutes: 683
- 15 to 19 minutes: 635
- 20 to 24 minutes: 1,034
- 25 to 29 minutes: 454
- 30 to 34 minutes: 1,467
- 35 to 39 minutes: 494
- 40 to 44 minutes: 599
- 45 to 59 minutes: 871
- 60 to 89 minutes: 560
- 90 or more minutes: 101
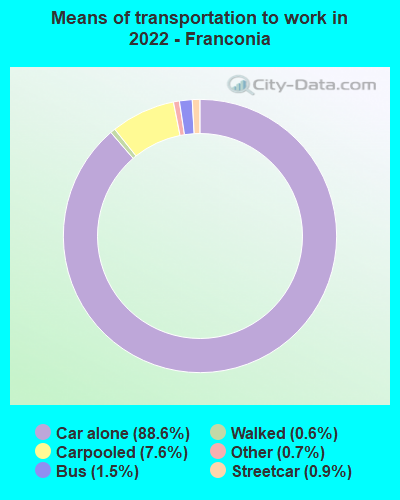
Means of transportation to work:
- Drove a car alone: 5,775 (54.7%)
- Carpooled: 511 (4.8%)
- Bus: 67 (0.6%)
- Subway or elevated rail: 48 (0.5%)
- Taxi: 65 (0.6%)
- Walked: 47 (0.4%)
- Worked at home: 4,539 (43.0%)

- Unemployment by race in 2022
- Unemployment rate for White non-Hispanic residents
- 5.0%Males
- 1.2%Females
- Unemployment rate for Black residents
- 3.3%Males
- Unemployment rate for Asian residents
- 0.4%Males
- Unemployment rate for other race residents
- 8.5%Males
- Unemployment rate for Hispanic or Latino residents
- 3.0%Males

- Year of entry for the foreign-born population in Franconia, Virginia
- 7492010 or later
- 1,2812000 to 2009
- 1,0391990 to 1999
- 2,0681980 to 1989
- 9941970 to 1979
- 649Before 1970
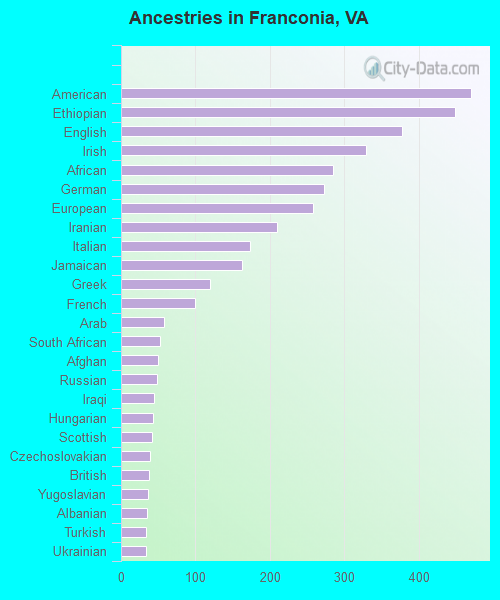
First ancestries reported:
- American: 471 (4.8%)
- Ethiopian: 449 (4.6%)
- English: 377 (3.9%)
- Irish: 329 (3.4%)
- African: 285 (2.9%)
- German: 273 (2.8%)
- European: 258 (2.7%)
- Iranian: 210 (2.2%)
- Italian: 174 (1.8%)
- Jamaican: 162 (1.7%)
- Greek: 119 (1.2%)
- French: 100 (1.0%)
- Arab: 58 (0.6%)
- South African: 53 (0.5%)
- Afghan: 50 (0.5%)
- Russian: 49 (0.5%)
- Iraqi: 45 (0.5%)
- Hungarian: 43 (0.4%)
- Scottish: 41 (0.4%)
- Czechoslovakian: 39 (0.4%)
- British: 38 (0.4%)
- Yugoslavian: 36 (0.4%)
- Albanian: 35 (0.4%)
- Turkish: 34 (0.3%)
- Ukrainian: 33 (0.3%)
- Sudanese: 30 (0.3%)
- Barbadian: 29 (0.3%)
- Lebanese: 28 (0.3%)
- Polish: 27 (0.3%)
- Romanian: 23 (0.2%)
- Scotch-Irish: 18 (0.2%)
- Portuguese: 18 (0.2%)
- Norwegian: 18 (0.2%)
- Swedish: 17 (0.2%)
- Lithuanian: 16 (0.2%)
- Eastern European: 14 (0.1%)
- Serbian: 14 (0.1%)
- Austrian: 13 (0.1%)
- Armenian: 12 (0.1%)
- Dutch: 11 (0.1%)
- Slovak: 11 (0.1%)
- Danish: 9 (0.09%)
- Nigerian: 7 (0.07%)
- Zimbabwean: 7 (0.07%)
- Slovene: 6 (0.06%)
- Ghanaian: 4 (0.04%)
- Brazilian: 2 (0.02%)
- Swiss: 2 (0.02%)
- Northern European: 1 (0.01%)
Most common places of birth for foreign-born residents (%):
| Franconia: | 12.5% (611) |
| Virginia: | 4.2% (45,750) |
| Franconia: | 10.8% (526) |
| Virginia: | 2.9% (32,082) |
| Franconia: | 5.8% (282) |
| Virginia: | 4.8% (52,629) |
| Franconia: | 5.7% (277) |
| Virginia: | 9.0% (97,830) |
| Franconia: | 4.7% (228) |
| Virginia: | 4.9% (52,857) |
| Franconia: | 4.1% (200) |
| Virginia: | 0.7% (7,672) |
| Franconia: | 4.1% (200) |
| Virginia: | 2.4% (26,366) |
| Franconia: | 3.4% (167) |
| Virginia: | 3.3% (35,938) |
| Franconia: | 3.1% (151) |
| Virginia: | 0.1% (950) |
| Franconia: | 2.9% (144) |
| Virginia: | 3.9% (42,989) |
| Franconia: | 2.4% (117) |
| Virginia: | 1.3% (14,417) |
| Franconia: | 2.4% (115) |
| Virginia: | 1.0% (10,734) |
| Franconia: | 2.1% (103) |
| Virginia: | 0.6% (6,916) |
| Franconia: | 2.0% (98) |
| Virginia: | 2.3% (24,582) |
| Franconia: | 1.9% (93) |
| Virginia: | 9.9% (107,534) |
| Franconia: | 1.8% (87) |
| Virginia: | 0.5% (4,997) |
| Franconia: | 1.8% (87) |
| Virginia: | 1.8% (19,426) |
| Franconia: | 1.7% (81) |
| Virginia: | 0.1% (1,443) |
| Franconia: | 1.6% (76) |
| Virginia: | 0.4% (4,715) |
Place of birth for U.S.-born residents:
- This state: 4,809
- Other state: 7,613
- Northeast: 2,162
- Midwest: 1,294
- South: 3,454
- West: 676
85.2% of Franconia residents lived in the same house 1 years ago.
Out of people who lived in different houses, 32.9% lived in this county.
Out of people who lived in different counties, 44.2% lived in Virginia.
| Franconia: | 85.2% |
| State average: | 86.6% |
Education attainment for males 25 years and older:
- No schooling: 28
- Nursery to 4th grade: 0
- 5th and 6th grade: 16
- 7th and 8th grade: 23
- 9th grade: 33
- 10th grade: 40
- 11th grade: 50
- 12th grade, no diploma: 156
- High school graduate (or equivalency): 772
- Less than 1 year of college: 242
- Some college more than 1 year, no degree: 472
- Associate degree: 485
- Bachelor's degree: 2,389
- Master's degree: 1,466
- Professional school degree: 355
- Doctorate degree: 210

Education attainment for females 25 years and older:
- No schooling: 84
- Nursery to 4th grade: 0
- 5th and 6th grade: 54
- 7th and 8th grade: 13
- 9th grade: 40
- 10th grade: 59
- 11th grade: 58
- 12th grade, no diploma: 72
- High school graduate (or equivalency): 681
- Less than 1 year of college: 271
- Some college more than 1 year, no degree: 560
- Associate degree: 314
- Bachelor's degree: 2,178
- Master's degree: 1,999
- Professional school degree: 353
- Doctorate degree: 163


Housing units in structures:
- One, detached: 1,737
- One, attached: 3,929
- Two: 101
- 3 or 4: 127
- 5 to 9: 471
- 10 to 19: 999
- 20 to 49: 276
- 50 or more: 82
House/condo owner moved in on average 11 years ago
Renter moved in on average 3 years ago

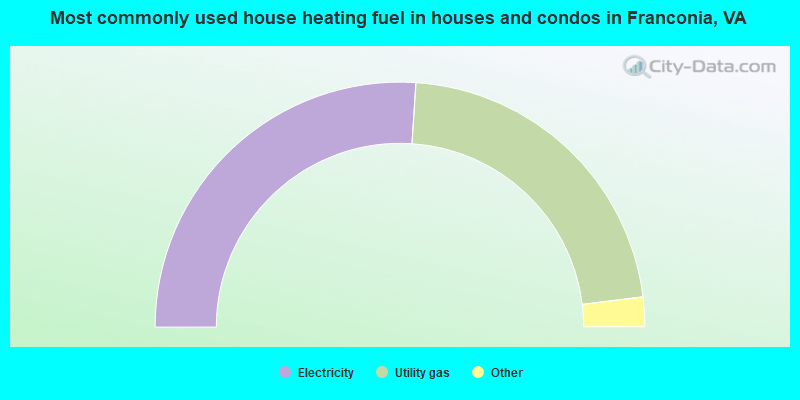
- 52.1%Electricity
- 44.0%Utility gas
- 1.8%Bottled, tank, or LP gas
- 0.9%Fuel oil, kerosene, etc.
- 0.7%Wood
- 0.3%Other fuel
- 0.2%No fuel used
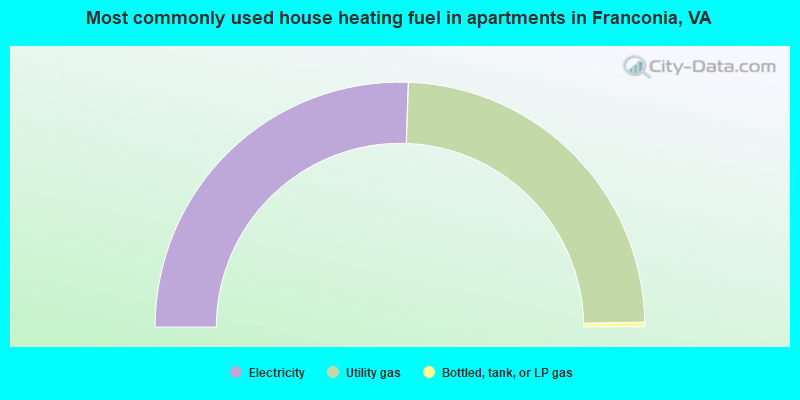
- 51.1%Electricity
- 48.3%Utility gas
- 0.6%Bottled, tank, or LP gas
Private vs. public school enrollment:
| Here: | 9.1% |
| Virginia: | 13.2% |
| Here: | 14.0% |
| Virginia: | 10.2% |
| Here: | 27.9% |
| Virginia: | 18.7% |


