Housing density: 3,584 houses/condos per square mile
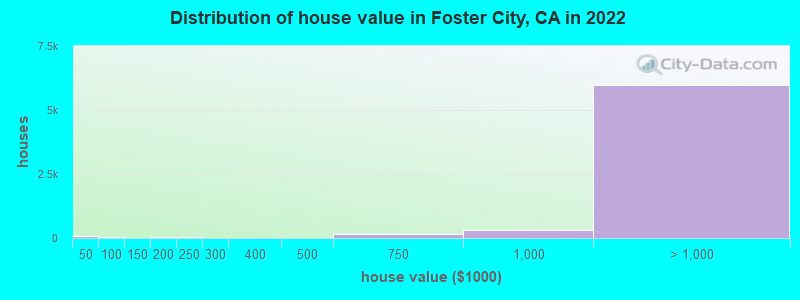
Median price asked for vacant for-sale houses and condos in 2022 in this county: $912,464.
Median contract rent in 2022: over $2,000 (lower quartile is over $2,000, upper quartile is over $2,000)
Median rent asked for vacant for-rent units in 2022: $4,229
Median gross rent in Foster City, CA in 2022: over $2,000
Housing units in Foster City with a mortgage: 4,279 (633 second mortgage, 16 home equity loan, 608 both second mortgage and home equity loan) Houses without a mortgage: 83
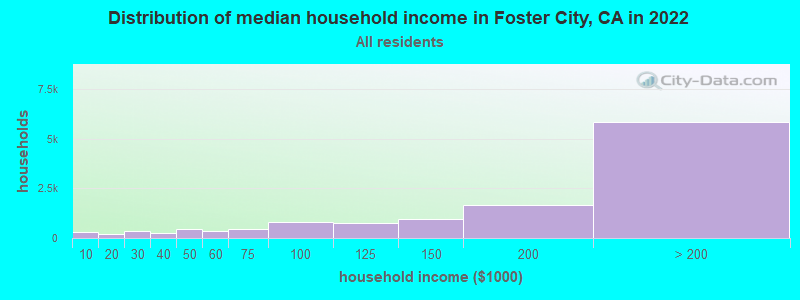
Median household income for houses/condos with a mortgage: $245,782
Median household income for apartments without a mortgage: $120,706
Median monthly housing costs: $3,470
Compare current foreclosures near Foster City, CA:
5,325 married couples with children.
1,191 single-parent households (191 men, 1,000 women).
46.6% of residents of Foster City speak English at home.
3.9% of residents speak Spanish at home (85% speak English very well, 9% speak English well, 5% speak English not well).
15.4% of residents speak other Indo-European language at home (84% speak English very well, 12% speak English well, 4% speak English not well).
32.6% of residents speak Asian or Pacific Island language at home (62% speak English very well, 28% speak English well, 8% speak English not well, 2% don't speak English at all).
2.7% of residents speak other language at home (65% speak English very well, 10% speak English well, 25% speak English not well).
Foreign born population: 15,705 (48.9%)
(48.6% of them are naturalized citizens)
Percentage of workers working in this county: 81.0% Number of people working at home: 5,487 (34.5% of all workers)
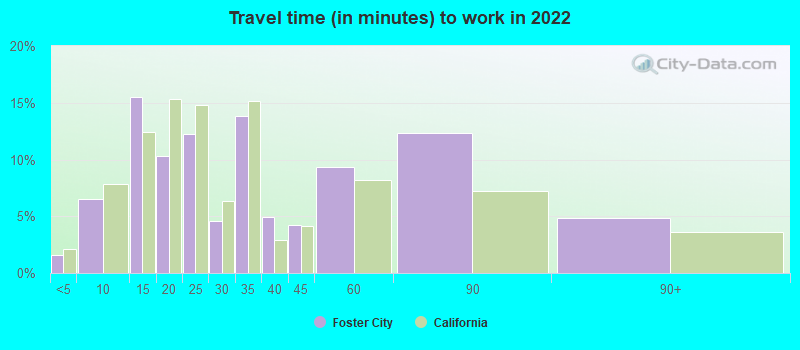
Travel time to work (commute)
Less than 5 minutes: 90
5 to 9 minutes: 973
10 to 14 minutes: 1,185
15 to 19 minutes: 1,168
20 to 24 minutes: 1,287
25 to 29 minutes: 840
30 to 34 minutes: 1,844
35 to 39 minutes: 494
40 to 44 minutes: 627
45 to 59 minutes: 1,049
60 to 89 minutes: 709
90 or more minutes: 288
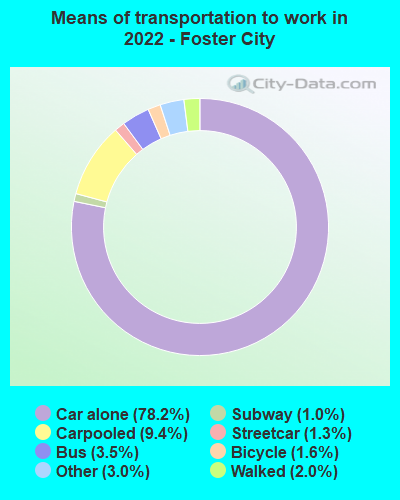
Means of transportation to work:
Drove a car alone: 10,533 (56.3%)
Carpooled: 1,380 (7.4%)
Bus: 419 (2.2%)
Subway or elevated rail: 135 (0.7%)
Long-distance train or commuter rail: 139 (0.7%)
Light rail, streetcar or trolley: 8 (0.0%)
Taxi: 325 (1.7%)
Bicycle: 246 (1.3%)
Walked: 309 (1.7%)
Worked at home: 5,487 (29.3%)
Unemployment by race in 2022
Unemployment rate for White non-Hispanic residents
1.9%Males
2.1%Females
Unemployment rate for Black residents
2.7%Males
9.5%Females
Unemployment rate for Asian residents
2.0%Males
5.4%Females
Unemployment rate for other race residents
5.7%Males
Unemployment rate for two or more race residents
4.0%Males
4.1%Females
Unemployment rate for Hispanic or Latino residents
2.2%Males
5.8%Females
Year of entry for the foreign-born population in Foster City, California
7,2132010 or later
2,9112000 to 2009
2,3421990 to 1999
2,4411980 to 1989
1,5401970 to 1979
1,570Before 1970
First ancestries reported:
English: 499 (2.3%)
Iranian: 489 (2.2%)
American: 420 (1.9%)
German: 418 (1.9%)
Russian: 372 (1.7%)
Italian: 345 (1.6%)
European: 276 (1.3%)
Irish: 219 (1.0%)
Nigerian: 164 (0.7%)
Hungarian: 145 (0.7%)
Polish: 140 (0.6%)
Palestinian: 115 (0.5%)
Swedish: 112 (0.5%)
Portuguese: 83 (0.4%)
Armenian: 83 (0.4%)
Scottish: 79 (0.4%)
Ukrainian: 74 (0.3%)
Brazilian: 70 (0.3%)
Scotch-Irish: 68 (0.3%)
Senegalese: 68 (0.3%)
Dutch: 62 (0.3%)
Turkish: 62 (0.3%)
Canadian: 60 (0.3%)
British: 59 (0.3%)
Israeli: 58 (0.3%)
Greek: 57 (0.3%)
Scandinavian: 52 (0.2%)
French: 42 (0.2%)
Eastern European: 42 (0.2%)
Belgian: 36 (0.2%)
Arab: 35 (0.2%)
Jordanian: 32 (0.1%)
French Canadian: 29 (0.1%)
Slovak: 28 (0.1%)
Serbian: 25 (0.1%)
Maltese: 24 (0.1%)
Egyptian: 20 (0.09%)
Danish: 18 (0.08%)
Northern European: 15 (0.07%)
Czech: 13 (0.06%)
African: 11 (0.05%)
Lebanese: 10 (0.05%)
Romanian: 10 (0.05%)
Czechoslovakian: 10 (0.05%)
Yugoslavian: 9 (0.04%)
South African: 8 (0.04%)
Austrian: 6 (0.03%)
Swiss: 5 (0.02%)
Cajun: 5 (0.02%)
Most common places of birth for foreign-born residents (%):
China, excluding Hong Kong and Taiwan
Foster City:
24.4% (3,876)
California:
6.6% (684,672)
India
Foster City:
24.2% (3,856)
California:
5.2% (539,184)
Philippines
Foster City:
6.3% (1,003)
California:
7.8% (818,297)
Taiwan
Foster City:
5.5% (868)
California:
1.7% (176,274)
Japan
Foster City:
3.9% (624)
California:
1.0% (103,575)
Iran
Foster City:
3.4% (544)
California:
2.0% (206,004)
Hong Kong
Foster City:
3.4% (544)
California:
1.0% (105,215)
Korea
Foster City:
3.0% (474)
California:
3.0% (315,248)
Russia
Foster City:
2.3% (359)
California:
0.7% (71,932)
Vietnam
Foster City:
1.7% (269)
California:
4.9% (512,335)
Place of birth for U.S.-born residents:
This state: 11,778
Other state: 4,286
Northeast: 1,607
Midwest: 1,147
South: 675
West: 838
79.5% of Foster City residents lived in the same house 1 years ago. Out of people who lived in different houses, 37.8% lived in this county. Out of people who lived in different counties, 66.1% lived in California.
Foster City:
79.5%
State average:
88.9%
Education attainment for males 25 years and older:
No schooling: 230
Nursery to 4th grade: 0
5th and 6th grade: 0
7th and 8th grade: 19
9th grade: 16
10th grade: 12
11th grade: 46
12th grade, no diploma: 78
High school graduate (or equivalency): 781
Less than 1 year of college: 236
Some college more than 1 year, no degree: 772
Associate degree: 496
Bachelor's degree: 3,992
Master's degree: 3,468
Professional school degree: 443
Doctorate degree: 1,188
Education attainment for females 25 years and older:
No schooling: 202
Nursery to 4th grade: 19
5th and 6th grade: 54
7th and 8th grade: 73
9th grade: 41
10th grade: 77
11th grade: 8
12th grade, no diploma: 134
High school graduate (or equivalency): 933
Less than 1 year of college: 497
Some college more than 1 year, no degree: 873
Associate degree: 667
Bachelor's degree: 4,095
Master's degree: 3,357
Professional school degree: 410
Doctorate degree: 802
Housing units in structures:
One, detached: 4,700
One, attached: 2,477
Two: 160
3 or 4: 795
5 to 9: 730
10 to 19: 1,098
20 to 49: 1,309
50 or more: 2,187
Mobile homes: 8
Housing units lacking complete plumbing facilities in 2022: 0.4%
Housing units lacking complete kitchen facilities in 2022: 1.2%
House/condo owner moved in on average 17 years ago