Fort Washington, MD (Maryland) Houses and Residents
Estimated median house or condo value in 2022: $479,681 (it was $171,400 in 2000 )
Fort Washington:
$479,681Maryland:
$398,100
Lower value quartile - upper value quartile: $378,836 - $611,331Mean price in 2022: Detached houses: $477,670 Here:
$477,670State:
$526,819
Townhouses or other attached units: $172,335 Here:
$172,335State:
$328,305
Total population: 23,717 (All urban)
Houses: 9,095 (8,683 occupied: 7,953 owner occupied, 769 renter occupied )
% of renters here:
9%State:
32%
Housing density: 670 houses/condos per square mile
Median price asked for vacant for-sale houses and condos in 2022: $433,095.
Median contract rent in 2022: over $2,000 (lower quartile is $1,425, upper quartile is over $2,000)
Median rent asked for vacant for-rent units in 2022: $4,917
Median gross rent in Fort Washington, MD in 2022: over $2,000
Housing units in Fort Washington with a mortgage: 6,506 (608 second mortgage, 20 home equity loan, 592 both second mortgage and home equity loan )Houses without a mortgage: 68
Median household income for houses/condos with a mortgage: $147,670
Median household income for apartments without a mortgage: $112,158
Median monthly housing costs: $2,329
Data:
Median house or condo value ($)
Median house or condo value ($ change since 2000)
Median house or condo value ($) - White
Median house or condo value ($) - Black or African American
Median house or condo value ($) - Asian
Median house or condo value ($) - Hispanic or Latino
Median house or condo value ($) - American Indian and Alaska Native
Median house or condo value ($) - Multirace
Median house or condo value ($) - Other Race
Median price asked for mobile homes ($)
Household density (households per square mile)
Mean house or condo value by units in structure - 1, detached ($)
Mean house or condo value by units in structure - 1, attached ($)
Mean house or condo value by units in structure - 2 ($)
Mean house or condo value by units in structure by units in structure - 3 or 4 ($)
Mean house or condo value by units in structure - 5 or more ($)
Mean house or condo value by units in structure - Boat, RV, van, etc. ($)
Mean house or condo value by units in structure - Mobile home ($)
Median contract rent ($)
Median contract rent - Lower quartile ($)
Median contract rent - Upper quartile ($)
Median gross rent ($)
Urban houses (%)
Rural houses (%)
Houses occupied (%)
Houses occupied (% change since 2000)
Houses owner occupied (%)
Houses owner occupied (% change since 2000)
Houses renter occupied (%)
Houses renter occupied (% change since 2000)
Vacant housing units - For rent (%)
Vacant housing units - For rent (% change since 2000)
Vacant housing units - For sale only (%)
Vacant housing units - For sale only (% change since 2000)
Vacant housing units - Rented or sold, not occupied (%)
Vacant housing units - Rented or sold, not occupied (% change since 2000)
Vacant housing units - For seasonal, recreational, or occasional use (%)
Vacant housing units - For seasonal, recreational, or occasional use (% change since 2000)
Vacant housing units - For migrant workers (%)
Vacant housing units - For migrant workers (% change since 2000)
Vacant housing units - Other vacant (%)
Vacant housing units - Other vacant (% change since 2000)
Median monthly housing costs ($)
Median household income for houses/condos with a mortgage ($)
Median household income for houses/condos without a mortgage ($)
Median household income ($)
Median household income ($) - White
Median household income ($) - Black or African American
Median household income ($) - Asian
Median household income ($) - Hispanic or Latino
Median household income ($) - American Indian and Alaska Native
Median household income ($) - Multirace
Median household income ($) - Other Race
Mortgage status - with mortgage (%)
Mortgage status - with second mortgage (%)
Mortgage status - with home equity loan (%)
Mortgage status - with both second mortgage and home equity loan (%)
Mortgage status - without a mortgage (%)
Median year house/condo built
Median year apartment built
Household type by relationship - Male householder living alone (%)
Household type by relationship - Male householder not living alone (%)
Household type by relationship - Female householder living alone (%)
Household type by relationship - Female householder not living alone (%)
Household type by relationship - Opposite-Sex spouse (%)
Household type by relationship - Same-Sex spouse (%)
Household type by relationship - Opposite-Sex unmarried partner (%)
Household type by relationship - Same-Sex unmarried partner (%)
Household type by relationship - In group quarters (%)
Size of family households - 2-person household (%)
Size of family households - 3-person household (%)
Size of family households - 4-person household (%)
Size of family households - 5-person household (%)
Size of family households - 6-person household (%)
Size of family households - 7-or-more-person household (%)
Size of nonfamily households - 1-person household (%)
Size of nonfamily households - 2-person household (%)
Size of nonfamily households - 3-person household (%)
Size of nonfamily households - 4-person household (%)
Size of nonfamily households - 5-person household (%)
Size of nonfamily households - 6-person household (%)
Size of nonfamily households - 7-or-moreperson household (%)
Year house built - Built 2010 or later (%)
Year house built - Built 2000 to 2009 (%)
Year house built - Built 1990 to 1999 (%)
Year house built - Built 1980 to 1989 (%)
Year house built - Built 1970 to 1979 (%)
Year house built - Built 1960 to 1969 (%)
Year house built - Built 1950 to 1959 (%)
Year house built - Built 1940 to 1949 (%)
Year house built - Built 1939 or earlier (%)
Median number of rooms in houses and condos
Median number of rooms in apartments
Median number of bedrooms in owner occupied houses
Mean number of bedrooms in owner occupied houses
Median number of bedrooms in renter occupied houses
Mean number of bedrooms in renter occupied houses
Median number of vehichles in owner occupied houses
Mean number of vehichles in owner occupied houses
Median number of vehichles in renter occupied houses
Mean number of vehichles in renter occupied houses
Rooms in owner-occupied houses - 1 room (%)
Rooms in owner-occupied houses - 2 rooms (%)
Rooms in owner-occupied houses - 3 rooms (%)
Rooms in owner-occupied houses - 4 rooms (%)
Rooms in owner-occupied houses - 5 rooms (%)
Rooms in owner-occupied houses - 6 rooms (%)
Rooms in owner-occupied houses - 7 rooms (%)
Rooms in owner-occupied houses - 8 rooms (%)
Rooms in owner-occupied houses - 9+ rooms (%)
Rooms in renter-occupied houses - 1 room (%)
Rooms in renter-occupied houses - 2 rooms (%)
Rooms in renter-occupied houses - 3 rooms (%)
Rooms in renter-occupied houses - 4 rooms (%)
Rooms in renter-occupied houses - 5 rooms (%)
Rooms in renter-occupied houses - 6 rooms (%)
Rooms in renter-occupied houses - 7 rooms (%)
Rooms in renter-occupied houses - 8 rooms (%)
Rooms in renter-occupied houses - 9+ rooms (%)
Bedrooms in owner-occupied houses - no bedrooms (%)
Bedrooms in owner-occupied houses - 1 bedroom (%)
Bedrooms in owner-occupied houses - 2 bedrooms (%)
Bedrooms in owner-occupied houses - 3 bedrooms (%)
Bedrooms in owner-occupied houses - 4 bedrooms (%)
Bedrooms in owner-occupied houses - 5+ bedrooms (%)
Bedrooms in renter-occupied houses - no bedrooms (%)
Bedrooms in renter-occupied houses - 1 bedroom (%)
Bedrooms in renter-occupied houses - 2 bedrooms (%)
Bedrooms in renter-occupied houses - 3 bedrooms (%)
Bedrooms in renter-occupied houses - 4 bedrooms (%)
Bedrooms in renter-occupied houses - 5+ bedrooms (%)
Vehicles available in owner-occupied houses - no vehicle available (%)
Vehicles available in owner-occupied houses - 1 vehicle available(%)
Vehicles available in owner-occupied houses - 2 Vehicles available (%)
Vehicles available in owner-occupied houses - 3 Vehicles available (%)
Vehicles available in owner-occupied houses - 4 Vehicles available (%)
Vehicles available in owner-occupied houses - 5+ Vehicles available (%)
Vehicles available in renter-occupied houses - no vehicle available (%)
Vehicles available in renter-occupied houses - 1 vehicle available (%)
Vehicles available in renter-occupied houses - 2 Vehicles available (%)
Vehicles available in renter-occupied houses - 3 Vehicles available (%)
Vehicles available in renter-occupied houses - 4 Vehicles available (%)
Vehicles available in renter-occupied houses - 5+ Vehicles available (%)
Housing units in structures - 1, detached (%)
Housing units in structures - 1, attached (%)
Housing units in structures - 2 (%)
Housing units in structures - 3 or 4 (%)
Housing units in structures - 5 to 9 (%)
Housing units in structures - 10 to 19 (%)
Housing units in structures - 20 to 49 (%)
Housing units in structures - 50 or more (%)
Housing units in structures - Mobile home (%)
Housing units in structures - Boat, RV, van, etc. (%)
Housing units in structures - Owners - 1, detached (%)
Housing units in structures - Owners - 1, attached (%)
Housing units in structures - Owners - 2 (%)
Housing units in structures - Owners - 3 or 4 (%)
Housing units in structures - Owners - 5 to 9 (%)
Housing units in structures - Owners - 10 to 19 (%)
Housing units in structures - Owners - 20 to 49 (%)
Housing units in structures - Owners - 50 or more (%)
Housing units in structures - Owners - Mobile home (%)
Housing units in structures - Owners - Boat, RV, van, etc. (%)
Housing units in structures - Renters - 1, detached (%)
Housing units in structures - Renters - 1, attached (%)
Housing units in structures - Renters - 2 (%)
Housing units in structures - Renters - 3 or 4 (%)
Housing units in structures - Renters - 5 to 9 (%)
Housing units in structures - Renters - 10 to 19 (%)
Housing units in structures - Renters - 20 to 49 (%)
Housing units in structures - Renters - 50 or more (%)
Housing units in structures - Renters - Mobile home (%)
Housing units in structures - Renters - Boat, RV, van, etc. (%)
House/condo owner moved in on average (years ago)
Renter moved in on average (years ago)
Year householder moved into unit - Moved in 1999 to March 2000 (%)
Year householder moved into unit - Moved in 1999 to March 2000 (%) - White
Year householder moved into unit - Moved in 1999 to March 2000 (%) - Black or African American
Year householder moved into unit - Moved in 1999 to March 2000 (%) - Asian
Year householder moved into unit - Moved in 1999 to March 2000 (%) - Hispanic or Latino
Year householder moved into unit - Moved in 1999 to March 2000 (%) - American Indian and Alaska Native
Year householder moved into unit - Moved in 1999 to March 2000 (%) - Multirace
Year householder moved into unit - Moved in 1999 to March 2000 (%) - Other Race
Year householder moved into unit - Moved in 1995 to 1998 (%)
Year householder moved into unit - Moved in 1995 to 1998 (%) - White
Year householder moved into unit - Moved in 1995 to 1998 (%) - Black or African American
Year householder moved into unit - Moved in 1995 to 1998 (%) - Asian
Year householder moved into unit - Moved in 1995 to 1998 (%) - Hispanic or Latino
Year householder moved into unit - Moved in 1995 to 1998 (%) - American Indian and Alaska Native
Year householder moved into unit - Moved in 1995 to 1998 (%) - Multirace
Year householder moved into unit - Moved in 1995 to 1998 (%) - Other Race
Year householder moved into unit - Moved in 1990 to 1994 (%)
Year householder moved into unit - Moved in 1990 to 1994 (%) - White
Year householder moved into unit - Moved in 1990 to 1994 (%) - Black or African American
Year householder moved into unit - Moved in 1990 to 1994 (%) - Asian
Year householder moved into unit - Moved in 1990 to 1994 (%) - Hispanic or Latino
Year householder moved into unit - Moved in 1990 to 1994 (%) - American Indian and Alaska Native
Year householder moved into unit - Moved in 1990 to 1994 (%) - Multirace
Year householder moved into unit - Moved in 1990 to 1994 (%) - Other Race
Year householder moved into unit - Moved in 1980 to 1989 (%)
Year householder moved into unit - Moved in 1980 to 1989 (%) - White
Year householder moved into unit - Moved in 1980 to 1989 (%) - Black or African American
Year householder moved into unit - Moved in 1980 to 1989 (%) - Asian
Year householder moved into unit - Moved in 1980 to 1989 (%) - Hispanic or Latino
Year householder moved into unit - Moved in 1980 to 1989 (%) - American Indian and Alaska Native
Year householder moved into unit - Moved in 1980 to 1989 (%) - Multirace
Year householder moved into unit - Moved in 1980 to 1989 (%) - Other Race
Year householder moved into unit - Moved in 1970 to 1979 (%)
Year householder moved into unit - Moved in 1970 to 1979 (%) - White
Year householder moved into unit - Moved in 1970 to 1979 (%) - Black or African American
Year householder moved into unit - Moved in 1970 to 1979 (%) - Asian
Year householder moved into unit - Moved in 1970 to 1979 (%) - Hispanic or Latino
Year householder moved into unit - Moved in 1970 to 1979 (%) - American Indian and Alaska Native
Year householder moved into unit - Moved in 1970 to 1979 (%) - Multirace
Year householder moved into unit - Moved in 1970 to 1979 (%) - Other Race
Year householder moved into unit - Moved in 1969 or earlier (%)
Year householder moved into unit - Moved in 1969 or earlier (%) - White
Year householder moved into unit - Moved in 1969 or earlier (%) - Black or African American
Year householder moved into unit - Moved in 1969 or earlier (%) - Asian
Year householder moved into unit - Moved in 1969 or earlier (%) - Hispanic or Latino
Year householder moved into unit - Moved in 1969 or earlier (%) - American Indian and Alaska Native
Year householder moved into unit - Moved in 1969 or earlier (%) - Multirace
Year householder moved into unit - Moved in 1969 or earlier (%) - Other Race
Housing units lacking complete plumbing facilities (%)
Housing units lacking complete kitchen facilities (%)
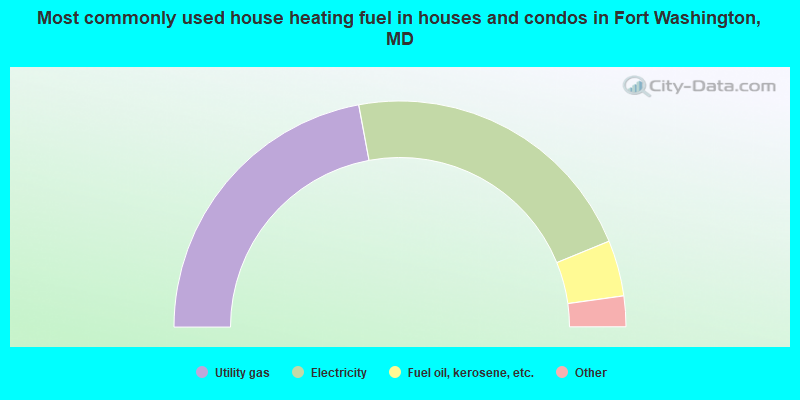
House heating fuel used in houses and condos - Utility gas (%)
House heating fuel used in houses and condos - Bottled, tank, or LP gas (%)
House heating fuel used in houses and condos - Electricity (%)
House heating fuel used in houses and condos - Fuel oil, kerosene, etc. (%)
House heating fuel used in houses and condos - Coal or coke (%)
House heating fuel used in houses and condos - Wood (%)
House heating fuel used in houses and condos - Solar energy (%)
House heating fuel used in houses and condos - Other fuel (%)
House heating fuel used in houses and condos - No fuel used (%)
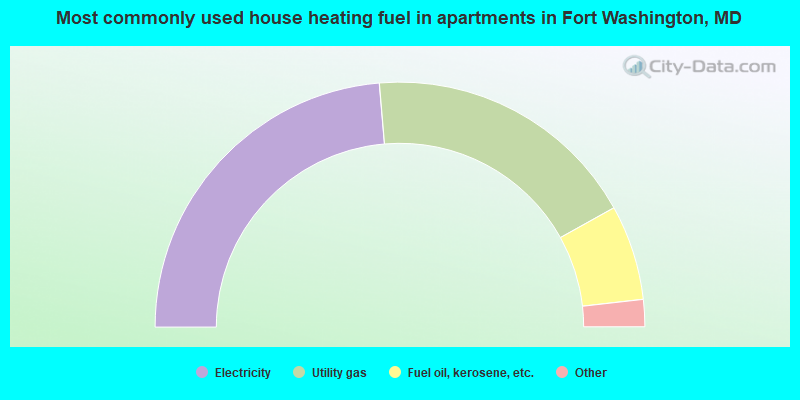
House heating fuel used in apartments - Utility gas (%)
House heating fuel used in apartments - Bottled, tank, or LP gas (%)
House heating fuel used in apartments - Electricity (%)
House heating fuel used in apartments - Fuel oil, kerosene, etc. (%)
House heating fuel used in apartments - Coal or coke (%)
House heating fuel used in apartments - Wood (%)
House heating fuel used in apartments - Solar energy (%)
House heating fuel used in apartments - Other fuel (%)
House heating fuel used in apartments - No fuel used (%)
Median year house/condo built: 1982Median year apartment built: 1983Household type by relationship:
Households: 25,549
Male householders: 4,167 (590 living alone ), Female householders: 4,310 (776 living alone )4,839 spouses (4,815 opposite-sex spouses ), 496 unmarried partners , (430 opposite-sex unmarried partners ), 7,566 children (6,677 natural , 283 adopted , 604 stepchildren ), 832 grandchildren , 709 brothers or sisters , 755 parents , 32 foster children , 680 other relatives , 941 non-relatives In group quarters: 216
Size of family households: 3,088 2-persons , 1,606 3-persons , 1,249 4-persons , 570 5-persons , 299 6-persons , 261 7-or-more-persons .
Size of nonfamily households: 1,345 1-person , 266 2-persons , 40 3-persons , 18 4-persons , 31 5-persons , 32 7-or-more-persons .
2,865 married couples with children. single-parent households (579 men , 732 women ).
72.2% of residents of Fort Washington speak English at home. of residents speak Spanish at home (63% speak English very well , 20% speak English well , 8% speak English not well , 9% don't speak English at all ).of residents speak other Indo-European language at home (86% speak English very well , 11% speak English well , 3% speak English not well ).of residents speak Asian or Pacific Island language at home (82% speak English very well , 16% speak English well , 2% speak English not well ).of residents speak other language at home (89% speak English very well , 10% speak English well , 1% speak English not well ).
Foreign born population: 6,047 (23.7%)of them are naturalized citizens )
Median number of rooms in houses and condos:
Median number of rooms in apartments
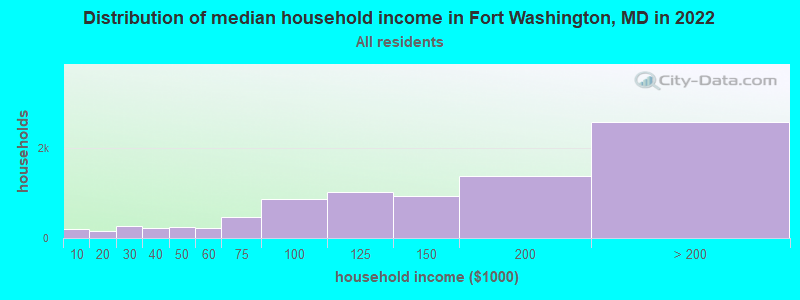
Fort Washington, MD household income distribution 191 Less than $10,000152 $10,000 to $19,999259 $20,000 to $29,999221 $30,000 to $39,999243 $40,000 to $49,999230 $50,000 to $59,999469 $60,000 to $74,999858 $75,000 to $99,9991,029 $100,000 to $124,999929 $125,000 to $149,9991,375 $150,000 to $199,9992,574 $200,000 or more
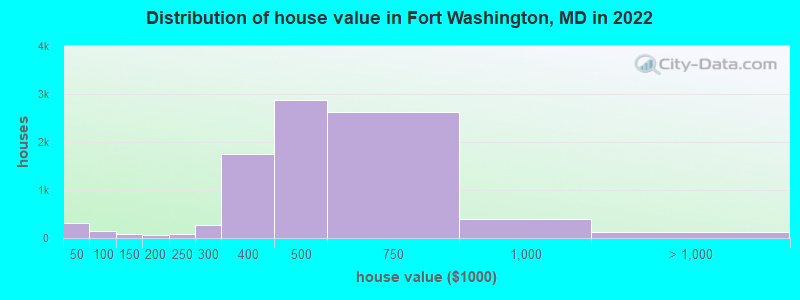
Home value of owner - occupied houses in 2022 in Fort Washington, MD 152 Less than $10,00046 $30,000 to $34,999104 $40,000 to $49,99915 $50,000 to $59,99911 $70,000 to $79,9998 $90,000 to $99,99935 $100,000 to $124,99946 $125,000 to $149,99919 $150,000 to $174,99944 $175,000 to $199,99991 $200,000 to $249,999274 $250,000 to $299,9991,742 $300,000 to $399,9992,884 $400,000 to $499,9992,631 $500,000 to $749,999385 $750,000 to $999,99973 $1,000,000 to $1,499,99945 $1,500,000 to $1,999,9996 $2,000,000 or moreRent paid by renters in 2022 in Fort Washington, MD 12 $150 to $19917 $200 to $2491 $250 to $2995 $350 to $39931 $900 to $99937 $1,000 to $1,24998 $1,250 to $1,49981 $1,500 to $1,999258 $2,000 to $2,49985 $2,500 to $2,99936 $3,000 to $3,49916 $3,500 or more19 No cash rent
Percentage of workers working in this county: 38.3%Number of people working at home: 2,598 (19.8% of all workers )
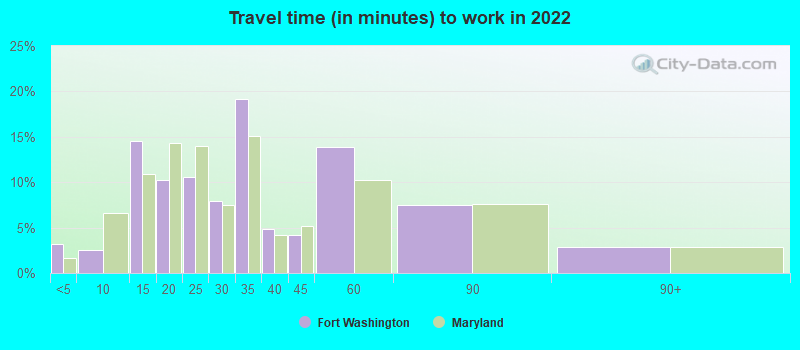
Travel time to work (commute)
Less than 5 minutes: 1025 to 9 minutes: 14610 to 14 minutes: 29315 to 19 minutes: 68020 to 24 minutes: 1,13125 to 29 minutes: 66030 to 34 minutes: 1,67035 to 39 minutes: 57240 to 44 minutes: 71045 to 59 minutes: 2,17760 to 89 minutes: 1,55890 or more minutes: 691
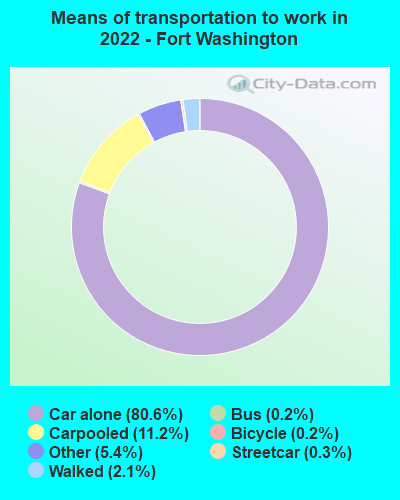
Means of transportation to work:
Drove a car alone: 3,254 (52.2%)Carpooled: 411 (6.6%)Bus : 4 (0.1%)Subway or elevated rail : 7 (0.1%)Taxi: 278 (4.5%)Bicycle: 8 (0.1%)Walked: 84 (1.3%)Worked at home: 2,598 (41.7%)
Unemployment by race in 2022
Unemployment rate for White non-Hispanic residents 3.6% Males10.3% FemalesUnemployment rate for Black residents 5.9% Males3.5% FemalesUnemployment rate for American Indian and Alaska Native residents 88.2% FemalesUnemployment rate for Asian residents 2.0% Males2.9% FemalesUnemployment rate for other race residents 4.3% Males12.8% FemalesUnemployment rate for two or more race residents 3.1% FemalesUnemployment rate for Hispanic or Latino residents 3.4% Males7.0% Females
Year of entry for the foreign-born population in Fort Washington, Maryland
1,733 2010 or later 1,419 2000 to 2009 918 1990 to 1999 836 1980 to 1989 694 1970 to 1979 786 Before 1970
First ancestries reported:
Jamaican: 366 (2.0%)
Trinidadian and Tobagonian: 257 (1.4%)
Arab: 215 (1.2%)
American: 210 (1.2%)
Ethiopian: 208 (1.2%)
African: 196 (1.1%)
Ghanaian: 192 (1.1%)
Irish: 171 (0.9%)
Haitian: 137 (0.8%)
German: 116 (0.6%)
Nigerian: 112 (0.6%)
English: 62 (0.3%)
Sierra Leonean: 58 (0.3%)
European: 55 (0.3%)
Polish: 52 (0.3%)
French: 36 (0.2%)
British West Indian: 35 (0.2%)
British: 32 (0.2%)
Russian: 28 (0.2%)
Italian: 28 (0.2%)
Scottish: 25 (0.1%)
Norwegian: 24 (0.1%)
Turkish: 24 (0.1%)
Ukrainian: 23 (0.1%)
Greek: 22 (0.1%)
Northern European: 19 (0.1%)
Scotch-Irish: 18 (0.10%)
Eastern European: 14 (0.08%)
Austrian: 13 (0.07%)
Kenyan: 12 (0.07%)
Czechoslovakian: 11 (0.06%)
Egyptian: 8 (0.04%)
Swedish: 8 (0.04%)
Barbadian: 8 (0.04%)
Cape Verdean: 6 (0.03%)
Iranian: 6 (0.03%)
U.S. Virgin Islander: 5 (0.03%)
Guyanese: 4 (0.02%)
French Canadian: 2 (0.01%)
Belizean: 1 (0.01%) Most common places of birth for foreign-born residents (%): Philippines Fort Washington:
25.0% (1,493)Maryland:
3.8% (36,698)
El Salvador Fort Washington:
21.4% (1,274)Maryland:
12.0% (115,412)
Honduras Fort Washington:
6.5% (388)Maryland:
2.5% (24,026)
Jamaica Fort Washington:
5.2% (309)Maryland:
2.8% (27,444)
Guatemala Fort Washington:
4.1% (242)Maryland:
4.4% (42,350)
Bolivia Fort Washington:
3.8% (227)Maryland:
0.7% (7,000)
Trinidad and Tobago Fort Washington:
3.6% (215)Maryland:
1.2% (11,481)
Mexico Fort Washington:
2.9% (172)Maryland:
3.5% (34,065)
Dominican Republic Fort Washington:
2.8% (165)Maryland:
1.4% (13,947)
Ghana Fort Washington:
2.7% (162)Maryland:
1.8% (17,774)
Korea Fort Washington:
2.5% (149)Maryland:
3.4% (32,635)
Yemen Fort Washington:
2.1% (126)Maryland:
0.1% (512)
Peru Fort Washington:
1.9% (114)Maryland:
1.8% (17,161)
Sierra Leone Fort Washington:
1.8% (107)Maryland:
1.1% (10,233)
Place of birth for U.S.-born residents:
This state: 3,901Other state: 14,783Northeast: 2,023Midwest: 855South: 10,890West: 1,013 92.2% of Fort Washington residents lived in the same house 1 years ago.
Out of people who lived in different houses, 35.4% lived in this county.
Out of people who lived in different counties, 13.2% lived in Maryland.
Fort Washington:
92.2%State average:
88.5%
Education attainment for males 25 years and older:
No schooling: 241Nursery to 4th grade: 2165th and 6th grade: 857th and 8th grade: 09th grade: 010th grade: 1111th grade: 7012th grade, no diploma: 180High school graduate (or equivalency): 2,206Less than 1 year of college: 642Some college more than 1 year, no degree: 1,234Associate degree: 662Bachelor's degree: 2,184Master's degree: 1,402Professional school degree: 236Doctorate degree: 126
Education attainment for females 25 years and older:
No schooling: 71Nursery to 4th grade: 825th and 6th grade: 1337th and 8th grade: 539th grade: 1410th grade: 711th grade: 7412th grade, no diploma: 108High school graduate (or equivalency): 1,826Less than 1 year of college: 603Some college more than 1 year, no degree: 1,171Associate degree: 930Bachelor's degree: 2,765Master's degree: 1,269Professional school degree: 250Doctorate degree: 264
Housing units in structures:
One, detached: 8,814One, attached: 150Two: 133 or 4: 95 to 9: 1420 to 49: 1250 or more: 81House/condo owner moved in on average 16 years ago
Renter moved in on average 5 years ago
Private vs. public school enrollment:
Students in private schools in grades 1 to 8 (elementary and middle school): 533 Students in private schools in grades 9 to 12 (high school): 241 Students in private undergraduate colleges: 154