Fort Madison, IA (Iowa) Houses and Residents
| Fort Madison: | $100,943 |
| Iowa: | $194,600 |
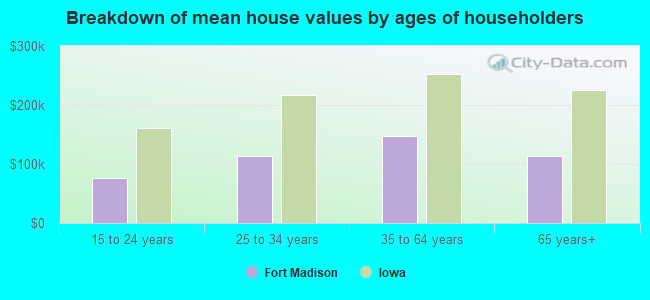
Mean price in 2022:
Detached houses: $174,303
Here: $174,303 State: $245,224 Townhouses or other attached units: $129,955
Here: $129,955 State: $238,767 In 2-unit structures: $84,337
Here: $84,337 State: $243,070 In 3-to-4-unit structures: $190,099
Here: $190,099 State: $162,139 Mobile homes: $17,323
Here: $17,323 State: $51,271
Total population: 10,764 (Urban population: 10,567 (all inside urban clusters), Rural population: 320 (all nonfarm))
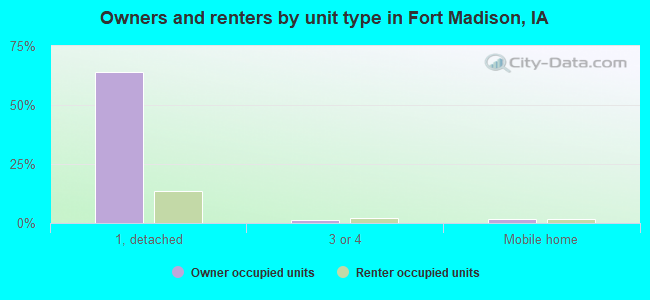
Houses: 5,176 (4,509 occupied: 3,318 owner occupied, 1,263 renter occupied)
| % of renters here: | 28% |
| State: | 28% |
Housing density: 562 houses/condos per square mile
Median price asked for vacant for-sale houses and condos in 2022: $23,104.
Median contract rent in 2022: $604 (lower quartile is $395, upper quartile is $820)
Median rent asked for vacant for-rent units in 2022: $450
Median gross rent in Fort Madison, IA in 2022: $785
Housing units in Fort Madison with a mortgage: 1,885 (154 second mortgage, 0 home equity loan, 106 both second mortgage and home equity loan)
Houses without a mortgage: 9
Median household income for houses/condos with a mortgage: $68,644
Median household income for apartments without a mortgage: $51,349
Median monthly housing costs: $765
Compare current foreclosures near Fort Madison, IA:
| Photo | Address | Area | Beds / Baths | Price | Details |
|---|---|---|---|---|---|

|
#1
Avenue K
Fort Madison, IA 52627
|
1,640 sq. feet
|
1 baths 3 beds |
$154,500
|
show details |

|
#2
Avenue B
Fort Madison, IA 52627
|
1,469 sq. feet
|
1 baths 3 beds |
$149,500
|
show details |

|
#3
Avenue M
Fort Madison, IA 52627
|
1,224 sq. feet
|
1 baths 3 beds |
show details | |

|
#4
Avenue D
Fort Madison, IA 52627
|
1,868 sq. feet
|
2 baths 3 beds |
show details | |

|
#5
Avenue D
Fort Madison, IA 52627
|
1,033 sq. feet
|
1 baths 1 beds |
show details | |

|
#6
Avenue F Apt 4
Fort Madison, IA 52627
|
- sq. feet
|
- baths - beds |
show details | |

|
#7
Avenue G
Fort Madison, IA 52627
|
- sq. feet
|
- baths - beds |
show details | |

|
#8
Country Club Ln
Fort Madison, IA 52627
|
- sq. feet
|
- baths - beds |
show details | |

|
#9
15th St
Fort Madison, IA 52627
|
- sq. feet
|
- baths - beds |
show details | |

|
#10
Avenue E
Fort Madison, IA 52627
|
- sq. feet
|
- baths - beds |
show details |
| Photo | Address | Area | Beds / Baths | Price | Details |
|---|---|---|---|---|---|

|
#11
Storms Ct
Fort Madison, IA 52627
|
- sq. feet
|
- baths - beds |
show details | |

|
#12
Avenue G
Fort Madison, IA 52627
|
- sq. feet
|
- baths - beds |
show details | |

|
#13
R Ln
Fort Madison, IA 52627
|
- sq. feet
|
- baths - beds |
show details | |

|
#14
S 10th St
Burlington, IA 52601
|
1,987 sq. feet
|
2 baths 5 beds |
show details | |

|
#15
Summer St
Burlington, IA 52601
|
1,432 sq. feet
|
1 baths 3 beds |
show details | |

|
#16
Concert St
Keokuk, IA 52632
|
1,394 sq. feet
|
1 baths 2 beds |
show details | |

|
#17
Haskell St
Burlington, IA 52601
|
1,248 sq. feet
|
1 baths 4 beds |
show details | |

|
#18
S 10th St
Burlington, IA 52601
|
- sq. feet
|
- baths - beds |
$19,900
|
show details |

|
#19
S 12th St
Burlington, IA 52601
|
816 sq. feet
|
1 baths 3 beds |
show details | |

|
#20
Remey Ave
Burlington, IA 52601
|
1,281 sq. feet
|
1 baths 2 beds |
show details |
| Photo | Address | Area | Beds / Baths | Price | Details |
|---|---|---|---|---|---|

|
#21
Skunk River Rd
Danville, IA 52623
|
1,907 sq. feet
|
1 baths 5 beds |
show details | |

|
#22
S 8th St
Burlington, IA 52601
|
1,136 sq. feet
|
1 baths 2 beds |
show details | |

|
#23
146th Ave
West Burlington, IA 52655
|
2,088 sq. feet
|
1 baths 4 beds |
show details | |

|
#24
West Ave
Burlington, IA 52601
|
1,705 sq. feet
|
1 baths 3 beds |
show details | |

|
#25
Broadway St
Hamilton, IL 62341
|
- sq. feet
|
2 baths 4 beds |
show details | |

|
#26
Monarch Dr
Burlington, IA 52601
|
2,062 sq. feet
|
2 baths 3 beds |
show details | |

|
#27
173rd Ave
Middletown, IA 52638
|
2,689 sq. feet
|
1 baths 4 beds |
show details | |

|
#28
South St
Burlington, IA 52601
|
1,264 sq. feet
|
1 baths 2 beds |
show details | |

|
#29
S 9th St
Burlington, IA 52601
|
1,963 sq. feet
|
2 baths 2 beds |
show details | |

|
#30
Agency St Apt 32
Burlington, IA 52601
|
- sq. feet
|
- baths - beds |
show details |
| Photo | Address | Area | Beds / Baths | Price | Details |
|---|---|---|---|---|---|

|
#31
S 6th St
Burlington, IA 52601
|
- sq. feet
|
- baths - beds |
show details | |

|
#32
116th St
West Burlington, IA 52655
|
- sq. feet
|
- baths - beds |
show details | |

|
#33
Sycamore St
Carthage, IL 62321
|
- sq. feet
|
- baths - beds |
show details | |

|
#34
Washington Rd, Trlr 166
West Burlington, IA 52655
|
- sq. feet
|
- baths - beds |
show details | |

|
#35
E County Road 3000
Dallas City, IL 62330
|
- sq. feet
|
- baths - beds |
show details | |

|
#36
220th Ave
Montrose, IA 52639
|
- sq. feet
|
- baths - beds |
show details | |

|
#37
S 10th St
Montrose, IA 52639
|
- sq. feet
|
- baths - beds |
show details | |

|
#38
194th Ave
Argyle, IA 52619
|
- sq. feet
|
- baths - beds |
show details | |

|
#39
227th St
Donnellson, IA 52625
|
- sq. feet
|
- baths - beds |
show details | |

|
#40
Blondeau St
Keokuk, IA 52632
|
- sq. feet
|
- baths - beds |
show details |
| Photo | Address | Area | Beds / Baths | Price | Details |
|---|---|---|---|---|---|

|
#41
Madison Ave
Burlington, IA 52601
|
- sq. feet
|
- baths - beds |
show details | |

|
Check over 1 million property listings on Foreclosure.com!
|
browse all offers | |||


 | Real Estate Sale Problem For Home In IA (12 replies) |
| Is Iowa life really that great? (127 replies) |
| Looking to move to Iowa from Ohio this Spring! Please help!! (2 replies) |
| May Be Relocating to IA (Fort Madison vs Burlington) (21 replies) |
| Looking for the perfect small town in Iowa ! (102 replies) |
| Moving back to Burlington..looking for home...Aug 09' (7 replies) |

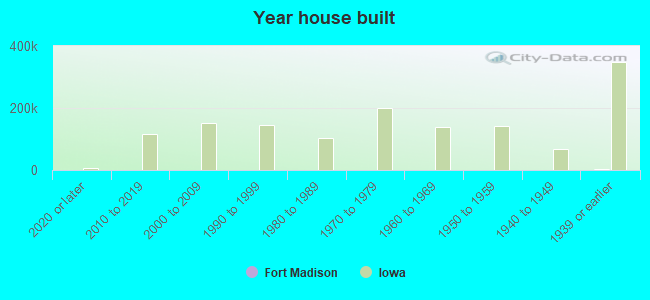
Median year apartment built: 1954
Household type by relationship:
Households: 10,330- Male householders: 2,116 (864 living alone), Female householders: 2,341 (889 living alone)
1,886 spouses (1,856 opposite-sex spouses), 377 unmarried partners, (377 opposite-sex unmarried partners), 2,538 children (2,260 natural, 103 adopted, 174 stepchildren), 49 grandchildren, 15 brothers or sisters, 73 parents, 0 foster children, 25 other relatives, 97 non-relatives
- In group quarters: 809
Size of family households: 1,301 2-persons, 409 3-persons, 600 4-persons, 207 5-persons, 2 7-or-more-persons.
Size of nonfamily households: 1,823 1-person, 217 2-persons, 18 7-or-more-persons.
1,169 married couples with children.
715 single-parent households (186 men, 529 women).
97.4% of residents of Fort Madison speak English at home.
2.4% of residents speak Spanish at home (83% speak English very well, 10% speak English well, 8% speak English not well).
0.2% of residents speak other Indo-European language at home (100% speak English very well).
0.1% of residents speak other language at home (100% speak English not well).
Foreign born population: 238 (2.3%)
(46.2% of them are naturalized citizens)
| Here: | 6.2 |
| State: | 6.8 |
| Here: | 4.2 |
| State: | 4.2 |
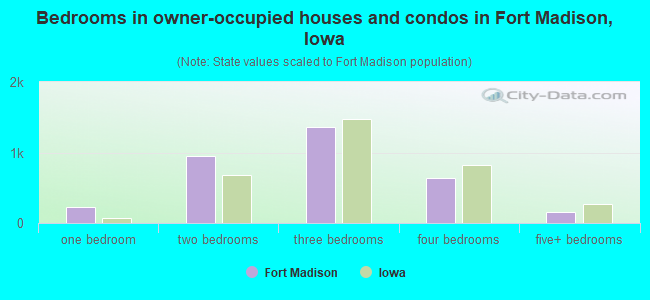
- Bedrooms in owner-occupied houses and condos in Fort Madison, Iowa
- 0no bedroom
- 2231 bedroom
- 9522 bedrooms
- 1,3633 bedrooms
- 6324 bedrooms
- 1495+ bedrooms
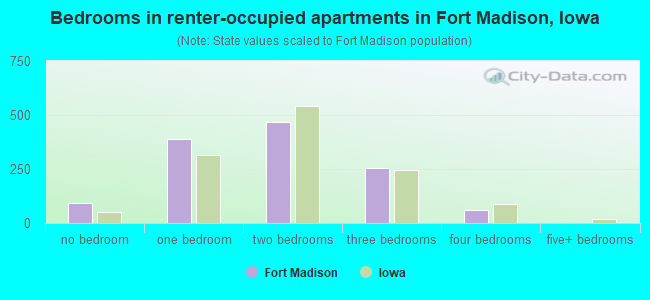
- Bedrooms in renter-occupied apartments in Fort Madison, Iowa
- 91no bedroom
- 3881 bedroom
- 4682 bedrooms
- 2553 bedrooms
- 624 bedrooms
- 05+ bedrooms
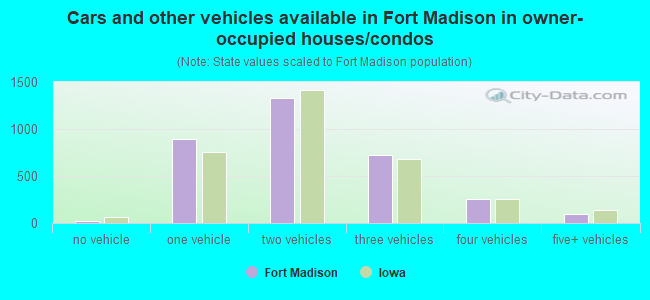
- Cars and other vehicles available in Fort Madison in owner-occupied houses/condos
- 23no vehicle
- 8921 vehicle
- 1,3322 vehicles
- 7223 vehicles
- 2544 vehicles
- 965+ vehicles
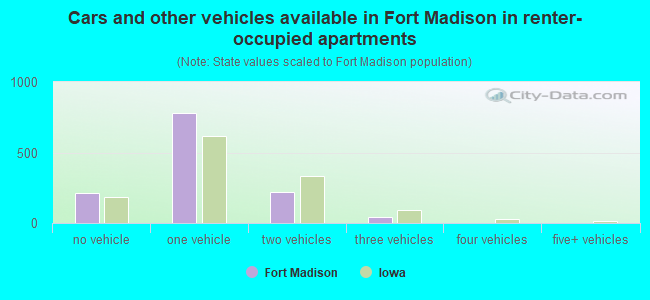
- Cars and other vehicles available in Fort Madison in renter-occupied apartments
- 214no vehicle
- 7811 vehicle
- 2232 vehicles
- 463 vehicles
- 04 vehicles
- 05+ vehicles
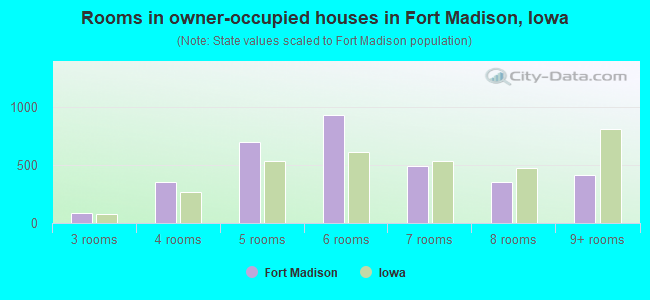
- Rooms in owner-occupied houses in Fort Madison, Iowa
- 01 room
- 42 rooms
- 833 rooms
- 3524 rooms
- 6955 rooms
- 9316 rooms
- 4907 rooms
- 3508 rooms
- 4159+ rooms
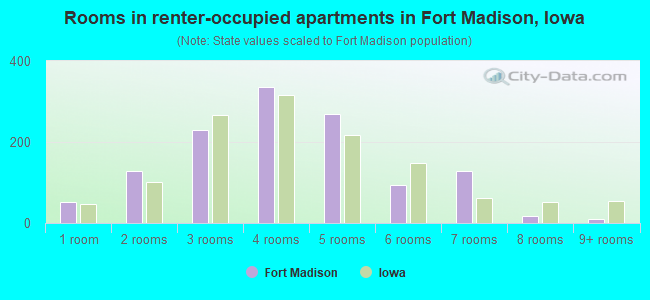
- Rooms in renter-occupied apartments in Fort Madison, Iowa
- 531 room
- 1292 rooms
- 2293 rooms
- 3374 rooms
- 2695 rooms
- 936 rooms
- 1287 rooms
- 178 rooms
- 99+ rooms
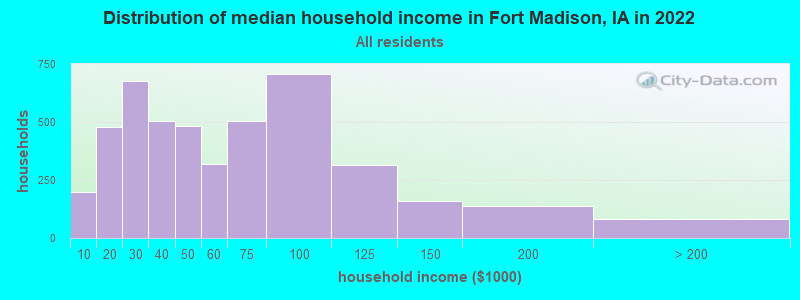
Fort Madison, IA household income distribution

- 200Less than $10,000
- 477$10,000 to $19,999
- 676$20,000 to $29,999
- 506$30,000 to $39,999
- 484$40,000 to $49,999
- 320$50,000 to $59,999
- 504$60,000 to $74,999
- 708$75,000 to $99,999
- 315$100,000 to $124,999
- 161$125,000 to $149,999
- 138$150,000 to $199,999
- 81$200,000 or more
Home value of owner - occupied houses in 2022 in Fort Madison, IA
-
- 56Less than $10,000
- 42$10,000 to $14,999
- 34$15,000 to $19,999
- 31$20,000 to $24,999
- 30$25,000 to $29,999
- 42$30,000 to $34,999
- 33$35,000 to $39,999
- 203$40,000 to $49,999
- 251$50,000 to $59,999
- 271$60,000 to $69,999
- 217$70,000 to $79,999
- 206$80,000 to $89,999
- 302$90,000 to $99,999
- 426$100,000 to $124,999
- 202$125,000 to $149,999
- 205$150,000 to $174,999
- 63$175,000 to $199,999
- 244$200,000 to $249,999
- 97$250,000 to $299,999
- 32$300,000 to $399,999
- 20$400,000 to $499,999
- 21$500,000 to $749,999
- 34$1,000,000 to $1,499,999
- 20$1,500,000 to $1,999,999
Rent paid by renters in 2022 in Fort Madison, IA
-
- 13Less than $100
- 28$100 to $149
- 17$150 to $199
- 86$250 to $299
- 35$300 to $349
- 88$350 to $399
- 102$400 to $449
- 24$450 to $499
- 73$500 to $549
- 59$550 to $599
- 180$600 to $649
- 92$650 to $699
- 32$700 to $749
- 156$800 to $899
- 39$900 to $999
- 59$1,000 to $1,249
- 39$1,250 to $1,499
- 12$3,000 to $3,499
- 20$3,500 or more
- 87No cash rent
Percentage of workers working in this county: 78.0%
Number of people working at home: 270 (5.9% of all workers)
Travel time to work (commute)
- Less than 5 minutes: 400
- 5 to 9 minutes: 737
- 10 to 14 minutes: 835
- 15 to 19 minutes: 754
- 20 to 24 minutes: 295
- 25 to 29 minutes: 190
- 30 to 34 minutes: 345
- 35 to 39 minutes: 185
- 40 to 44 minutes: 52
- 45 to 59 minutes: 260
- 60 to 89 minutes: 166
- 90 or more minutes: 60
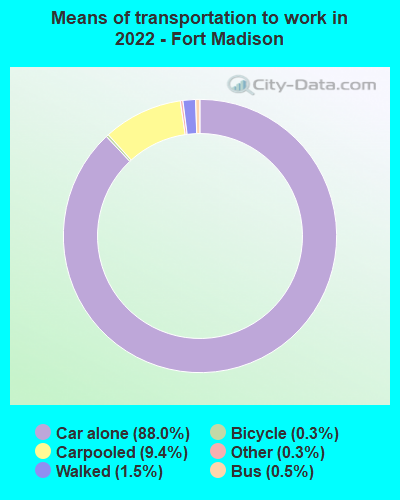
Means of transportation to work:
- Drove a car alone: 4,898 (82.5%)
- Carpooled: 552 (9.3%)
- Bus: 27 (0.5%)
- Ferryboat: 1 (0.0%)
- Taxi: 17 (0.3%)
- Bicycle: 21 (0.4%)
- Walked: 81 (1.4%)
- Worked at home: 270 (4.6%)
- Unemployment by race in 2022
- Unemployment rate for White non-Hispanic residents
- 4.1%Males
- 5.9%Females
- Unemployment rate for Black residents
- 16.6%Males
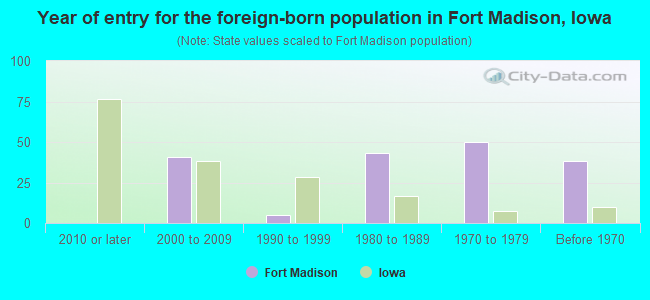
- Year of entry for the foreign-born population in Fort Madison, Iowa
- 02010 or later
- 412000 to 2009
- 51990 to 1999
- 431980 to 1989
- 501970 to 1979
- 38Before 1970
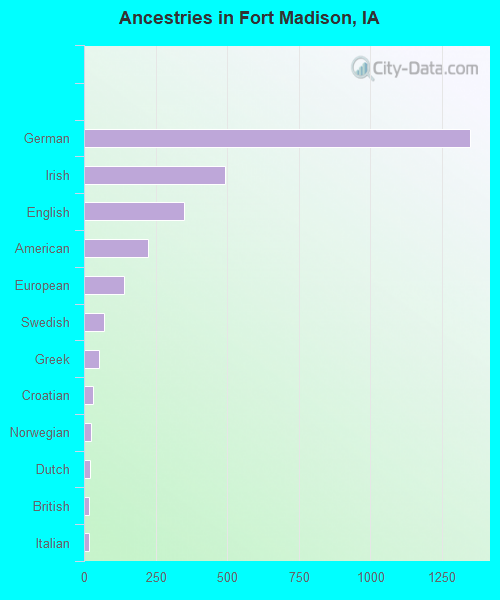
First ancestries reported:
- German: 1,347 (34.3%)
- Irish: 494 (12.6%)
- English: 349 (8.9%)
- American: 222 (5.6%)
- European: 141 (3.6%)
- Swedish: 69 (1.8%)
- Greek: 51 (1.3%)
- Croatian: 31 (0.8%)
- Norwegian: 24 (0.6%)
- Dutch: 21 (0.5%)
- British: 17 (0.4%)
- Italian: 17 (0.4%)
- Scotch-Irish: 12 (0.3%)
- Iranian: 11 (0.3%)
- Sudanese: 10 (0.3%)
- Danish: 9 (0.2%)
- Lebanese: 7 (0.2%)
- Eastern European: 7 (0.2%)
- Scottish: 7 (0.2%)
- African: 7 (0.2%)
Most common places of birth for foreign-born residents (%):
| Fort Madison: | 48.9% (111) |
| Iowa: | 23.3% (41,625) |
| Fort Madison: | 26.9% (61) |
| Iowa: | 1.4% (2,525) |
| Fort Madison: | 12.3% (28) |
| Iowa: | 2.9% (5,155) |
| Fort Madison: | 3.5% (8) |
| Iowa: | 0.3% (602) |
| Fort Madison: | 3.5% (8) |
| Iowa: | 2.3% (4,084) |
| Fort Madison: | 1.8% (4) |
| Iowa: | 0.1% (201) |
Place of birth for U.S.-born residents:
- This state: 6,970
- Other state: 3,068
- Northeast: 138
- Midwest: 1,967
- South: 584
- West: 374
91.6% of Fort Madison residents lived in the same house 1 years ago.
Out of people who lived in different houses, 36.6% lived in this county.
Out of people who lived in different counties, 53.9% lived in Iowa.
| Fort Madison: | 91.6% |
| State average: | 87.2% |
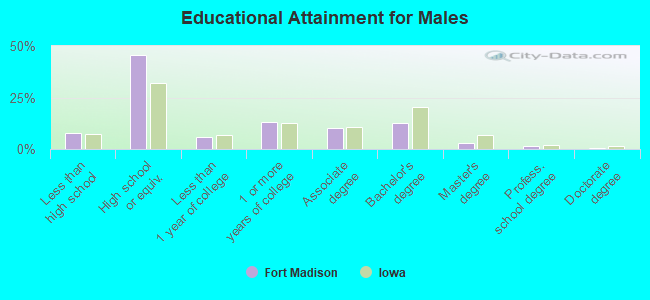
Education attainment for males 25 years and older:
- No schooling: 59
- Nursery to 4th grade: 0
- 5th and 6th grade: 4
- 7th and 8th grade: 18
- 9th grade: 23
- 10th grade: 42
- 11th grade: 28
- 12th grade, no diploma: 146
- High school graduate (or equivalency): 1,836
- Less than 1 year of college: 230
- Some college more than 1 year, no degree: 522
- Associate degree: 410
- Bachelor's degree: 508
- Master's degree: 108
- Professional school degree: 62
- Doctorate degree: 26
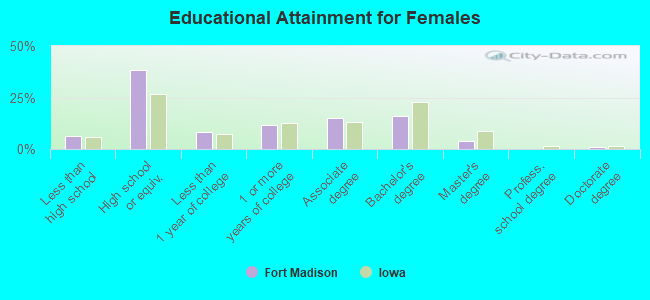
Education attainment for females 25 years and older:
- No schooling: 50
- Nursery to 4th grade: 0
- 5th and 6th grade: 0
- 7th and 8th grade: 10
- 9th grade: 18
- 10th grade: 27
- 11th grade: 38
- 12th grade, no diploma: 76
- High school graduate (or equivalency): 1,359
- Less than 1 year of college: 285
- Some college more than 1 year, no degree: 406
- Associate degree: 526
- Bachelor's degree: 564
- Master's degree: 139
- Professional school degree: 8
- Doctorate degree: 28


Housing units in structures:
- One, detached: 3,915
- One, attached: 150
- Two: 146
- 3 or 4: 304
- 5 to 9: 75
- 10 to 19: 101
- 20 to 49: 256
- 50 or more: 137
- Mobile homes: 90
Median worth of mobile homes: $11,901
Housing units lacking complete kitchen facilities in 2022: 4.3%
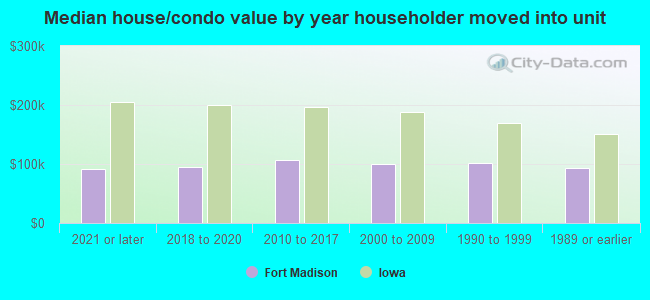
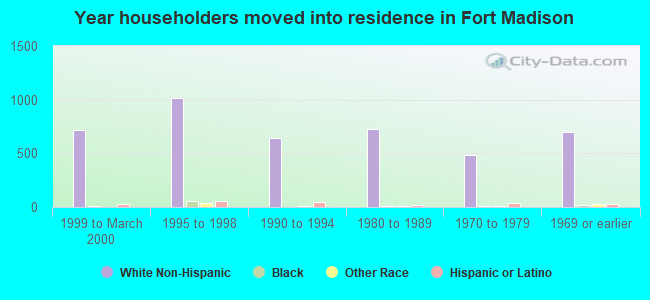
House/condo owner moved in on average 13 years ago
Renter moved in on average 6 years ago
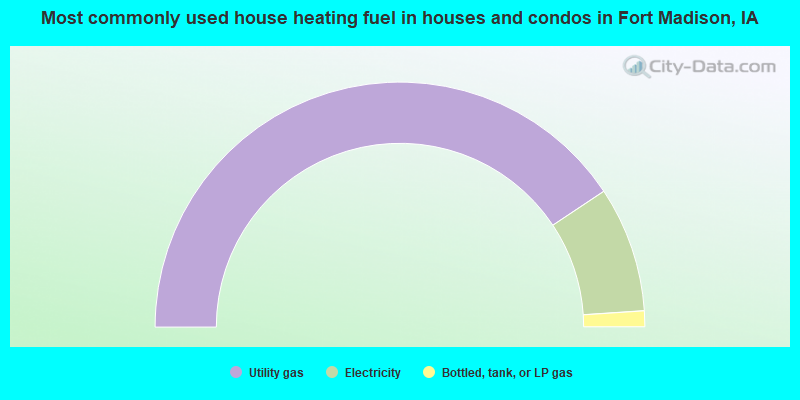
- 81.4%Utility gas
- 16.6%Electricity
- 2.1%Bottled, tank, or LP gas
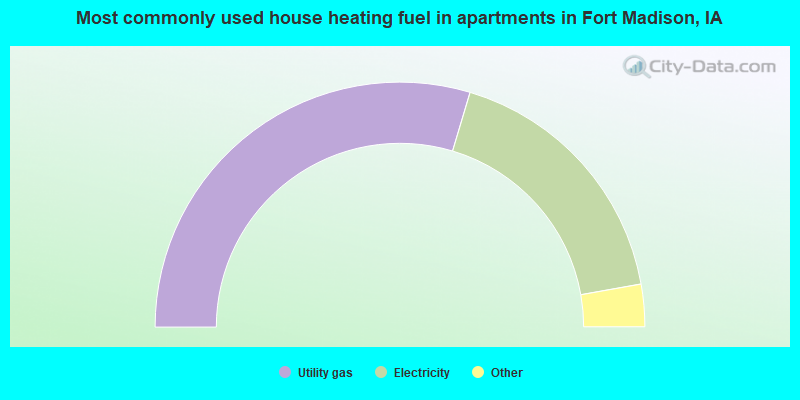
- 59.3%Utility gas
- 35.2%Electricity
- 2.2%No fuel used
- 1.6%Bottled, tank, or LP gas
- 1.0%Other fuel
- 0.7%Wood
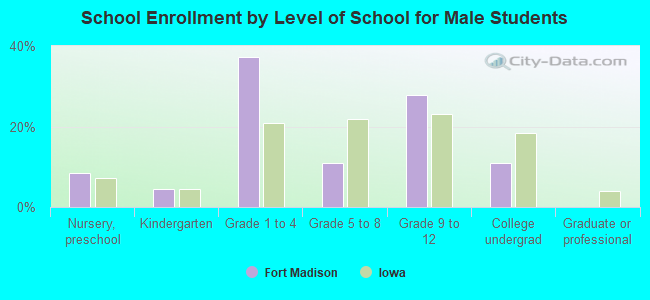
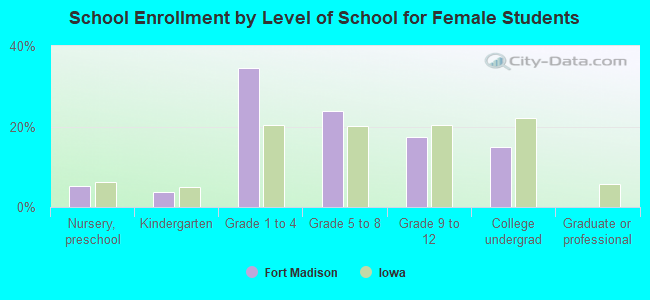
Private vs. public school enrollment:
| Here: | 10.9% |
| Iowa: | 10.6% |
| Here: | 16.3% |
| Iowa: | 7.9% |
| Here: | 20.9% |
| Iowa: | 23.9% |