Housing density: 1,608 houses/condos per square mile
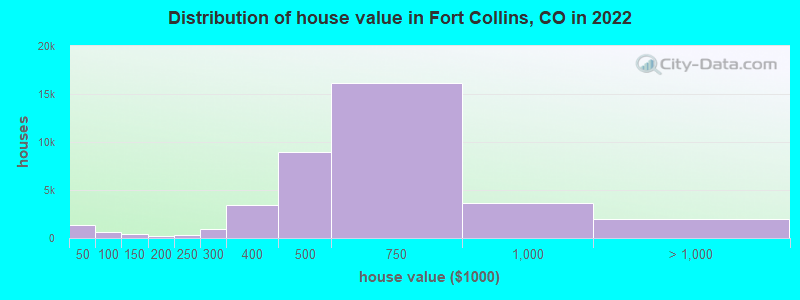
Median price asked for vacant for-sale houses and condos in 2022: $539,931.
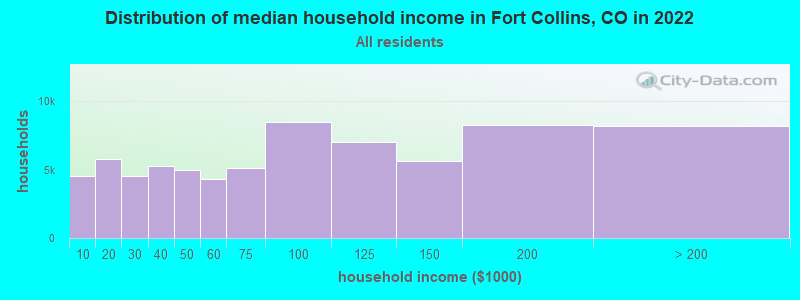
Median contract rent in 2022: $1,474 (lower quartile is $1,101, upper quartile is $1,829)
Median rent asked for vacant for-rent units in 2022: $1,343
Median gross rent in Fort Collins, CO in 2022: $1,570
Housing units in Fort Collins with a mortgage: 24,630 (2,651 second mortgage, 81 home equity loan, 2,144 both second mortgage and home equity loan) Houses without a mortgage: 523
Median household income for houses/condos with a mortgage: $142,120
Median household income for apartments without a mortgage: $86,367
20,819 married couples with children.
7,151 single-parent households (1,301 men, 5,850 women).
89.3% of residents of Fort Collins speak English at home.
5.4% of residents speak Spanish at home (79% speak English very well, 15% speak English well, 6% speak English not well).
2.8% of residents speak other Indo-European language at home (78% speak English very well, 17% speak English well, 4% speak English not well, 1% don't speak English at all).
1.7% of residents speak Asian or Pacific Island language at home (52% speak English very well, 35% speak English well, 12% speak English not well, 1% don't speak English at all).
0.6% of residents speak other language at home (47% speak English very well, 37% speak English well, 16% speak English not well).
Foreign born population: 9,633 (5.7%)
(43.8% of them are naturalized citizens)
Percentage of workers working in this county: 90.0% Number of people working at home: 18,756 (20.2% of all workers)
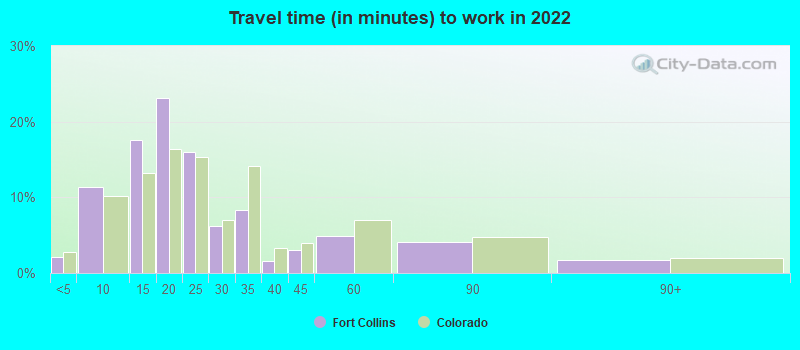
Travel time to work (commute)
Less than 5 minutes: 2,130
5 to 9 minutes: 9,521
10 to 14 minutes: 16,813
15 to 19 minutes: 18,954
20 to 24 minutes: 10,539
25 to 29 minutes: 2,505
30 to 34 minutes: 5,111
35 to 39 minutes: 726
40 to 44 minutes: 979
45 to 59 minutes: 4,022
60 to 89 minutes: 2,267
90 or more minutes: 661
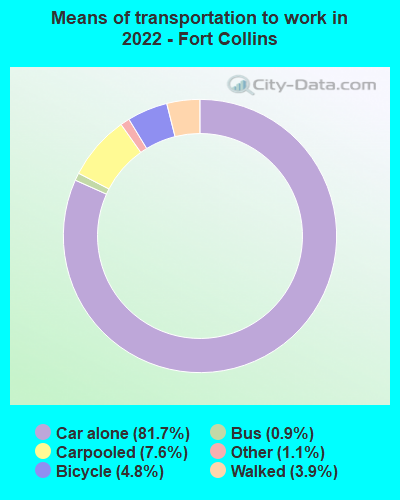
Means of transportation to work:
Drove a car alone: 72,589 (67.5%)
Carpooled: 6,737 (6.3%)
Bus: 777 (0.7%)
Taxi: 969 (0.9%)
Bicycle: 4,282 (4.0%)
Walked: 3,443 (3.2%)
Worked at home: 18,756 (17.4%)
Unemployment by race in 2022
Unemployment rate for White non-Hispanic residents
4.7%Males
3.5%Females
Unemployment rate for Black residents
1.4%Males
4.4%Females
Unemployment rate for American Indian and Alaska Native residents
28.3%Males
4.5%Females
Unemployment rate for Asian residents
2.0%Males
2.0%Females
Unemployment rate for other race residents
11.4%Males
1.3%Females
Unemployment rate for two or more race residents
7.0%Males
5.5%Females
Unemployment rate for Hispanic or Latino residents
6.4%Males
3.6%Females
Year of entry for the foreign-born population in Fort Collins, Colorado
5,4212010 or later
2,6502000 to 2009
2,4961990 to 1999
1,0171980 to 1989
5741970 to 1979
942Before 1970
First ancestries reported:
German: 11,924 (16.0%)
English: 7,673 (10.3%)
American: 4,947 (6.6%)
Irish: 4,797 (6.4%)
European: 4,712 (6.3%)
Italian: 3,110 (4.2%)
Scottish: 1,649 (2.2%)
Polish: 1,530 (2.1%)
Norwegian: 1,481 (2.0%)
French: 1,057 (1.4%)
Swedish: 950 (1.3%)
Dutch: 924 (1.2%)
Ukrainian: 810 (1.1%)
Scotch-Irish: 574 (0.8%)
British: 526 (0.7%)
Eastern European: 479 (0.6%)
Scandinavian: 472 (0.6%)
Czech: 472 (0.6%)
Northern European: 410 (0.6%)
Danish: 385 (0.5%)
Welsh: 335 (0.4%)
Brazilian: 307 (0.4%)
Swiss: 267 (0.4%)
Arab: 266 (0.4%)
Russian: 257 (0.3%)
French Canadian: 225 (0.3%)
African: 221 (0.3%)
Lithuanian: 208 (0.3%)
Greek: 195 (0.3%)
Portuguese: 189 (0.3%)
Hungarian: 187 (0.3%)
Afghan: 175 (0.2%)
Ethiopian: 167 (0.2%)
Canadian: 159 (0.2%)
Iranian: 143 (0.2%)
Austrian: 141 (0.2%)
Belgian: 117 (0.2%)
Finnish: 86 (0.1%)
Haitian: 81 (0.1%)
Armenian: 78 (0.1%)
Slovak: 75 (0.1%)
Lebanese: 73 (0.10%)
Czechoslovakian: 56 (0.08%)
Croatian: 56 (0.08%)
Australian: 52 (0.07%)
Nigerian: 43 (0.06%)
German Russian: 40 (0.05%)
Serbian: 38 (0.05%)
Slovene: 32 (0.04%)
Ghanaian: 30 (0.04%)
Egyptian: 28 (0.04%)
Pennsylvania German: 26 (0.03%)
Romanian: 26 (0.03%)
South African: 23 (0.03%)
Bulgarian: 20 (0.03%)
Latvian: 17 (0.02%)
Trinidadian and Tobagonian: 16 (0.02%)
Luxembourger: 13 (0.02%)
Slavic: 10 (0.01%)
Israeli: 10 (0.01%)
Ugandan: 8 (0.01%)
Icelander: 8 (0.01%)
Yugoslavian: 6 (0.01%)
Albanian: 5 (0.01%)
Most common places of birth for foreign-born residents (%):
Mexico
Fort Collins:
18.7% (2,303)
Colorado:
38.3% (209,491)
India
Fort Collins:
8.9% (1,092)
Colorado:
4.0% (21,689)
China, excluding Hong Kong and Taiwan
Fort Collins:
6.3% (768)
Colorado:
3.3% (17,998)
Brazil
Fort Collins:
4.4% (538)
Colorado:
1.0% (5,365)
Korea
Fort Collins:
4.3% (523)
Colorado:
2.9% (15,981)
Ukraine
Fort Collins:
3.3% (408)
Colorado:
0.8% (4,267)
Venezuela
Fort Collins:
3.1% (382)
Colorado:
0.9% (4,829)
Other Western Asia
Fort Collins:
3.0% (371)
Colorado:
0.1% (478)
France
Fort Collins:
2.9% (360)
Colorado:
0.5% (2,620)
Germany
Fort Collins:
2.8% (345)
Colorado:
2.5% (13,706)
Kuwait
Fort Collins:
2.3% (288)
Colorado:
0.1% (524)
Philippines
Fort Collins:
2.1% (258)
Colorado:
2.3% (12,342)
Iran
Fort Collins:
2.1% (255)
Colorado:
0.7% (3,568)
Canada
Fort Collins:
2.1% (255)
Colorado:
2.7% (15,026)
England
Fort Collins:
1.9% (235)
Colorado:
1.2% (6,672)
Moldova
Fort Collins:
1.9% (231)
Colorado:
0.1% (782)
Vietnam
Fort Collins:
1.7% (214)
Colorado:
3.0% (16,616)
United Kingdom, excluding England and Scotland
Fort Collins:
1.7% (206)
Colorado:
1.1% (5,799)
Place of birth for U.S.-born residents:
This state: 62,089
Other state: 95,607
Northeast: 13,123
Midwest: 32,134
South: 22,692
West: 27,658
74.8% of Fort Collins residents lived in the same house 1 years ago. Out of people who lived in different houses, 28.0% lived in this county. Out of people who lived in different counties, 40.6% lived in Colorado.
Fort Collins:
74.8%
State average:
83.6%
Education attainment for males 25 years and older:
No schooling: 413
Nursery to 4th grade: 0
5th and 6th grade: 0
7th and 8th grade: 296
9th grade: 109
10th grade: 191
11th grade: 355
12th grade, no diploma: 583
High school graduate (or equivalency): 6,376
Less than 1 year of college: 2,922
Some college more than 1 year, no degree: 6,324
Associate degree: 2,851
Bachelor's degree: 19,222
Master's degree: 8,195
Professional school degree: 1,691
Doctorate degree: 1,951
Education attainment for females 25 years and older:
No schooling: 512
Nursery to 4th grade: 0
5th and 6th grade: 0
7th and 8th grade: 0
9th grade: 237
10th grade: 95
11th grade: 101
12th grade, no diploma: 274
High school graduate (or equivalency): 6,175
Less than 1 year of college: 2,612
Some college more than 1 year, no degree: 5,374
Associate degree: 5,776
Bachelor's degree: 17,678
Master's degree: 9,877
Professional school degree: 1,536
Doctorate degree: 1,884
Housing units in structures:
One, detached: 39,996
One, attached: 6,073
Two: 2,049
3 or 4: 4,987
5 to 9: 6,674
10 to 19: 6,369
20 to 49: 2,622
50 or more: 4,821
Mobile homes: 1,229
Median worth of mobile homes: $41,422
Housing units lacking complete plumbing facilities in 2022: 0.5%
Housing units lacking complete kitchen facilities in 2022: 1.2%