Fort Benning South, GA (Georgia) Houses and Residents
| Fort Benning South: | $237,362 |
| Georgia: | $297,400 |
Total population: 10,887 (All urban)
Houses: 2,022 (1,841 occupied: 44 owner occupied, 1,797 renter occupied)
| % of renters here: | 98% |
| State: | 34% |
Housing density: 236 houses/condos per square mile
Median price asked for vacant for-sale houses and condos in 2022 in this county: $322,090.
Median contract rent in 2022: $1,503 (lower quartile is $1,879, upper quartile is $1,659)
Median rent asked for vacant for-rent units in 2022: $1,426
Median gross rent in Fort Benning South, GA in 2022: $1,487
Housing units in Fort Benning South with a mortgage: 0 (0 second mortgage, 0 home equity loan, 0 both second mortgage and home equity loan)
Houses without a mortgage: 14
Compare current foreclosures near Fort Benning South, GA:
| Photo | Address | Area | Beds / Baths | Price | Details |
|---|---|---|---|---|---|

|
#1
8th St
Columbus, GA 31906
|
1,257 sq. feet
|
2 baths 3 beds |
$170,000
|
show details |

|
#2
Desoto Dr
Columbus, GA 31909
|
1,092 sq. feet
|
1 baths 3 beds |
$185,000
|
show details |

|
#3
Walker St
Columbus, GA 31903
|
1,288 sq. feet
|
1 baths 3 beds |
$140,000
|
show details |

|
#4
Flournoy Dr
Columbus, GA 31906
|
- sq. feet
|
2 baths 3 beds |
$124,900
|
show details |

|
#5
4th Ave
Phenix City, AL 36867
|
1,416 sq. feet
|
1 baths 3 beds |
show details | |

|
#6
Eagle Pointe Dr
Columbus, GA 31907
|
1,342 sq. feet
|
2 baths 3 beds |
show details | |

|
#7
Vineyard Dr
Phenix City, AL 36869
|
1,440 sq. feet
|
2 baths 3 beds |
show details | |

|
#8
Ellen Ave
Columbus, GA 31903
|
2,625 sq. feet
|
3 baths 5 beds |
show details | |

|
#9
Shadow Wood Ln
Smiths Station, AL 36877
|
2,243 sq. feet
|
2 baths 4 beds |
show details | |

|
#10
Gardiner Dr
Columbus, GA 31907
|
- sq. feet
|
1 baths 3 beds |
show details |
| Photo | Address | Area | Beds / Baths | Price | Details |
|---|---|---|---|---|---|

|
#11
24th St
Phenix City, AL 36867
|
1,250 sq. feet
|
2 baths 2 beds |
show details | |

|
#12
Summerville Rd
Phenix City, AL 36867
|
2,843 sq. feet
|
2 baths 4 beds |
show details | |

|
#13
Burnside Dr
Columbus, GA 31907
|
2,009 sq. feet
|
2 baths 4 beds |
show details | |

|
#14
Winifred Ln
Columbus, GA 31907
|
- sq. feet
|
2 baths 3 beds |
show details | |

|
#15
Glacier Dr
Columbus, GA 31907
|
- sq. feet
|
3 baths 4 beds |
show details | |

|
#16
Honeysuckle Way
Fort Mitchell, AL 36856
|
1,884 sq. feet
|
2 baths - beds |
show details | |

|
#17
Forrest Rd
Columbus, GA 31907
|
- sq. feet
|
2 baths 3 beds |
show details | |

|
#18
Georgia Dr
Columbus, GA 31907
|
- sq. feet
|
2 baths 3 beds |
show details | |

|
#19
Liberty Hill Rd
Cusseta, GA 31805
|
2,128 sq. feet
|
2 baths 1 beds |
show details | |

|
#20
Easy St
Seale, AL 36875
|
2,919 sq. feet
|
3 baths - beds |
show details |
| Photo | Address | Area | Beds / Baths | Price | Details |
|---|---|---|---|---|---|

|
#21
Gennings Ct
Columbus, GA 31907
|
- sq. feet
|
2 baths 3 beds |
show details | |

|
#22
Lee Road 954
Smiths Station, AL 36877
|
1,913 sq. feet
|
1 baths - beds |
show details | |

|
#23
Lee Road 412
Phenix City, AL 36870
|
1,144 sq. feet
|
1 baths - beds |
show details | |

|
#24
Oakwood Dr
Phenix City, AL 36870
|
2,871 sq. feet
|
2 baths - beds |
show details | |

|
#25
Lee Road 219
Phenix City, AL 36870
|
1,200 sq. feet
|
1 baths - beds |
show details | |

|
#26
Lee Road 197
Phenix City, AL 36870
|
1,259 sq. feet
|
1 baths - beds |
show details | |

|
#27
Lee Road 979
Phenix City, AL 36870
|
1,128 sq. feet
|
1 baths - beds |
show details | |

|
#28
Lee Road 501
Phenix City, AL 36870
|
1,362 sq. feet
|
1 baths - beds |
show details | |

|
#29
Lee Road 2170
Phenix City, AL 36870
|
1,756 sq. feet
|
1 baths - beds |
show details | |

|
#30
Hawthorne Ln
Phenix City, AL 36867
|
1,813 sq. feet
|
1 baths - beds |
show details |
| Photo | Address | Area | Beds / Baths | Price | Details |
|---|---|---|---|---|---|

|
#31
Lee Road 2083
Phenix City, AL 36870
|
2,358 sq. feet
|
1 baths - beds |
show details | |

|
#32
Lee Road 2105
Phenix City, AL 36870
|
1,548 sq. feet
|
1 baths - beds |
show details | |

|
#33
Lee Road 222
Smiths Station, AL 36877
|
1,328 sq. feet
|
1 baths - beds |
show details | |

|
#34
Lee Road 240
Phenix City, AL 36870
|
1,430 sq. feet
|
1 baths - beds |
show details | |

|
#35
Lee Rd 222
Smiths Station, AL 36877
|
1,328 sq. feet
|
1 baths - beds |
show details | |

|
#36
Lee Road 436
Phenix City, AL 36870
|
2,226 sq. feet
|
1 baths - beds |
show details | |

|
#37
Lee Road 102
Smiths Station, AL 36877
|
1,312 sq. feet
|
1 baths - beds |
show details | |

|
#38
Goodwin Ave
Phenix City, AL 36867
|
1,414 sq. feet
|
1 baths - beds |
show details | |

|
#39
Lee Road 2105
Phenix City, AL 36870
|
1,462 sq. feet
|
1 baths - beds |
show details | |

|
#40
Lee Road 450
Phenix City, AL 36870
|
1,507 sq. feet
|
1 baths - beds |
show details |
| Photo | Address | Area | Beds / Baths | Price | Details |
|---|---|---|---|---|---|

|
#41
Lee Road 102
Smiths Station, AL 36877
|
1,420 sq. feet
|
1 baths - beds |
show details | |

|
#42
Lee Road 917
Phenix City, AL 36870
|
1,328 sq. feet
|
1 baths - beds |
show details | |

|
#43
Lee Rd 235
Smiths Station, AL 36877
|
1,591 sq. feet
|
1 baths - beds |
show details | |

|
#44
Lee Road 239
Smiths Station, AL 36877
|
1,584 sq. feet
|
1 baths - beds |
show details | |

|
#45
Lee Road 2080
Phenix City, AL 36870
|
1,590 sq. feet
|
1 baths - beds |
show details | |

|
#46
Alpha Dr
Phenix City, AL 36867
|
1,590 sq. feet
|
1 baths - beds |
show details | |

|
#47
Lee Road 2105
Phenix City, AL 36870
|
1,376 sq. feet
|
1 baths - beds |
show details | |

|
#48
Lee Road 2076
Phenix City, AL 36870
|
1,685 sq. feet
|
1 baths - beds |
show details | |

|
#49
Lee Road 412
Phenix City, AL 36870
|
1,149 sq. feet
|
1 baths - beds |
show details | |

|
Check over 1 million property listings on Foreclosure.com!
|
browse all offers | |||


Household type by relationship:
Households: 8,000- In family households: 7,233 (1,411 male householders, 656 female householders)
1,532 spouses, 3,158 children (2,812 natural, 68 adopted, 278 stepchildren), 159 grandchildren, 55 brothers or sisters, 45 parents, foster children, 78 other relatives, 99 non-relatives
- In nonfamily households: 767 (354 male householders (271 living alone)), 265 female householders (241 living alone)), 148 nonrelatives
- In group quarters: 3,267 (0 institutionalized population)
3,494 married couples with children.
562 single-parent households (122 men, 440 women).
83.6% of residents of Fort Benning South speak English at home.
10.2% of residents speak Spanish at home (77% speak English very well, 18% speak English well, 6% speak English not well).
3.8% of residents speak other Indo-European language at home (78% speak English very well, 20% speak English well, 2% speak English not well).
1.9% of residents speak Asian or Pacific Island language at home (70% speak English very well, 30% speak English well).
0.4% of residents speak other language at home (85% speak English very well, 15% speak English well).
Foreign born population: 1,621 (10.1%)
(70.2% of them are naturalized citizens)
| Here: | 4.7 |
| State: | 6.8 |
| Here: | 6.8 |
| State: | 4.6 |

- Bedrooms in owner-occupied houses and condos in Fort Benning South, Georgia
- 0no bedroom
- 171 bedroom
- 62 bedrooms
- 83 bedrooms
- 134 bedrooms
- 05+ bedrooms

- Bedrooms in renter-occupied apartments in Fort Benning South, Georgia
- 0no bedroom
- 591 bedroom
- 2632 bedrooms
- 4963 bedrooms
- 9544 bedrooms
- 255+ bedrooms

- Cars and other vehicles available in Fort Benning South in owner-occupied houses/condos
- 8no vehicle
- 151 vehicle
- 142 vehicles
- 73 vehicles
- 04 vehicles
- 05+ vehicles

- Cars and other vehicles available in Fort Benning South in renter-occupied apartments
- 28no vehicle
- 4451 vehicle
- 1,1472 vehicles
- 1503 vehicles
- 214 vehicles
- 65+ vehicles

- Rooms in owner-occupied houses in Fort Benning South, Georgia
- 01 room
- 02 rooms
- 173 rooms
- 64 rooms
- 85 rooms
- 76 rooms
- 67 rooms
- 08 rooms
- 09+ rooms

- Rooms in renter-occupied apartments in Fort Benning South, Georgia
- 01 room
- 372 rooms
- 643 rooms
- 2014 rooms
- 2615 rooms
- 6456 rooms
- 3877 rooms
- 608 rooms
- 1429+ rooms


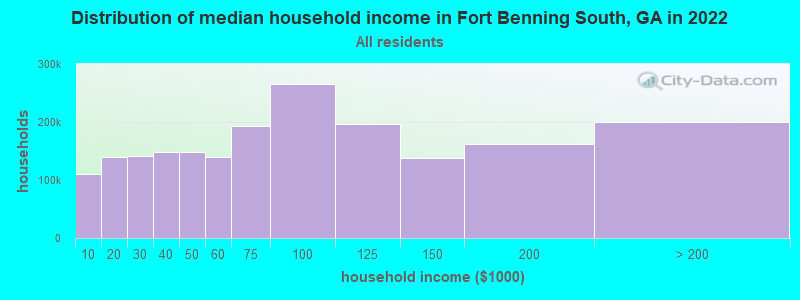
Fort Benning South, GA household income distribution

- 163,587Less than $10,000
- 186,998$10,000 to $19,999
- 193,892$20,000 to $29,999
- 207,998$30,000 to $39,999
- 209,830$40,000 to $49,999
- 197,271$50,000 to $59,999
- 279,028$60,000 to $74,999
- 373,138$75,000 to $99,999
- 280,777$100,000 to $124,999
- 198,711$125,000 to $149,999
- 240,524$150,000 to $199,999
- 319,769$200,000 or more
Percentage of workers working in this county: 74.3%
Number of people working at home: 1,815 (18.2% of all workers)
Travel time to work (commute)
- Less than 5 minutes: 1,332
- 5 to 9 minutes: 1,791
- 10 to 14 minutes: 1,439
- 15 to 19 minutes: 931
- 20 to 24 minutes: 486
- 25 to 29 minutes: 217
- 30 to 34 minutes: 205
- 35 to 39 minutes: 13
- 40 to 44 minutes: 0
- 45 to 59 minutes: 46
- 60 to 89 minutes: 41
- 90 or more minutes: 94
Means of transportation to work:
- Drove a car alone: 3,410 (48.6%)
- Carpooled: 933 (13.3%)
- Bus or trolley bus: 45 (0.6%)
- Motorcycle: 25 (0.4%)
- Bicycle: 17 (0.2%)
- Walked: 1,977 (28.2%)
- Other means: 188 (2.7%)
- Worked at home: 421 (6.0%)


- Year of entry for the foreign-born population in Fort Benning South, Georgia
- 2461995 to March 2000
- 2071990 to 1994
- 1591985 to 1989
- 1081980 to 1984
- 501975 to 1979
- 141970 to 1974
- 111965 to 1969
- 11Before 1965
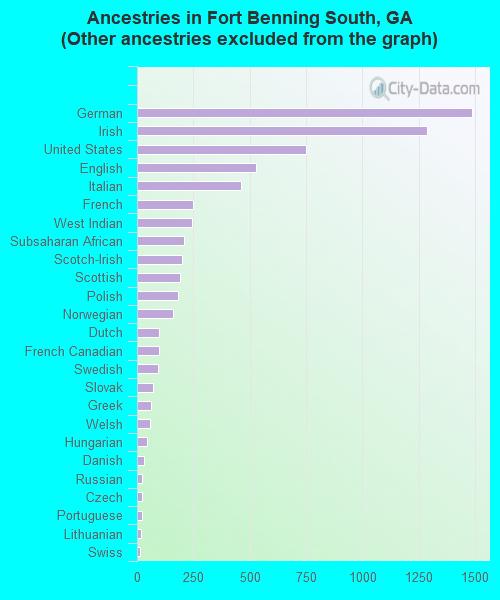
First ancestries reported:
- Other: 5,741 (46.5%)
- German: 1,488 (12.1%)
- Irish: 1,289 (10.4%)
- United States: 750 (6.1%)
- English: 530 (4.3%)
- Italian: 460 (3.7%)
- French: 250 (2.0%)
- West Indian: 244 (2.0%)
- Subsaharan African: 210 (1.7%)
- Scotch-Irish: 199 (1.6%)
- Scottish: 192 (1.6%)
- Polish: 180 (1.5%)
- Norwegian: 158 (1.3%)
- Dutch: 97 (0.8%)
- French Canadian: 97 (0.8%)
- Swedish: 91 (0.7%)
- Slovak: 73 (0.6%)
- Greek: 64 (0.5%)
- Welsh: 56 (0.5%)
- Hungarian: 46 (0.4%)
- Danish: 30 (0.2%)
- Russian: 23 (0.2%)
- Czech: 22 (0.2%)
- Portuguese: 20 (0.2%)
- Lithuanian: 18 (0.1%)
- Swiss: 14 (0.1%)
Most common places of birth for foreign-born residents (%):
| Fort Benning South: | 16.6% (134) |
| Georgia: | 3.3% (19,039) |
| Fort Benning South: | 9.8% (79) |
| Georgia: | 1.5% (8,832) |
| Fort Benning South: | 6.9% (56) |
| Georgia: | 4.0% (23,188) |
| Fort Benning South: | 6.7% (54) |
| Georgia: | 2.6% (15,057) |
| Fort Benning South: | 6.7% (54) |
| Georgia: | 1.7% (10,099) |
| Fort Benning South: | 6.5% (52) |
| Georgia: | 33.0% (190,621) |
| Fort Benning South: | 5.5% (44) |
| Georgia: | 1.8% (10,584) |
| Fort Benning South: | 4.5% (36) |
| Georgia: | 0.7% (4,103) |
| Fort Benning South: | 4.3% (35) |
| Georgia: | 0.2% (1,346) |
| Fort Benning South: | 4.2% (34) |
| Georgia: | 0.8% (4,626) |
| Fort Benning South: | 3.7% (30) |
| Georgia: | 0.5% (2,845) |
| Fort Benning South: | 3.3% (27) |
| Georgia: | 2.9% (16,457) |
| Fort Benning South: | 2.7% (22) |
| Georgia: | 0.7% (4,299) |
| Fort Benning South: | 2.0% (16) |
| Georgia: | 0.5% (2,611) |
| Fort Benning South: | 1.7% (14) |
| Georgia: | 1.5% (8,740) |
| Fort Benning South: | 1.6% (13) |
| Georgia: | 1.1% (6,408) |
| Fort Benning South: | 1.6% (13) |
| Georgia: | 0.9% (4,909) |
Place of birth for U.S.-born residents:
- This state: 1,154
- Other state: 8,890
- Northeast: 1,493
- Midwest: 1,643
- South: 4,076
- West: 1,678
6% of Fort Benning South residents lived in the same house 5 years ago.
Out of people who lived in different houses, 3% lived in this county.
Out of people who lived in different counties, 8% lived in Georgia.
Education attainment for males 25 years and older:
- No schooling: 0
- Nursery to 4th grade: 0
- 5th and 6th grade: 0
- 7th and 8th grade: 0
- 9th grade: 0
- 10th grade: 0
- 11th grade: 7
- 12th grade, no diploma: 37
- High school graduate (or equivalency): 431
- Less than 1 year of college: 473
- Some college more than 1 year, no degree: 599
- Associate degree: 257
- Bachelor's degree: 744
- Master's degree: 179
- Professional school degree: 58
- Doctorate degree: 6

Education attainment for females 25 years and older:
- No schooling: 0
- Nursery to 4th grade: 0
- 5th and 6th grade: 4
- 7th and 8th grade: 15
- 9th grade: 0
- 10th grade: 18
- 11th grade: 43
- 12th grade, no diploma: 29
- High school graduate (or equivalency): 379
- Less than 1 year of college: 199
- Some college more than 1 year, no degree: 402
- Associate degree: 198
- Bachelor's degree: 299
- Master's degree: 95
- Professional school degree: 10
- Doctorate degree: 0


Housing units in structures:
- One, detached: 353
- One, attached: 960
- Two: 180
- 3 or 4: 355
- 5 to 9: 168
- Mobile homes: 6
Housing units lacking complete kitchen facilities: 0.5%

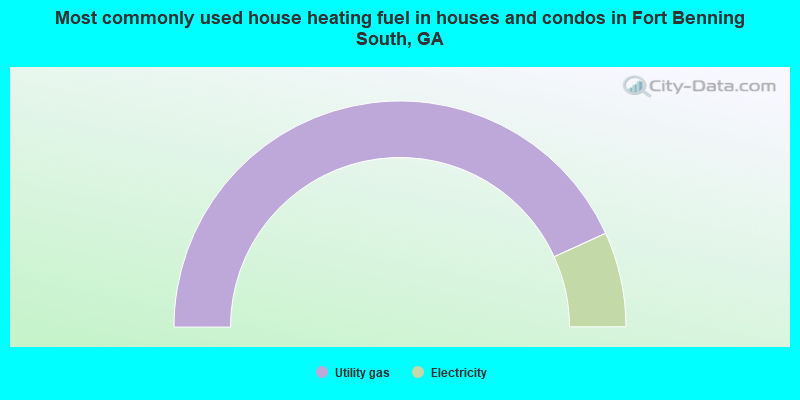
- 86.4%Utility gas
- 13.6%Electricity
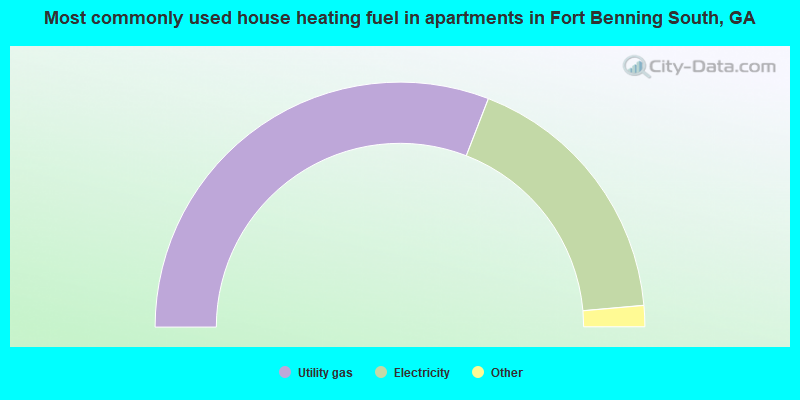
- 61.7%Utility gas
- 35.4%Electricity
- 1.5%Bottled, tank, or LP gas
- 1.0%Other fuel
- 0.3%No fuel used
Private vs. public school enrollment:
| Here: | 4.9% |
| Georgia: | 8.4% |
| Here: | 3.7% |
| Georgia: | 8.5% |
| Here: | 16.9% |
| Georgia: | 22.9% |


