Flossmoor, IL (Illinois) Houses and Residents
| Flossmoor: | $301,092 |
| Illinois: | $251,600 |
Mean price in 2022:
Detached houses: $334,695
Here: $334,695 State: $310,164 Townhouses or other attached units: $219,932
Here: $219,932 State: $286,230 In 3-to-4-unit structures: $278,509
Here: $278,509 State: $330,907 In 5-or-more-unit structures: $97,331
Here: $97,331 State: $318,887
Total population: 9,522 (Urban population: 9,295, Rural population: 0)
Houses: 3,556 (3,475 occupied: 3,374 owner occupied, 160 renter occupied)
| % of renters here: | 5% |
| State: | 33% |
Housing density: 1,001 houses/condos per square mile
Median price asked for vacant for-sale houses and condos in 2022: $856,602.
Median contract rent in 2022: $1,782
Median gross rent in Flossmoor, IL in 2022: over $2,000
Housing units in Flossmoor with a mortgage: 2,559 (196 second mortgage, 0 home equity loan, 130 both second mortgage and home equity loan)
Houses without a mortgage: 14
Median household income for houses/condos with a mortgage: $138,495
Median household income for apartments without a mortgage: $131,519
Median monthly housing costs: $2,241
Compare current foreclosures in Flossmoor, IL:
| Photo | Address | Area | Beds / Baths | Price | Details |
|---|---|---|---|---|---|

|
#1
Polly Ln
Flossmoor, IL 60422
|
2,827 sq. feet
|
2 baths 5 beds |
show details | |

|
#2
Elm Ct
Flossmoor, IL 60422
|
1,471 sq. feet
|
2 baths 4 beds |
show details | |

|
#3
Antholl St
Flossmoor, IL 60422
|
4,131 sq. feet
|
4 baths 4 beds |
show details | |

|
#4
Princeton Rd
Flossmoor, IL 60422
|
- sq. feet
|
- baths - beds |
$372,300
|
show details |

|
#5
Macfarlane Cres
Flossmoor, IL 60422
|
2,546 sq. feet
|
2 baths - beds |
show details | |

|
#6
Park Pl
Flossmoor, IL 60422
|
1,824 sq. feet
|
1 baths - beds |
show details | |

|
#7
Heather Rd
Flossmoor, IL 60422
|
1,904 sq. feet
|
2 baths - beds |
show details | |

|
#8
Central Park Ave
Flossmoor, IL 60422
|
2,555 sq. feet
|
2 baths - beds |
show details | |

|
#9
Harolds Cres
Flossmoor, IL 60422
|
2,605 sq. feet
|
2 baths - beds |
show details | |

|
#10
Selkirk St
Flossmoor, IL 60422
|
4,156 sq. feet
|
3 baths - beds |
show details |
| Photo | Address | Area | Beds / Baths | Price | Details |
|---|---|---|---|---|---|

|
#11
196th St
Flossmoor, IL 60422
|
924 sq. feet
|
1 baths - beds |
show details | |

|
#12
Oakmont Ave
Flossmoor, IL 60422
|
1,569 sq. feet
|
2 baths - beds |
show details | |

|
#13
Dundee Ave
Flossmoor, IL 60422
|
1,467 sq. feet
|
1 baths - beds |
show details | |

|
#14
Pembrook Ct
Flossmoor, IL 60422
|
3,158 sq. feet
|
3 baths - beds |
show details | |

|
#15
Cooley Pl
Flossmoor, IL 60422
|
2,688 sq. feet
|
2 baths - beds |
show details | |

|
#16
Perth Ave
Flossmoor, IL 60422
|
1,811 sq. feet
|
1 baths - beds |
show details | |

|
#17
Central Park Ave
Flossmoor, IL 60422
|
3,731 sq. feet
|
2 baths - beds |
show details | |

|
#18
Park Dr
Flossmoor, IL 60422
|
1,680 sq. feet
|
2 baths - beds |
show details | |

|
#19
Travers Ln
Flossmoor, IL 60422
|
2,693 sq. feet
|
3 baths - beds |
show details | |

|
#20
Braemar Rd
Flossmoor, IL 60422
|
1,499 sq. feet
|
1 baths - beds |
show details |
| Photo | Address | Area | Beds / Baths | Price | Details |
|---|---|---|---|---|---|

|
#21
Richards Ct
Flossmoor, IL 60422
|
4,152 sq. feet
|
2 baths - beds |
show details | |

|
#22
Hamlin Ave
Flossmoor, IL 60422
|
2,010 sq. feet
|
2 baths - beds |
show details | |

|
#23
Central Park Ave
Flossmoor, IL 60422
|
1,592 sq. feet
|
1 baths - beds |
show details | |

|
#24
198th St
Flossmoor, IL 60422
|
3,436 sq. feet
|
2 baths - beds |
show details | |

|
#25
Maple Rd
Flossmoor, IL 60422
|
1,740 sq. feet
|
2 baths - beds |
show details | |

|
#26
Sterling Ave
Flossmoor, IL 60422
|
1,721 sq. feet
|
2 baths - beds |
show details | |

|
#27
Kathleen Ln
Flossmoor, IL 60422
|
2,430 sq. feet
|
2 baths - beds |
show details | |

|
#28
Heather Hill Cres
Flossmoor, IL 60422
|
1,921 sq. feet
|
2 baths - beds |
show details | |

|
#29
Stonegate Ct
Flossmoor, IL 60422
|
1,518 sq. feet
|
3 baths - beds |
show details | |

|
#30
Tina Ln
Flossmoor, IL 60422
|
2,305 sq. feet
|
2 baths - beds |
show details |
| Photo | Address | Area | Beds / Baths | Price | Details |
|---|---|---|---|---|---|

|
#31
Lawrence Cres
Flossmoor, IL 60422
|
1,554 sq. feet
|
2 baths - beds |
show details | |

|
#32
Braemar Rd # Unit2a
Flossmoor, IL 60422
|
1,481 sq. feet
|
2 baths - beds |
show details | |

|
#33
Cambridge Ave
Flossmoor, IL 60422
|
2,474 sq. feet
|
2 baths - beds |
show details | |

|
#34
Troon St
Flossmoor, IL 60422
|
4,214 sq. feet
|
3 baths - beds |
show details | |

|
#35
Vollmer Rd Unit 306
Flossmoor, IL 60422
|
- sq. feet
|
- baths - beds |
show details | |

|
#36
Flossmoor Rd
Flossmoor, IL 60422
|
- sq. feet
|
- baths - beds |
show details | |

|
#37
Heather Hill Cres
Flossmoor, IL 60422
|
- sq. feet
|
- baths - beds |
show details | |

|
#38
Heather Hill Cres
Flossmoor, IL 60422
|
- sq. feet
|
- baths - beds |
show details | |

|
#39
Hawthorne Ln Apt H
Flossmoor, IL 60422
|
- sq. feet
|
- baths - beds |
show details | |

|
#40
Vollmer Rd
Flossmoor, IL 60422
|
- sq. feet
|
- baths - beds |
show details |
| Photo | Address | Area | Beds / Baths | Price | Details |
|---|---|---|---|---|---|

|
#41
Tanglewood St
Flossmoor, IL 60422
|
- sq. feet
|
- baths - beds |
show details | |

|
#42
Candlewood Ct
Flossmoor, IL 60422
|
- sq. feet
|
- baths - beds |
show details | |

|
#43
Lawrence Cres
Flossmoor, IL 60422
|
- sq. feet
|
- baths - beds |
show details | |

|
#44
Palmer Ct
Flossmoor, IL 60422
|
- sq. feet
|
- baths - beds |
show details | |

|
#45
Leavitt Ave Apt 201
Flossmoor, IL 60422
|
- sq. feet
|
- baths - beds |
show details | |

|
#46
Central Dr
Flossmoor, IL 60422
|
- sq. feet
|
- baths - beds |
show details | |

|
#47
Elaine C 2
Flossmoor, IL 60422
|
- sq. feet
|
- baths - beds |
show details | |

|
#48
Leavitt Ave Apt 109
Flossmoor, IL 60422
|
- sq. feet
|
- baths - beds |
show details | |

|
#49
Candlewood Ct
Flossmoor, IL 60422
|
- sq. feet
|
- baths - beds |
show details | |

|
Check over 1 million property listings on Foreclosure.com!
|
browse all offers | |||

Latest news about housing in Flossmoor, IL collected exclusively by city-data.com from local newspapers, TV, and radio stations

 | Chicago Suburbs With The Most Beautiful Houses (26 replies) |
| Are stagnant home prices really a bad thing? (63 replies) |
| Apartments in nice towns like beverly, flossmoor, etc. (0 replies) |
| Why is everyone so down on Homewood/Flossmoor? (21 replies) |
| Western or NW burbs like Flossmoor (31 replies) |
| Relocating /// NYC to CHICAGO. Safe Suburban Home Commutable to Downtown. (72 replies) |

Median year apartment built: 1972
Household type by relationship:
Households: 9,196- Male householders: 1,663 (183 living alone), Female householders: 1,720 (369 living alone)
2,111 spouses (2,092 opposite-sex spouses), 312 unmarried partners, (312 opposite-sex unmarried partners), 2,965 children (2,722 natural, 146 adopted, 96 stepchildren), 28 grandchildren, 22 brothers or sisters, 155 parents, 0 foster children, 47 other relatives, 137 non-relatives
- In group quarters: 30
Size of family households: 1,118 2-persons, 793 3-persons, 525 4-persons, 174 5-persons, 33 6-persons, 10 7-or-more-persons.
Size of nonfamily households: 594 1-person, 223 2-persons, 36 3-persons.
1,265 married couples with children.
739 single-parent households (183 men, 556 women).
92.7% of residents of Flossmoor speak English at home.
1.2% of residents speak Spanish at home (73% speak English very well, 12% speak English well, 16% speak English not well).
1.6% of residents speak other Indo-European language at home (100% speak English very well).
3.5% of residents speak Asian or Pacific Island language at home (80% speak English very well, 2% speak English not well, 19% don't speak English at all).
0.3% of residents speak other language at home (100% speak English very well).
Foreign born population: 527 (5.7%)
(63.0% of them are naturalized citizens)
| Here: | 7.8 |
| State: | 6.4 |
| Here: | 9.8 |
| State: | 4.1 |

- Bedrooms in owner-occupied houses and condos in Flossmoor, Illinois
- 0no bedroom
- 461 bedroom
- 3822 bedrooms
- 1,3713 bedrooms
- 1,1144 bedrooms
- 4625+ bedrooms

- Bedrooms in renter-occupied apartments in Flossmoor, Illinois
- 0no bedroom
- 291 bedroom
- 432 bedrooms
- 463 bedrooms
- 374 bedrooms
- 65+ bedrooms

- Cars and other vehicles available in Flossmoor in owner-occupied houses/condos
- 60no vehicle
- 7141 vehicle
- 2,0332 vehicles
- 5033 vehicles
- 554 vehicles
- 105+ vehicles

- Cars and other vehicles available in Flossmoor in renter-occupied apartments
- 0no vehicle
- 1111 vehicle
- 432 vehicles
- 63 vehicles
- 04 vehicles
- 05+ vehicles

- Rooms in owner-occupied houses in Flossmoor, Illinois
- 01 room
- 02 rooms
- 273 rooms
- 564 rooms
- 3525 rooms
- 4346 rooms
- 6167 rooms
- 6058 rooms
- 1,2859+ rooms

- Rooms in renter-occupied apartments in Flossmoor, Illinois
- 01 room
- 292 rooms
- 03 rooms
- 194 rooms
- 05 rooms
- 236 rooms
- 07 rooms
- 08 rooms
- 899+ rooms


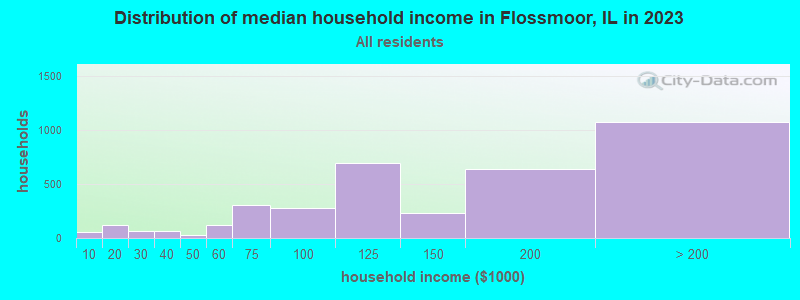
Flossmoor, IL household income distribution

- 68Less than $10,000
- 118$10,000 to $19,999
- 82$20,000 to $29,999
- 49$30,000 to $39,999
- 72$40,000 to $49,999
- 165$50,000 to $59,999
- 298$60,000 to $74,999
- 206$75,000 to $99,999
- 560$100,000 to $124,999
- 265$125,000 to $149,999
- 662$150,000 to $199,999
- 938$200,000 or more
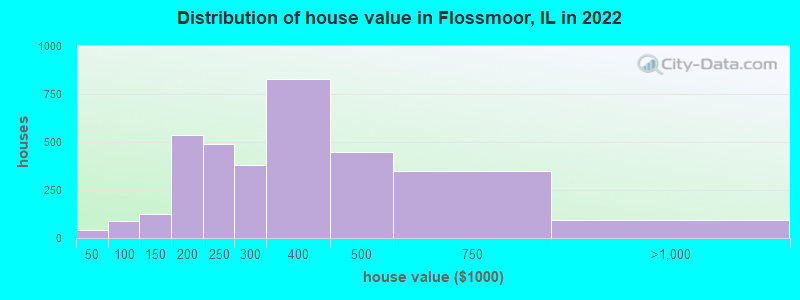
Home value of owner - occupied houses in 2022 in Flossmoor, IL
-
- 43$35,000 to $39,999
- 6$60,000 to $69,999
- 56$70,000 to $79,999
- 17$80,000 to $89,999
- 9$90,000 to $99,999
- 47$100,000 to $124,999
- 77$125,000 to $149,999
- 314$150,000 to $174,999
- 224$175,000 to $199,999
- 488$200,000 to $249,999
- 378$250,000 to $299,999
- 830$300,000 to $399,999
- 448$400,000 to $499,999
- 347$500,000 to $749,999
- 81$750,000 to $999,999
- 11$1,000,000 to $1,499,999
Rent paid by renters in 2022 in Flossmoor, IL
-
- 25$100 to $149
- 85$1,500 to $1,999
- 21$2,000 to $2,499
- 19$2,500 to $2,999
- 6No cash rent


Percentage of workers working in this county: 86.1%
Number of people working at home: 1,541 (35.6% of all workers)
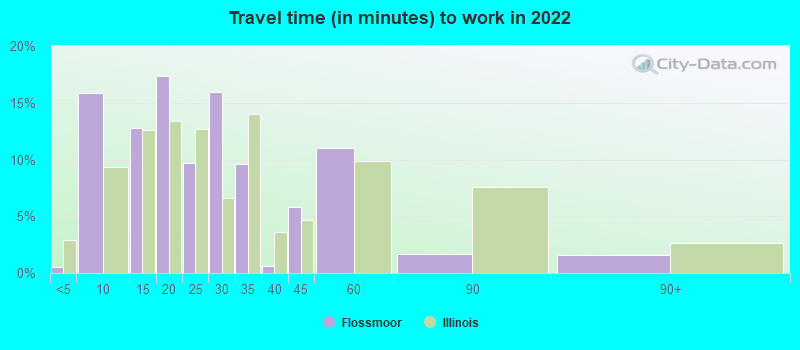
Travel time to work (commute)
- Less than 5 minutes: 8
- 5 to 9 minutes: 146
- 10 to 14 minutes: 524
- 15 to 19 minutes: 208
- 20 to 24 minutes: 212
- 25 to 29 minutes: 152
- 30 to 34 minutes: 173
- 35 to 39 minutes: 54
- 40 to 44 minutes: 154
- 45 to 59 minutes: 622
- 60 to 89 minutes: 478
- 90 or more minutes: 249
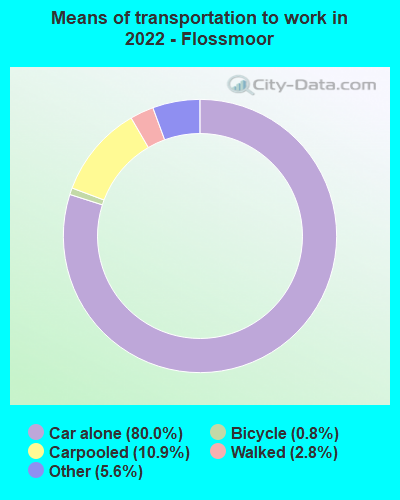
Means of transportation to work:
- Drove a car alone: 1,323 (46.7%)
- Carpooled: 192 (6.8%)
- Taxi: 93 (3.3%)
- Bicycle: 13 (0.5%)
- Walked: 48 (1.7%)
- Worked at home: 1,541 (54.3%)

- Unemployment by race in 2022
- Unemployment rate for White non-Hispanic residents
- 3.7%Males
- 1.7%Females
- Unemployment rate for Black residents
- 3.3%Males
- 17.5%Females
- Unemployment rate for two or more race residents
- 23.5%Males

- Year of entry for the foreign-born population in Flossmoor, Illinois
- 1722010 or later
- 782000 to 2009
- 901990 to 1999
- 2151980 to 1989
- 2631970 to 1979
- 295Before 1970

First ancestries reported:
- American: 522 (9.0%)
- African: 323 (5.6%)
- Turkish: 186 (3.2%)
- Italian: 164 (2.8%)
- Irish: 140 (2.4%)
- German: 130 (2.2%)
- English: 113 (2.0%)
- Kenyan: 89 (1.5%)
- Dutch: 80 (1.4%)
- Polish: 59 (1.0%)
- Trinidadian and Tobagonian: 34 (0.6%)
- Eastern European: 32 (0.6%)
- Iranian: 30 (0.5%)
- Swedish: 24 (0.4%)
- French Canadian: 23 (0.4%)
- Liberian: 23 (0.4%)
- West Indian: 20 (0.3%)
- Croatian: 19 (0.3%)
- Northern European: 16 (0.3%)
- Nigerian: 15 (0.3%)
- Haitian: 14 (0.2%)
- Lithuanian: 13 (0.2%)
- Scotch-Irish: 12 (0.2%)
- Lebanese: 10 (0.2%)
- Czech: 9 (0.2%)
- Russian: 9 (0.2%)
- British: 5 (0.09%)
- European: 4 (0.07%)
- French: 3 (0.05%)
- Jamaican: 3 (0.05%)
Most common places of birth for foreign-born residents (%):
| Flossmoor: | 45.0% (237) |
| Illinois: | 0.3% (4,823) |
| Flossmoor: | 8.0% (42) |
| Illinois: | 0.0% (615) |
| Flossmoor: | 7.4% (39) |
| Illinois: | 0.1% (1,224) |
| Flossmoor: | 7.0% (37) |
| Illinois: | 0.1% (2,269) |
| Flossmoor: | 5.7% (30) |
| Illinois: | 0.4% (6,922) |
| Flossmoor: | 4.6% (24) |
| Illinois: | 0.1% (2,017) |
| Flossmoor: | 3.4% (18) |
| Illinois: | 0.9% (15,679) |
| Flossmoor: | 3.4% (18) |
| Illinois: | 1.2% (21,186) |
| Flossmoor: | 3.2% (17) |
| Illinois: | 9.2% (166,409) |
| Flossmoor: | 2.8% (15) |
| Illinois: | 0.4% (6,611) |
| Flossmoor: | 2.5% (13) |
| Illinois: | 0.5% (9,671) |
| Flossmoor: | 2.3% (12) |
| Illinois: | 0.3% (4,533) |
| Flossmoor: | 1.9% (10) |
| Illinois: | 0.6% (10,943) |
| Flossmoor: | 1.5% (8) |
| Illinois: | 1.1% (19,306) |
Place of birth for U.S.-born residents:
- This state: 6,592
- Other state: 2,030
- Northeast: 301
- Midwest: 753
- South: 800
- West: 167
88.9% of Flossmoor residents lived in the same house 1 years ago.
Out of people who lived in different houses, 48.0% lived in this county.
Out of people who lived in different counties, 14.0% lived in Illinois.
| Flossmoor: | 88.9% |
| State average: | 88.3% |
Education attainment for males 25 years and older:
- No schooling: 57
- Nursery to 4th grade: 0
- 5th and 6th grade: 0
- 7th and 8th grade: 26
- 9th grade: 0
- 10th grade: 0
- 11th grade: 0
- 12th grade, no diploma: 10
- High school graduate (or equivalency): 299
- Less than 1 year of college: 115
- Some college more than 1 year, no degree: 576
- Associate degree: 87
- Bachelor's degree: 906
- Master's degree: 820
- Professional school degree: 165
- Doctorate degree: 106

Education attainment for females 25 years and older:
- No schooling: 8
- Nursery to 4th grade: 0
- 5th and 6th grade: 0
- 7th and 8th grade: 0
- 9th grade: 0
- 10th grade: 1
- 11th grade: 4
- 12th grade, no diploma: 0
- High school graduate (or equivalency): 293
- Less than 1 year of college: 181
- Some college more than 1 year, no degree: 411
- Associate degree: 139
- Bachelor's degree: 1,015
- Master's degree: 926
- Professional school degree: 301
- Doctorate degree: 173


Housing units in structures:
- One, detached: 3,029
- One, attached: 148
- 3 or 4: 159
- 5 to 9: 28
- 10 to 19: 30
- 20 to 49: 159
Housing units lacking complete kitchen facilities in 2022: 1.8%
House/condo owner moved in on average 13 years ago
Renter moved in on average 1 years ago

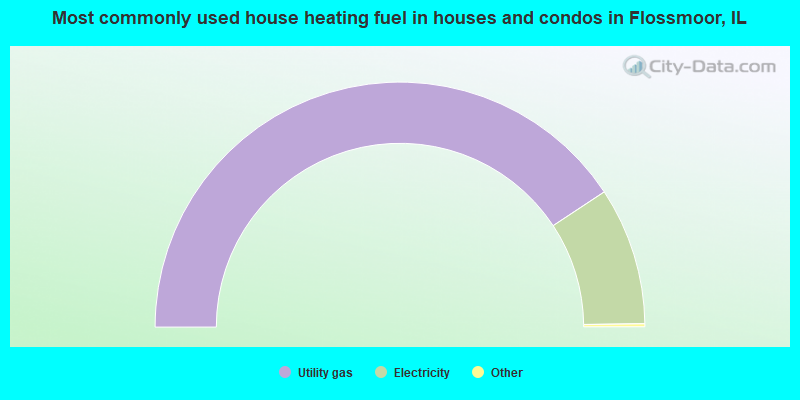
- 81.4%Utility gas
- 18.2%Electricity
- 0.2%Wood
- 0.1%Bottled, tank, or LP gas
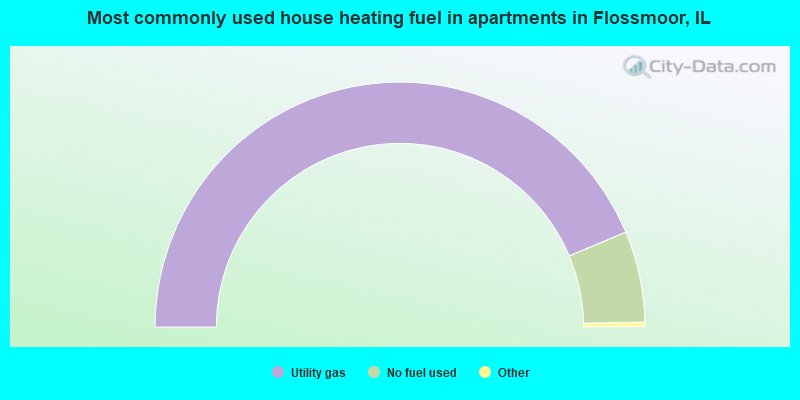
- 87.9%Utility gas
- 12.1%No fuel used
Private vs. public school enrollment:
| Here: | 20.3% |
| Illinois: | 13.3% |
| Here: | 7.0% |
| Illinois: | 9.9% |
| Here: | 6.0% |
| Illinois: | 27.4% |


