Housing density: 1,556 houses/condos per square mile
Median price asked for vacant for-sale houses and condos in 2022 in this county: $249,452.
Median contract rent in 2022: $1,194 (lower quartile is $992, upper quartile is $1,582)
Median rent asked for vacant for-rent units in 2022: $1,192
Median gross rent in Florence-Roebling, NJ in 2022: $1,320
Housing units in Florence-Roebling with a mortgage: 1,419 (145 second mortgage, 175 home equity loan, 12 both second mortgage and home equity loan) Houses without a mortgage: 655
Compare current foreclosures near Florence-Roebling, NJ:
In family households: 376,428 (82,656 male householders, 34,665 female householders)
90,328 spouses, 135,982 children (127,562 natural, 3,068 adopted, 5,352 stepchildren), 9,105 grandchildren, 3,401 brothers or sisters, 4,542 parents, foster children, 4,356 other relatives, 8,110 non-relatives
In nonfamily households: 59,092 (21,117 male householders (16,443 living alone)), 27,880 female householders (24,152 living alone)), 10,095 nonrelatives
In group quarters: 13,214 (11,614 institutionalized population)
78,429 married couples with children.
18,260 single-parent households (4,284 men, 13,976 women).
90.8% of residents of Florence-Roebling speak English at home.
1.5% of residents speak Spanish at home (44% speak English very well, 14% speak English well, 42% speak English not well).
4.7% of residents speak other Indo-European language at home (51% speak English very well, 33% speak English well, 15% speak English not well).
1.5% of residents speak Asian or Pacific Island language at home (39% speak English very well, 44% speak English well, 11% speak English not well, 6% don't speak English at all).
1.5% of residents speak other language at home (70% speak English very well, 18% speak English well, 12% speak English not well).
Foreign born population: 1,137 (12.6%)
(56.3% of them are naturalized citizens)
Year of entry for the foreign-born population in Florence-Roebling, New Jersey
1541995 to March 2000
1031990 to 1994
491985 to 1989
491980 to 1984
171975 to 1979
231970 to 1974
91965 to 1969
131Before 1965
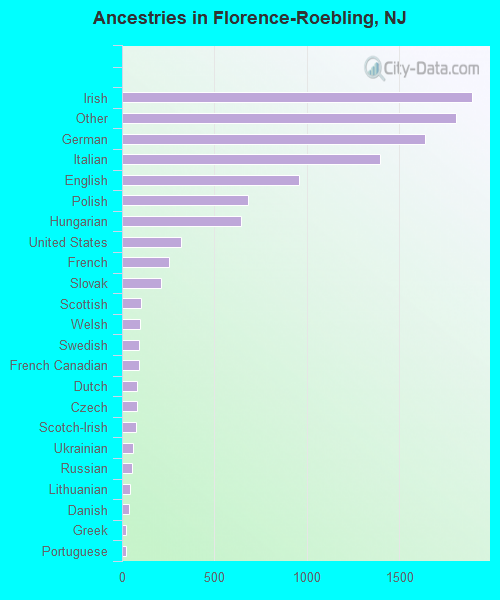
First ancestries reported:
Irish: 1,891 (17.7%)
Other: 1,807 (16.9%)
German: 1,639 (15.3%)
Italian: 1,394 (13.0%)
English: 957 (8.9%)
Polish: 683 (6.4%)
Hungarian: 646 (6.0%)
United States: 320 (3.0%)
French: 254 (2.4%)
Slovak: 213 (2.0%)
Scottish: 103 (1.0%)
Welsh: 95 (0.9%)
Swedish: 94 (0.9%)
French Canadian: 92 (0.9%)
Dutch: 83 (0.8%)
Czech: 81 (0.8%)
Scotch-Irish: 77 (0.7%)
Ukrainian: 58 (0.5%)
Russian: 56 (0.5%)
Lithuanian: 44 (0.4%)
Danish: 37 (0.3%)
Greek: 22 (0.2%)
Portuguese: 19 (0.2%)
Norwegian: 10 (0.09%)
Subsaharan African: 9 (0.08%)
Arab: 6 (0.06%)
Swiss: 6 (0.06%)
Most common places of birth for foreign-born residents (%):
India
Florence-Roebling:
17.4% (93)
New Jersey:
8.1% (119,497)
Turkey
Florence-Roebling:
14.0% (75)
New Jersey:
0.7% (9,606)
Italy
Florence-Roebling:
11.2% (60)
New Jersey:
4.0% (58,395)
Canada
Florence-Roebling:
9.3% (50)
New Jersey:
1.1% (16,333)
Pakistan
Florence-Roebling:
8.0% (43)
New Jersey:
1.1% (16,052)
Romania
Florence-Roebling:
7.9% (42)
New Jersey:
0.4% (6,115)
Hungary
Florence-Roebling:
6.4% (34)
New Jersey:
0.5% (7,426)
Hong Kong
Florence-Roebling:
4.9% (26)
New Jersey:
0.6% (8,266)
Germany
Florence-Roebling:
4.5% (24)
New Jersey:
2.3% (33,531)
United Kingdom
Florence-Roebling:
3.0% (16)
New Jersey:
2.1% (30,355)
Bangladesh
Florence-Roebling:
2.8% (15)
New Jersey:
0.4% (5,929)
Guatemala
Florence-Roebling:
2.2% (12)
New Jersey:
1.4% (20,190)
Other Eastern Europe
Florence-Roebling:
1.7% (9)
New Jersey:
1.2% (17,647)
Nigeria
Florence-Roebling:
1.7% (9)
New Jersey:
0.6% (8,389)
Place of birth for U.S.-born residents:
This state: 5,805
Other state: 1,755
Northeast: 1,112
Midwest: 147
South: 380
West: 116
67% of Florence-Roebling residents lived in the same house 5 years ago. Out of people who lived in different houses, 66% lived in this county. Out of people who lived in different counties, 45% lived in New Jersey.
Education attainment for males 25 years and older:
No schooling: 37
Nursery to 4th grade: 4
5th and 6th grade: 21
7th and 8th grade: 120
9th grade: 21
10th grade: 77
11th grade: 58
12th grade, no diploma: 64
High school graduate (or equivalency): 980
Less than 1 year of college: 261
Some college more than 1 year, no degree: 306
Associate degree: 124
Bachelor's degree: 315
Master's degree: 103
Professional school degree: 31
Doctorate degree: 0
Education attainment for females 25 years and older:
No schooling: 20
Nursery to 4th grade: 3
5th and 6th grade: 23
7th and 8th grade: 109
9th grade: 70
10th grade: 96
11th grade: 56
12th grade, no diploma: 104
High school graduate (or equivalency): 1,241
Less than 1 year of college: 268
Some college more than 1 year, no degree: 346
Associate degree: 203
Bachelor's degree: 264
Master's degree: 98
Professional school degree: 54
Doctorate degree: 0
Housing units in structures:
One, detached: 1,321
One, attached: 1,183
Two: 126
3 or 4: 221
5 to 9: 285
10 to 19: 79
20 to 49: 145
50 or more: 82
Housing units lacking complete plumbing facilities: 0.2%
Housing units lacking complete kitchen facilities: 0.3%