Ferndale, MD (Maryland) Houses and Residents
Estimated median house or condo value in 2022: $323,332 (it was $125,800 in 2000 )
Ferndale:
$323,332Maryland:
$398,100
Lower value quartile - upper value quartile: $266,418 - $382,192Mean price in 2022: Detached houses: $322,425 Here:
$322,425State:
$526,819
Townhouses or other attached units: $235,524 Here:
$235,524State:
$328,305
In 5-or-more-unit structures: $175,371 Here:
$175,371State:
$350,378
Total population: 16,746 (Urban population: 16,049, Rural population: 0)
Houses: 6,820 (6,575 occupied: 4,438 owner occupied, 2,178 renter occupied )
% of renters here:
33%State:
32%
Housing density: 1,679 houses/condos per square mile
Median price asked for vacant for-sale houses and condos in 2022 in this county: $157,543.
Median contract rent in 2022: $1,466 (lower quartile is $1,051, upper quartile is $1,753)
Median rent asked for vacant for-rent units in 2022: $1,194
Median gross rent in Ferndale, MD in 2022: $1,561
Housing units in Ferndale with a mortgage: 3,243 (316 second mortgage, 0 home equity loan, 307 both second mortgage and home equity loan )Houses without a mortgage: 88
Median household income for houses/condos with a mortgage: $87,196
Median household income for apartments without a mortgage: $58,230
Median monthly housing costs: $1,593
Data:
Median house or condo value ($)
Median house or condo value ($ change since 2000)
Median house or condo value ($) - White
Median house or condo value ($) - Black or African American
Median house or condo value ($) - Asian
Median house or condo value ($) - Hispanic or Latino
Median house or condo value ($) - American Indian and Alaska Native
Median house or condo value ($) - Multirace
Median house or condo value ($) - Other Race
Median price asked for mobile homes ($)
Household density (households per square mile)
Mean house or condo value by units in structure - 1, detached ($)
Mean house or condo value by units in structure - 1, attached ($)
Mean house or condo value by units in structure - 2 ($)
Mean house or condo value by units in structure by units in structure - 3 or 4 ($)
Mean house or condo value by units in structure - 5 or more ($)
Mean house or condo value by units in structure - Boat, RV, van, etc. ($)
Mean house or condo value by units in structure - Mobile home ($)
Median contract rent ($)
Median contract rent - Lower quartile ($)
Median contract rent - Upper quartile ($)
Median gross rent ($)
Urban houses (%)
Rural houses (%)
Houses occupied (%)
Houses occupied (% change since 2000)
Houses owner occupied (%)
Houses owner occupied (% change since 2000)
Houses renter occupied (%)
Houses renter occupied (% change since 2000)
Vacant housing units - For rent (%)
Vacant housing units - For rent (% change since 2000)
Vacant housing units - For sale only (%)
Vacant housing units - For sale only (% change since 2000)
Vacant housing units - Rented or sold, not occupied (%)
Vacant housing units - Rented or sold, not occupied (% change since 2000)
Vacant housing units - For seasonal, recreational, or occasional use (%)
Vacant housing units - For seasonal, recreational, or occasional use (% change since 2000)
Vacant housing units - For migrant workers (%)
Vacant housing units - For migrant workers (% change since 2000)
Vacant housing units - Other vacant (%)
Vacant housing units - Other vacant (% change since 2000)
Median monthly housing costs ($)
Median household income for houses/condos with a mortgage ($)
Median household income for houses/condos without a mortgage ($)
Median household income ($)
Median household income ($) - White
Median household income ($) - Black or African American
Median household income ($) - Asian
Median household income ($) - Hispanic or Latino
Median household income ($) - American Indian and Alaska Native
Median household income ($) - Multirace
Median household income ($) - Other Race
Mortgage status - with mortgage (%)
Mortgage status - with second mortgage (%)
Mortgage status - with home equity loan (%)
Mortgage status - with both second mortgage and home equity loan (%)
Mortgage status - without a mortgage (%)
Median year house/condo built
Median year apartment built
Household type by relationship - Male householder living alone (%)
Household type by relationship - Male householder not living alone (%)
Household type by relationship - Female householder living alone (%)
Household type by relationship - Female householder not living alone (%)
Household type by relationship - Opposite-Sex spouse (%)
Household type by relationship - Same-Sex spouse (%)
Household type by relationship - Opposite-Sex unmarried partner (%)
Household type by relationship - Same-Sex unmarried partner (%)
Household type by relationship - In group quarters (%)
Size of family households - 2-person household (%)
Size of family households - 3-person household (%)
Size of family households - 4-person household (%)
Size of family households - 5-person household (%)
Size of family households - 6-person household (%)
Size of family households - 7-or-more-person household (%)
Size of nonfamily households - 1-person household (%)
Size of nonfamily households - 2-person household (%)
Size of nonfamily households - 3-person household (%)
Size of nonfamily households - 4-person household (%)
Size of nonfamily households - 5-person household (%)
Size of nonfamily households - 6-person household (%)
Size of nonfamily households - 7-or-moreperson household (%)
Year house built - Built 2010 or later (%)
Year house built - Built 2000 to 2009 (%)
Year house built - Built 1990 to 1999 (%)
Year house built - Built 1980 to 1989 (%)
Year house built - Built 1970 to 1979 (%)
Year house built - Built 1960 to 1969 (%)
Year house built - Built 1950 to 1959 (%)
Year house built - Built 1940 to 1949 (%)
Year house built - Built 1939 or earlier (%)
Median number of rooms in houses and condos
Median number of rooms in apartments
Median number of bedrooms in owner occupied houses
Mean number of bedrooms in owner occupied houses
Median number of bedrooms in renter occupied houses
Mean number of bedrooms in renter occupied houses
Median number of vehichles in owner occupied houses
Mean number of vehichles in owner occupied houses
Median number of vehichles in renter occupied houses
Mean number of vehichles in renter occupied houses
Rooms in owner-occupied houses - 1 room (%)
Rooms in owner-occupied houses - 2 rooms (%)
Rooms in owner-occupied houses - 3 rooms (%)
Rooms in owner-occupied houses - 4 rooms (%)
Rooms in owner-occupied houses - 5 rooms (%)
Rooms in owner-occupied houses - 6 rooms (%)
Rooms in owner-occupied houses - 7 rooms (%)
Rooms in owner-occupied houses - 8 rooms (%)
Rooms in owner-occupied houses - 9+ rooms (%)
Rooms in renter-occupied houses - 1 room (%)
Rooms in renter-occupied houses - 2 rooms (%)
Rooms in renter-occupied houses - 3 rooms (%)
Rooms in renter-occupied houses - 4 rooms (%)
Rooms in renter-occupied houses - 5 rooms (%)
Rooms in renter-occupied houses - 6 rooms (%)
Rooms in renter-occupied houses - 7 rooms (%)
Rooms in renter-occupied houses - 8 rooms (%)
Rooms in renter-occupied houses - 9+ rooms (%)
Bedrooms in owner-occupied houses - no bedrooms (%)
Bedrooms in owner-occupied houses - 1 bedroom (%)
Bedrooms in owner-occupied houses - 2 bedrooms (%)
Bedrooms in owner-occupied houses - 3 bedrooms (%)
Bedrooms in owner-occupied houses - 4 bedrooms (%)
Bedrooms in owner-occupied houses - 5+ bedrooms (%)
Bedrooms in renter-occupied houses - no bedrooms (%)
Bedrooms in renter-occupied houses - 1 bedroom (%)
Bedrooms in renter-occupied houses - 2 bedrooms (%)
Bedrooms in renter-occupied houses - 3 bedrooms (%)
Bedrooms in renter-occupied houses - 4 bedrooms (%)
Bedrooms in renter-occupied houses - 5+ bedrooms (%)
Vehicles available in owner-occupied houses - no vehicle available (%)
Vehicles available in owner-occupied houses - 1 vehicle available(%)
Vehicles available in owner-occupied houses - 2 Vehicles available (%)
Vehicles available in owner-occupied houses - 3 Vehicles available (%)
Vehicles available in owner-occupied houses - 4 Vehicles available (%)
Vehicles available in owner-occupied houses - 5+ Vehicles available (%)
Vehicles available in renter-occupied houses - no vehicle available (%)
Vehicles available in renter-occupied houses - 1 vehicle available (%)
Vehicles available in renter-occupied houses - 2 Vehicles available (%)
Vehicles available in renter-occupied houses - 3 Vehicles available (%)
Vehicles available in renter-occupied houses - 4 Vehicles available (%)
Vehicles available in renter-occupied houses - 5+ Vehicles available (%)
Housing units in structures - 1, detached (%)
Housing units in structures - 1, attached (%)
Housing units in structures - 2 (%)
Housing units in structures - 3 or 4 (%)
Housing units in structures - 5 to 9 (%)
Housing units in structures - 10 to 19 (%)
Housing units in structures - 20 to 49 (%)
Housing units in structures - 50 or more (%)
Housing units in structures - Mobile home (%)
Housing units in structures - Boat, RV, van, etc. (%)
Housing units in structures - Owners - 1, detached (%)
Housing units in structures - Owners - 1, attached (%)
Housing units in structures - Owners - 2 (%)
Housing units in structures - Owners - 3 or 4 (%)
Housing units in structures - Owners - 5 to 9 (%)
Housing units in structures - Owners - 10 to 19 (%)
Housing units in structures - Owners - 20 to 49 (%)
Housing units in structures - Owners - 50 or more (%)
Housing units in structures - Owners - Mobile home (%)
Housing units in structures - Owners - Boat, RV, van, etc. (%)
Housing units in structures - Renters - 1, detached (%)
Housing units in structures - Renters - 1, attached (%)
Housing units in structures - Renters - 2 (%)
Housing units in structures - Renters - 3 or 4 (%)
Housing units in structures - Renters - 5 to 9 (%)
Housing units in structures - Renters - 10 to 19 (%)
Housing units in structures - Renters - 20 to 49 (%)
Housing units in structures - Renters - 50 or more (%)
Housing units in structures - Renters - Mobile home (%)
Housing units in structures - Renters - Boat, RV, van, etc. (%)
House/condo owner moved in on average (years ago)
Renter moved in on average (years ago)
Year householder moved into unit - Moved in 1999 to March 2000 (%)
Year householder moved into unit - Moved in 1999 to March 2000 (%) - White
Year householder moved into unit - Moved in 1999 to March 2000 (%) - Black or African American
Year householder moved into unit - Moved in 1999 to March 2000 (%) - Asian
Year householder moved into unit - Moved in 1999 to March 2000 (%) - Hispanic or Latino
Year householder moved into unit - Moved in 1999 to March 2000 (%) - American Indian and Alaska Native
Year householder moved into unit - Moved in 1999 to March 2000 (%) - Multirace
Year householder moved into unit - Moved in 1999 to March 2000 (%) - Other Race
Year householder moved into unit - Moved in 1995 to 1998 (%)
Year householder moved into unit - Moved in 1995 to 1998 (%) - White
Year householder moved into unit - Moved in 1995 to 1998 (%) - Black or African American
Year householder moved into unit - Moved in 1995 to 1998 (%) - Asian
Year householder moved into unit - Moved in 1995 to 1998 (%) - Hispanic or Latino
Year householder moved into unit - Moved in 1995 to 1998 (%) - American Indian and Alaska Native
Year householder moved into unit - Moved in 1995 to 1998 (%) - Multirace
Year householder moved into unit - Moved in 1995 to 1998 (%) - Other Race
Year householder moved into unit - Moved in 1990 to 1994 (%)
Year householder moved into unit - Moved in 1990 to 1994 (%) - White
Year householder moved into unit - Moved in 1990 to 1994 (%) - Black or African American
Year householder moved into unit - Moved in 1990 to 1994 (%) - Asian
Year householder moved into unit - Moved in 1990 to 1994 (%) - Hispanic or Latino
Year householder moved into unit - Moved in 1990 to 1994 (%) - American Indian and Alaska Native
Year householder moved into unit - Moved in 1990 to 1994 (%) - Multirace
Year householder moved into unit - Moved in 1990 to 1994 (%) - Other Race
Year householder moved into unit - Moved in 1980 to 1989 (%)
Year householder moved into unit - Moved in 1980 to 1989 (%) - White
Year householder moved into unit - Moved in 1980 to 1989 (%) - Black or African American
Year householder moved into unit - Moved in 1980 to 1989 (%) - Asian
Year householder moved into unit - Moved in 1980 to 1989 (%) - Hispanic or Latino
Year householder moved into unit - Moved in 1980 to 1989 (%) - American Indian and Alaska Native
Year householder moved into unit - Moved in 1980 to 1989 (%) - Multirace
Year householder moved into unit - Moved in 1980 to 1989 (%) - Other Race
Year householder moved into unit - Moved in 1970 to 1979 (%)
Year householder moved into unit - Moved in 1970 to 1979 (%) - White
Year householder moved into unit - Moved in 1970 to 1979 (%) - Black or African American
Year householder moved into unit - Moved in 1970 to 1979 (%) - Asian
Year householder moved into unit - Moved in 1970 to 1979 (%) - Hispanic or Latino
Year householder moved into unit - Moved in 1970 to 1979 (%) - American Indian and Alaska Native
Year householder moved into unit - Moved in 1970 to 1979 (%) - Multirace
Year householder moved into unit - Moved in 1970 to 1979 (%) - Other Race
Year householder moved into unit - Moved in 1969 or earlier (%)
Year householder moved into unit - Moved in 1969 or earlier (%) - White
Year householder moved into unit - Moved in 1969 or earlier (%) - Black or African American
Year householder moved into unit - Moved in 1969 or earlier (%) - Asian
Year householder moved into unit - Moved in 1969 or earlier (%) - Hispanic or Latino
Year householder moved into unit - Moved in 1969 or earlier (%) - American Indian and Alaska Native
Year householder moved into unit - Moved in 1969 or earlier (%) - Multirace
Year householder moved into unit - Moved in 1969 or earlier (%) - Other Race
Housing units lacking complete plumbing facilities (%)
Housing units lacking complete kitchen facilities (%)
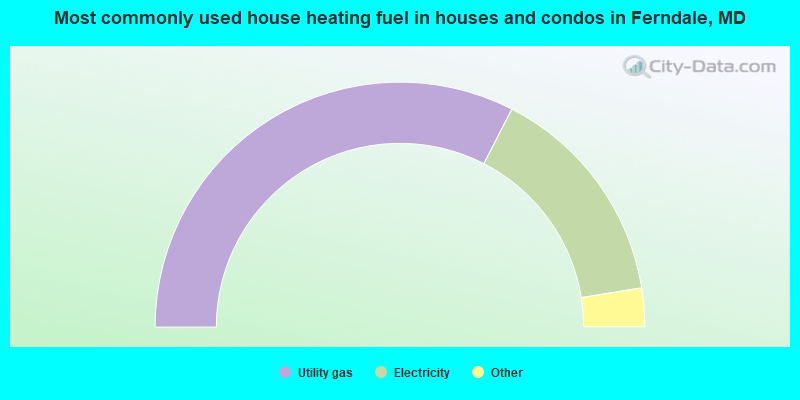
House heating fuel used in houses and condos - Utility gas (%)
House heating fuel used in houses and condos - Bottled, tank, or LP gas (%)
House heating fuel used in houses and condos - Electricity (%)
House heating fuel used in houses and condos - Fuel oil, kerosene, etc. (%)
House heating fuel used in houses and condos - Coal or coke (%)
House heating fuel used in houses and condos - Wood (%)
House heating fuel used in houses and condos - Solar energy (%)
House heating fuel used in houses and condos - Other fuel (%)
House heating fuel used in houses and condos - No fuel used (%)
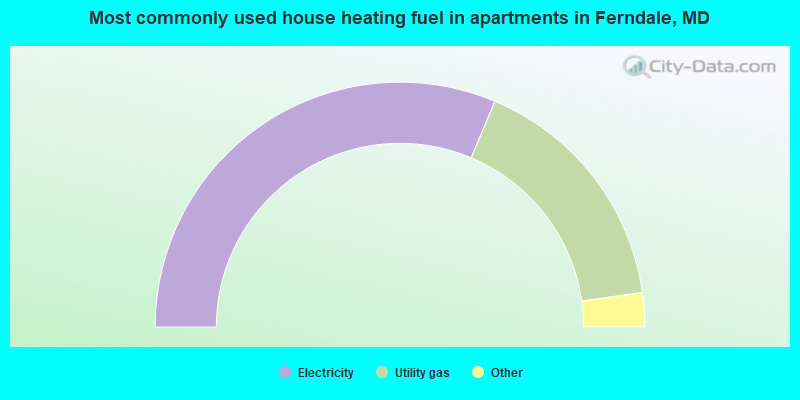
House heating fuel used in apartments - Utility gas (%)
House heating fuel used in apartments - Bottled, tank, or LP gas (%)
House heating fuel used in apartments - Electricity (%)
House heating fuel used in apartments - Fuel oil, kerosene, etc. (%)
House heating fuel used in apartments - Coal or coke (%)
House heating fuel used in apartments - Wood (%)
House heating fuel used in apartments - Solar energy (%)
House heating fuel used in apartments - Other fuel (%)
House heating fuel used in apartments - No fuel used (%)
Latest news about housing in Ferndale, MD collected exclusively by city-data.com from local newspapers, TV, and radio stations
Median year house/condo built: 1965Median year apartment built: 1979Household type by relationship:
Households: 16,815
Male householders: 2,848 (792 living alone ), Female householders: 3,691 (1,160 living alone )2,958 spouses (2,883 opposite-sex spouses ), 598 unmarried partners , (545 opposite-sex unmarried partners ), 5,015 children (4,940 natural , 56 adopted , 19 stepchildren ), 334 grandchildren , 329 brothers or sisters , 154 parents , 138 foster children , 249 other relatives , 468 non-relatives In group quarters: 28
Size of family households: 1,837 2-persons , 1,140 3-persons , 693 4-persons , 230 5-persons , 226 6-persons , 85 7-or-more-persons .
Size of nonfamily households: 2,046 1-person , 282 2-persons , 104 3-persons .
2,360 married couples with children. single-parent households (102 men , 905 women ).
85.7% of residents of Ferndale speak English at home. of residents speak Spanish at home (70% speak English very well , 11% speak English well , 13% speak English not well , 6% don't speak English at all ).of residents speak other Indo-European language at home (83% speak English very well , 17% speak English well ).of residents speak Asian or Pacific Island language at home (69% speak English very well , 31% speak English well ).of residents speak other language at home (88% speak English very well , 6% speak English well , 1% speak English not well , 5% don't speak English at all ).
Foreign born population: 1,639 (9.7%)of them are naturalized citizens )
Median number of rooms in houses and condos:
Median number of rooms in apartments
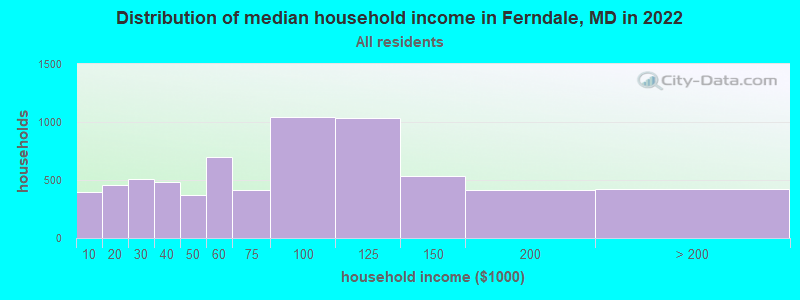
Ferndale, MD household income distribution 393 Less than $10,000460 $10,000 to $19,999509 $20,000 to $29,999481 $30,000 to $39,999368 $40,000 to $49,999702 $50,000 to $59,999415 $60,000 to $74,9991,043 $75,000 to $99,9991,038 $100,000 to $124,999536 $125,000 to $149,999416 $150,000 to $199,999424 $200,000 or more
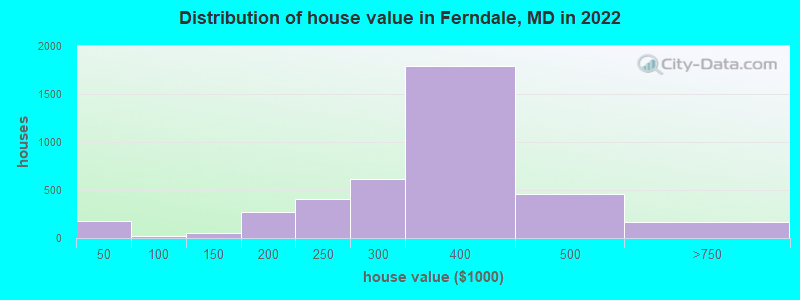
Home value of owner - occupied houses in 2022 in Ferndale, MD 23 Less than $10,000121 $10,000 to $14,99910 $20,000 to $24,99925 $30,000 to $34,99923 $90,000 to $99,99934 $100,000 to $124,99922 $125,000 to $149,99958 $150,000 to $174,999212 $175,000 to $199,999405 $200,000 to $249,999617 $250,000 to $299,9991,789 $300,000 to $399,999458 $400,000 to $499,999144 $500,000 to $749,99919 $750,000 to $999,999Rent paid by renters in 2022 in Ferndale, MD 52 $150 to $19937 $200 to $24936 $250 to $29918 $450 to $49924 $500 to $54967 $600 to $64931 $650 to $69946 $700 to $74910 $900 to $999494 $1,000 to $1,249299 $1,250 to $1,499911 $1,500 to $1,999115 $2,000 to $2,49926 No cash rent
Percentage of workers working in this county: 62.0%Number of people working at home: 1,024 (11.8% of all workers )
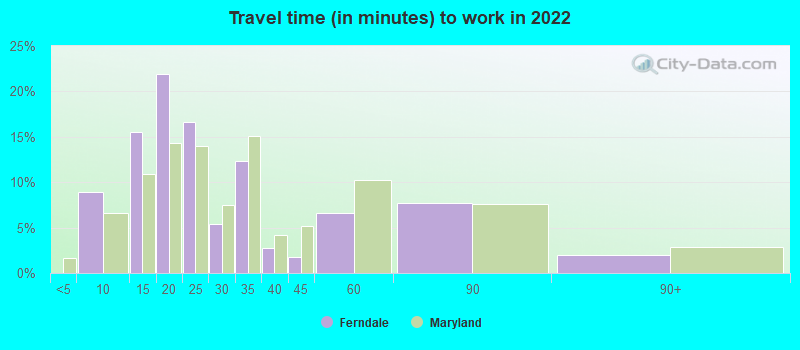
Travel time to work (commute)
Less than 5 minutes: 15 to 9 minutes: 60910 to 14 minutes: 1,03515 to 19 minutes: 1,65720 to 24 minutes: 84025 to 29 minutes: 64430 to 34 minutes: 1,36035 to 39 minutes: 26240 to 44 minutes: 18245 to 59 minutes: 54760 to 89 minutes: 38390 or more minutes: 141
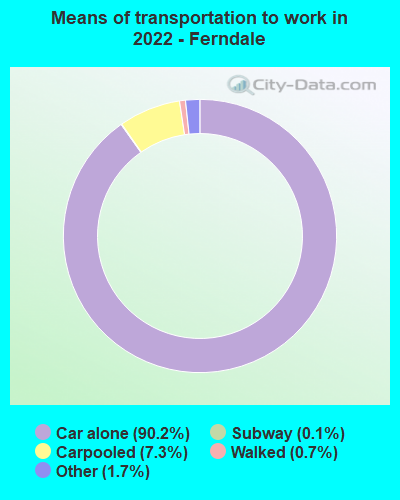
Means of transportation to work:
Drove a car alone: 3,810 (72.8%)Carpooled: 308 (5.9%)Long-distance train or commuter rail : 3 (0.1%)Taxi: 85 (1.6%)Walked: 30 (0.6%)Worked at home: 1,024 (19.6%)
Unemployment by race in 2022
Unemployment rate for White non-Hispanic residents 3.7% Males2.6% FemalesUnemployment rate for Black residents 8.0% Males7.8% FemalesUnemployment rate for Asian residents 12.2% FemalesUnemployment rate for other race residents 6.8% FemalesUnemployment rate for two or more race residents 9.7% FemalesUnemployment rate for Hispanic or Latino residents 5.7% Females
Year of entry for the foreign-born population in Ferndale, Maryland
959 2010 or later 338 2000 to 2009 251 1990 to 1999 249 1980 to 1989 50 1970 to 1979 92 Before 1970
First ancestries reported:
English: 848 (12.1%)
German: 802 (11.4%)
American: 441 (6.3%)
Irish: 411 (5.9%)
African: 303 (4.3%)
Nigerian: 208 (3.0%)
Scottish: 195 (2.8%)
Polish: 178 (2.5%)
Italian: 177 (2.5%)
French: 112 (1.6%)
Eastern European: 93 (1.3%)
Kenyan: 59 (0.8%)
European: 44 (0.6%)
French Canadian: 28 (0.4%)
Liberian: 26 (0.4%)
Scotch-Irish: 25 (0.4%)
Russian: 22 (0.3%)
Senegalese: 19 (0.3%)
Jordanian: 18 (0.3%)
Norwegian: 16 (0.2%)
Czech: 15 (0.2%)
Canadian: 12 (0.2%)
Dutch: 8 (0.1%)
Trinidadian and Tobagonian: 5 (0.07%) Most common places of birth for foreign-born residents (%): Nigeria Ferndale:
20.3% (344)Maryland:
4.6% (44,825)
Argentina Ferndale:
15.1% (255)Maryland:
0.4% (4,282)
El Salvador Ferndale:
11.3% (191)Maryland:
12.0% (115,412)
Philippines Ferndale:
9.2% (156)Maryland:
3.8% (36,698)
Kenya Ferndale:
4.5% (77)Maryland:
0.8% (7,497)
Greece Ferndale:
4.1% (69)Maryland:
0.3% (2,415)
Germany Ferndale:
3.9% (66)Maryland:
1.2% (11,265)
Ghana Ferndale:
3.8% (65)Maryland:
1.8% (17,774)
Jordan Ferndale:
3.7% (63)Maryland:
0.1% (1,277)
Panama Ferndale:
3.4% (57)Maryland:
0.3% (2,848)
Nepal Ferndale:
2.6% (44)Maryland:
1.1% (10,205)
Vietnam Ferndale:
1.9% (32)Maryland:
1.9% (18,716)
Ecuador Ferndale:
1.9% (32)Maryland:
0.6% (6,211)
Mexico Ferndale:
1.7% (28)Maryland:
3.5% (34,065)
Canada Ferndale:
1.6% (27)Maryland:
0.9% (8,603)
Place of birth for U.S.-born residents:
This state: 11,092Other state: 3,774Northeast: 1,083Midwest: 839South: 1,393West: 438 87.1% of Ferndale residents lived in the same house 1 years ago.
Out of people who lived in different houses, 36.4% lived in this county.
Out of people who lived in different counties, 50.2% lived in Maryland.
Ferndale:
87.1%State average:
88.5%
Education attainment for males 25 years and older:
No schooling: 151Nursery to 4th grade: 85th and 6th grade: 67th and 8th grade: 219th grade: 12210th grade: 12711th grade: 3812th grade, no diploma: 135High school graduate (or equivalency): 2,251Less than 1 year of college: 228Some college more than 1 year, no degree: 857Associate degree: 325Bachelor's degree: 643Master's degree: 183Professional school degree: 42Doctorate degree: 132
Education attainment for females 25 years and older:
No schooling: 89Nursery to 4th grade: 05th and 6th grade: 37th and 8th grade: 439th grade: 3210th grade: 12111th grade: 13512th grade, no diploma: 192High school graduate (or equivalency): 1,653Less than 1 year of college: 663Some college more than 1 year, no degree: 777Associate degree: 539Bachelor's degree: 813Master's degree: 759Professional school degree: 0Doctorate degree: 89
Housing units in structures:
One, detached: 4,006One, attached: 1,076Two: 883 or 4: 2455 to 9: 28610 to 19: 91650 or more: 201Housing units lacking complete kitchen facilities in 2022: 1.2%House/condo owner moved in on average 16 years ago
Renter moved in on average 3 years ago
Private vs. public school enrollment:
Students in private schools in grades 1 to 8 (elementary and middle school): 221 Students in private schools in grades 9 to 12 (high school): 20 Students in private undergraduate colleges: 81