Housing density: 1,945 houses/condos per square mile
Median price asked for vacant for-sale houses and condos in 2022 in this county: $280,676.
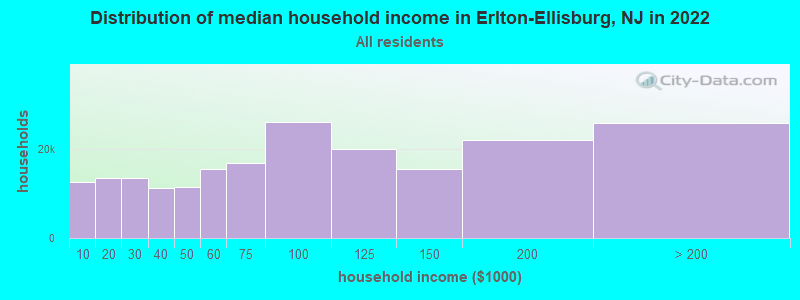
Median contract rent in 2022: $1,272 (lower quartile is $1,065, upper quartile is $1,573)
Median rent asked for vacant for-rent units in 2022: $1,286
Median gross rent in Erlton-Ellisburg, NJ in 2022: $1,461
Housing units in Erlton-Ellisburg with a mortgage: 1,377 (126 second mortgage, 207 home equity loan, 12 both second mortgage and home equity loan) Houses without a mortgage: 701
Compare current foreclosures near Erlton-Ellisburg, NJ:
In family households: 431,734 (82,185 male householders, 47,758 female householders)
88,462 spouses, 162,028 children (152,370 natural, 3,447 adopted, 6,211 stepchildren), 13,516 grandchildren, 6,342 brothers or sisters, 5,878 parents, foster children, 8,583 other relatives, 13,287 non-relatives
In nonfamily households: 74,509 (26,856 male householders (20,736 living alone)), 34,181 female householders (29,446 living alone)), 13,472 nonrelatives
In group quarters: 7,414 (5,604 institutionalized population)
84,681 married couples with children.
35,421 single-parent households (6,804 men, 28,617 women).
83.8% of residents of Erlton-Ellisburg speak English at home.
2.6% of residents speak Spanish at home (56% speak English very well, 19% speak English well, 22% speak English not well, 2% don't speak English at all).
8.9% of residents speak other Indo-European language at home (66% speak English very well, 18% speak English well, 15% speak English not well, 2% don't speak English at all).
3.3% of residents speak Asian or Pacific Island language at home (55% speak English very well, 32% speak English well, 13% speak English not well).
1.4% of residents speak other language at home (71% speak English very well, 22% speak English well, 7% speak English not well).
Foreign born population: 1,823 (22.0%)
(68.1% of them are naturalized citizens)
Year of entry for the foreign-born population in Erlton-Ellisburg, New Jersey
1241995 to March 2000
2431990 to 1994
1831985 to 1989
1081980 to 1984
771975 to 1979
511970 to 1974
541965 to 1969
166Before 1965
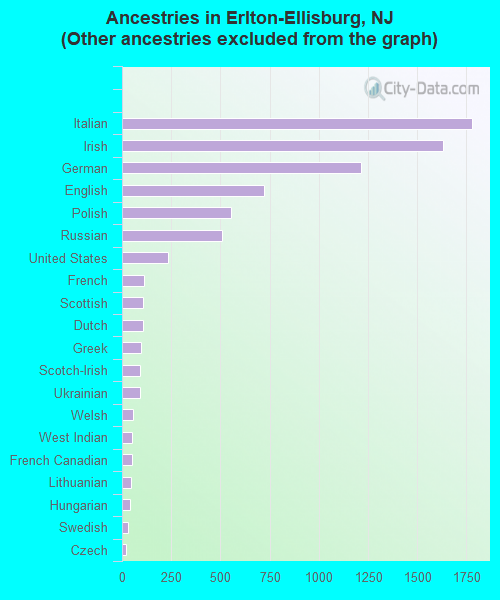
First ancestries reported:
Other: 1,837 (19.5%)
Italian: 1,776 (18.8%)
Irish: 1,632 (17.3%)
German: 1,215 (12.9%)
English: 721 (7.6%)
Polish: 556 (5.9%)
Russian: 506 (5.4%)
United States: 233 (2.5%)
French: 110 (1.2%)
Scottish: 107 (1.1%)
Dutch: 106 (1.1%)
Greek: 98 (1.0%)
Scotch-Irish: 94 (1.0%)
Ukrainian: 90 (1.0%)
Welsh: 56 (0.6%)
West Indian: 53 (0.6%)
French Canadian: 52 (0.6%)
Lithuanian: 48 (0.5%)
Hungarian: 41 (0.4%)
Swedish: 33 (0.3%)
Czech: 18 (0.2%)
Subsaharan African: 14 (0.1%)
Portuguese: 11 (0.1%)
Arab: 10 (0.1%)
Swiss: 8 (0.08%)
Norwegian: 7 (0.07%)
Danish: 6 (0.06%)
Most common places of birth for foreign-born residents (%):
Philippines
Erlton-Ellisburg:
15.4% (155)
New Jersey:
4.7% (69,773)
Russia
Erlton-Ellisburg:
10.0% (101)
New Jersey:
1.4% (20,243)
India
Erlton-Ellisburg:
7.7% (77)
New Jersey:
8.1% (119,497)
Ukraine
Erlton-Ellisburg:
5.6% (56)
New Jersey:
1.0% (14,768)
Italy
Erlton-Ellisburg:
5.0% (50)
New Jersey:
4.0% (58,395)
China, excluding Hong Kong and Taiwan
Erlton-Ellisburg:
4.7% (47)
New Jersey:
2.7% (40,092)
Poland
Erlton-Ellisburg:
4.2% (42)
New Jersey:
3.8% (55,466)
Israel
Erlton-Ellisburg:
3.9% (39)
New Jersey:
0.5% (7,675)
Other Eastern Europe
Erlton-Ellisburg:
3.8% (38)
New Jersey:
1.2% (17,647)
Greece
Erlton-Ellisburg:
3.4% (34)
New Jersey:
0.8% (12,403)
Vietnam
Erlton-Ellisburg:
3.4% (34)
New Jersey:
0.9% (13,337)
Romania
Erlton-Ellisburg:
3.1% (31)
New Jersey:
0.4% (6,115)
Trinidad and Tobago
Erlton-Ellisburg:
2.9% (29)
New Jersey:
0.9% (13,289)
Jamaica
Erlton-Ellisburg:
2.9% (29)
New Jersey:
2.5% (36,443)
United Kingdom
Erlton-Ellisburg:
2.8% (28)
New Jersey:
2.1% (30,355)
Mexico
Erlton-Ellisburg:
2.4% (24)
New Jersey:
4.6% (67,667)
Canada
Erlton-Ellisburg:
1.7% (17)
New Jersey:
1.1% (16,333)
Bangladesh
Erlton-Ellisburg:
1.6% (16)
New Jersey:
0.4% (5,929)
Place of birth for U.S.-born residents:
This state: 3,462
Other state: 3,476
Northeast: 2,858
Midwest: 210
South: 298
West: 110
62% of Erlton-Ellisburg residents lived in the same house 5 years ago. Out of people who lived in different houses, 51% lived in this county. Out of people who lived in different counties, 46% lived in New Jersey.
Education attainment for males 25 years and older:
No schooling: 18
Nursery to 4th grade: 5
5th and 6th grade: 22
7th and 8th grade: 17
9th grade: 31
10th grade: 48
11th grade: 30
12th grade, no diploma: 95
High school graduate (or equivalency): 716
Less than 1 year of college: 166
Some college more than 1 year, no degree: 442
Associate degree: 85
Bachelor's degree: 656
Master's degree: 259
Professional school degree: 111
Doctorate degree: 31
Education attainment for females 25 years and older:
No schooling: 20
Nursery to 4th grade: 23
5th and 6th grade: 11
7th and 8th grade: 56
9th grade: 38
10th grade: 110
11th grade: 51
12th grade, no diploma: 175
High school graduate (or equivalency): 1,112
Less than 1 year of college: 271
Some college more than 1 year, no degree: 356
Associate degree: 193
Bachelor's degree: 678
Master's degree: 195
Professional school degree: 66
Doctorate degree: 29
Housing units in structures:
One, detached: 2,113
One, attached: 153
Two: 32
3 or 4: 386
5 to 9: 30
10 to 19: 73
20 to 49: 6
50 or more: 824
Housing units lacking complete plumbing facilities: 0.3%