Housing density: 1,167 houses/condos per square mile
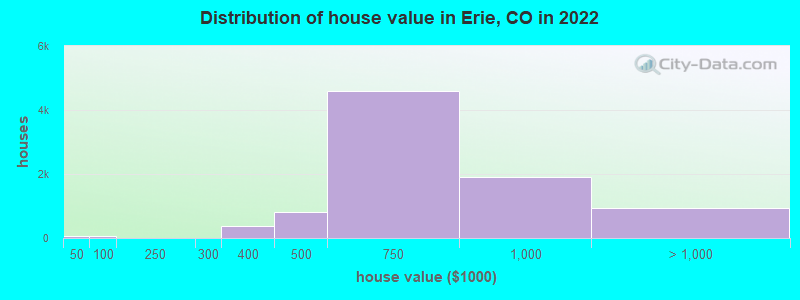
Median price asked for vacant for-sale houses and condos in 2022: $356,551.
Median contract rent in 2022: over $2,000 (lower quartile is $1,834, upper quartile is over $2,000)
Median rent asked for vacant for-rent units in 2022: $4,161
Median gross rent in Erie, CO in 2022: over $2,000
Housing units in Erie with a mortgage: 7,500 (948 second mortgage, 54 home equity loan, 854 both second mortgage and home equity loan) Houses without a mortgage: 132
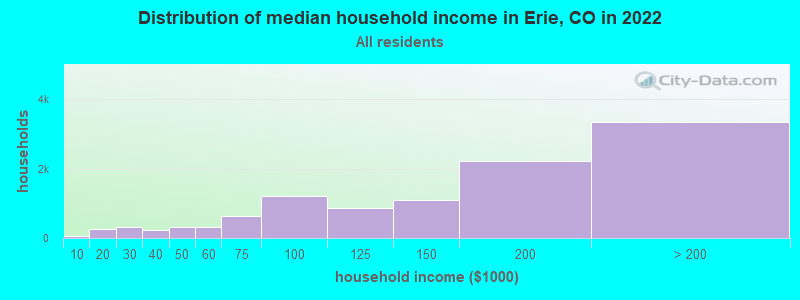
Median household income for houses/condos with a mortgage: $180,445
Median household income for apartments without a mortgage: $125,001
7,719 married couples with children.
1,079 single-parent households (159 men, 920 women).
88.0% of residents of Erie speak English at home.
3.4% of residents speak Spanish at home (78% speak English very well, 14% speak English well, 8% speak English not well).
5.6% of residents speak other Indo-European language at home (72% speak English very well, 23% speak English well, 5% speak English not well).
2.5% of residents speak Asian or Pacific Island language at home (48% speak English very well, 19% speak English well, 32% speak English not well).
0.1% of residents speak other language at home (84% speak English very well, 16% speak English well).
Foreign born population: 2,639 (8.7%)
(57.3% of them are naturalized citizens)
Percentage of workers working in this county: 57.5% Number of people working at home: 5,746 (35.1% of all workers)
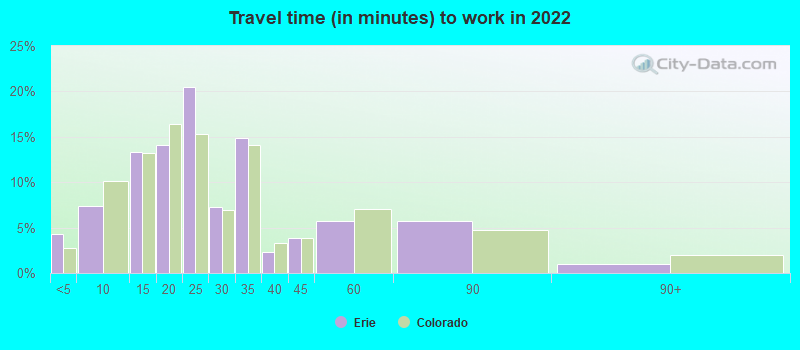
Travel time to work (commute)
Less than 5 minutes: 208
5 to 9 minutes: 442
10 to 14 minutes: 894
15 to 19 minutes: 1,760
20 to 24 minutes: 2,021
25 to 29 minutes: 995
30 to 34 minutes: 1,876
35 to 39 minutes: 444
40 to 44 minutes: 354
45 to 59 minutes: 861
60 to 89 minutes: 536
90 or more minutes: 65
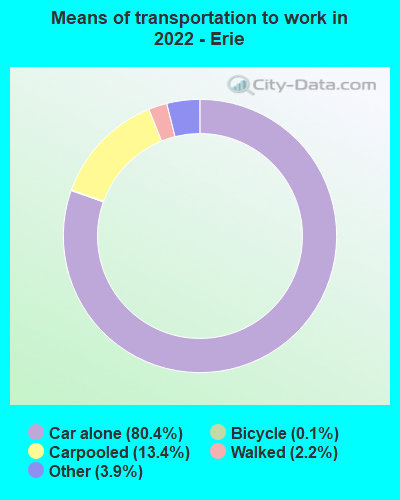
Means of transportation to work:
Drove a car alone: 3,990 (39.9%)
Carpooled: 755 (7.5%)
Taxi: 295 (2.9%)
Bicycle: 6 (0.1%)
Walked: 119 (1.2%)
Worked at home: 5,746 (57.4%)
Unemployment by race in 2022
Unemployment rate for White non-Hispanic residents
1.0%Males
4.8%Females
Unemployment rate for Asian residents
1.2%Males
Unemployment rate for other race residents
21.8%Females
Unemployment rate for two or more race residents
13.9%Males
3.2%Females
Unemployment rate for Hispanic or Latino residents
7.5%Males
2.5%Females
Year of entry for the foreign-born population in Erie, Colorado
1,1862010 or later
5482000 to 2009
4431990 to 1999
791980 to 1989
531970 to 1979
54Before 1970
First ancestries reported:
German: 1,833 (15.0%)
English: 1,487 (12.2%)
American: 1,262 (10.3%)
European: 1,067 (8.7%)
Irish: 859 (7.0%)
Italian: 352 (2.9%)
Scottish: 303 (2.5%)
British: 278 (2.3%)
Polish: 265 (2.2%)
Norwegian: 173 (1.4%)
Eastern European: 151 (1.2%)
Swedish: 142 (1.2%)
Czech: 137 (1.1%)
French Canadian: 121 (1.0%)
Russian: 115 (0.9%)
Austrian: 108 (0.9%)
French: 108 (0.9%)
Ukrainian: 100 (0.8%)
Armenian: 72 (0.6%)
Belgian: 68 (0.6%)
Croatian: 64 (0.5%)
Northern European: 56 (0.5%)
Lithuanian: 52 (0.4%)
Dutch: 49 (0.4%)
Iranian: 42 (0.3%)
Welsh: 41 (0.3%)
Scandinavian: 30 (0.2%)
Canadian: 24 (0.2%)
Hungarian: 23 (0.2%)
Slovak: 20 (0.2%)
Swiss: 15 (0.1%)
Finnish: 14 (0.1%)
Slavic: 12 (0.10%)
Scotch-Irish: 12 (0.10%)
Greek: 12 (0.10%)
Jamaican: 11 (0.09%)
Australian: 9 (0.07%)
Latvian: 9 (0.07%)
Danish: 8 (0.07%)
Estonian: 8 (0.07%)
African: 8 (0.07%)
Czechoslovakian: 6 (0.05%)
Lebanese: 3 (0.02%)
Most common places of birth for foreign-born residents (%):
India
Erie:
23.2% (634)
Colorado:
4.0% (21,689)
China, excluding Hong Kong and Taiwan
Erie:
6.0% (164)
Colorado:
3.3% (17,998)
Canada
Erie:
5.8% (160)
Colorado:
2.7% (15,026)
Vietnam
Erie:
5.7% (155)
Colorado:
3.0% (16,616)
Germany
Erie:
4.9% (135)
Colorado:
2.5% (13,706)
England
Erie:
4.8% (131)
Colorado:
1.2% (6,672)
Argentina
Erie:
4.8% (131)
Colorado:
0.6% (3,016)
Mexico
Erie:
4.5% (124)
Colorado:
38.3% (209,491)
United Kingdom, excluding England and Scotland
Erie:
4.1% (111)
Colorado:
1.1% (5,799)
Russia
Erie:
3.5% (96)
Colorado:
1.4% (7,860)
Philippines
Erie:
3.4% (93)
Colorado:
2.3% (12,342)
Poland
Erie:
2.3% (63)
Colorado:
0.9% (4,772)
Colombia
Erie:
2.2% (60)
Colorado:
1.1% (5,971)
Korea
Erie:
2.0% (55)
Colorado:
2.9% (15,981)
Iran
Erie:
2.0% (55)
Colorado:
0.7% (3,568)
Austria
Erie:
1.9% (51)
Colorado:
0.2% (823)
Laos
Erie:
1.8% (48)
Colorado:
0.4% (2,063)
Spain
Erie:
1.8% (48)
Colorado:
0.3% (1,788)
Place of birth for U.S.-born residents:
This state: 11,204
Other state: 16,025
Northeast: 2,820
Midwest: 5,139
South: 3,806
West: 4,208
84.8% of Erie residents lived in the same house 1 years ago. Out of people who lived in different houses, 17.6% lived in this county. Out of people who lived in different counties, 72.4% lived in Colorado.
Erie:
84.8%
State average:
83.6%
Education attainment for males 25 years and older:
No schooling: 0
Nursery to 4th grade: 13
5th and 6th grade: 28
7th and 8th grade: 62
9th grade: 40
10th grade: 0
11th grade: 0
12th grade, no diploma: 57
High school graduate (or equivalency): 1,069
Less than 1 year of college: 377
Some college more than 1 year, no degree: 1,160
Associate degree: 621
Bachelor's degree: 3,565
Master's degree: 1,621
Professional school degree: 322
Doctorate degree: 660
Education attainment for females 25 years and older:
No schooling: 68
Nursery to 4th grade: 0
5th and 6th grade: 0
7th and 8th grade: 0
9th grade: 53
10th grade: 42
11th grade: 20
12th grade, no diploma: 108
High school graduate (or equivalency): 981
Less than 1 year of college: 427
Some college more than 1 year, no degree: 1,173
Associate degree: 649
Bachelor's degree: 3,788
Master's degree: 2,106
Professional school degree: 271
Doctorate degree: 426
Housing units in structures:
One, detached: 9,634
One, attached: 678
3 or 4: 77
5 to 9: 74
10 to 19: 230
20 to 49: 120
50 or more: 33
Mobile homes: 181
Housing units lacking complete plumbing facilities in 2022: 0.8%
Housing units lacking complete kitchen facilities in 2022: 0.5%